Washington Federal, Inc. (ticker: WAFD)
2024-01-28
 Washington Federal, Inc., operating under the stock ticker WAFD, is a bank holding company that provides retail banking services, commercial banking solutions, and financial products to its customers. Founded in 1917 and headquartered in Seattle, Washington, the company mainly operates in the Pacific Northwest, with branches spanning across eight states. It offers a comprehensive suite of services, including business and consumer loans, deposit accounts, insurance products, and wealth management services. Washington Federal is known for its commitment to serving the long-term financial needs of its communities, focusing on sustainability and personalized customer service. The corporation has shown resilience and stability over the years, reflecting in its financial performance and the trust it has built with its customer base. As a publicly traded entity on the NASDAQ, WAFD is subject to regulatory oversight and financially transparent, providing regular reports on earnings, dividends, and strategic developments that inform investor decision-making.
| Full Time Employees | 2,120 | CEO Pay | $4,741,800 | CFO Pay | $2,096,152 |
| COO Pay | $2,262,335 | Chief Credit Officer Pay | $2,411,517 | Chief Commercial Banker Pay | $2,772,492 |
| Chief Consumer Banker Pay | $1,806,599 | Dividend Rate | $1.00 | Dividend Yield | 3.26% |
| Payout Ratio | 29.33% | Five Year Avg Dividend Yield | 2.95% | Beta | 0.882 |
| Trailing PE | 9.01 | Forward PE | 9.45 | Volume | 189,093 |
| Average Volume | 323,626 | Average Volume 10 Days | 337,020 | Market Cap | $1,973,904,384 |
| 52 Week Low | $23.36 | 52 Week High | $37.29 | Price to Sales Trailing 12 Months | 2.93 |
| Fifty Day Average | $30.13 | Two Hundred Day Average | $27.96 | Trailing Annual Dividend Rate | $1.01 |
| Trailing Annual Dividend Yield | 3.34% | Enterprise Value | $5,004,130,304 | Profit Margins | 35.12% |
| Float Shares | 63,141,809 | Shares Outstanding | 64,254,700 | Shares Short | 1,166,403 |
| Short Ratio | 3.03 | Held Percent Insiders | 2.28% | Held Percent Institutions | 86.94% |
| Book Value | $33.49 | Price to Book | 0.92 | Earnings Quarterly Growth | -26.5% |
| Net Income to Common | $221,744,992 | Trailing Eps | $3.41 | Forward Eps | $3.25 |
| Revenue Growth | -14.4% | Operating Margins | 45.93% | Total Cash | $1,144,774,016 |
| Total Cash Per Share | $17.82 | Total Debt | $3,875,000,064 | Total Revenue | $673,016,000 |
| Revenue Per Share | $10.37 | Return On Assets | 1.07% | Return On Equity | 9.90% |
| Sharpe Ratio | -11.425499498944863 | Sortino Ratio | -193.07703535462457 |
| Treynor Ratio | -0.010449860224379805 | Calmar Ratio | -0.21078605135149708 |
The analysis of Washington Federal, Inc. (symbol: WAFD) encompasses evaluation of recent technical indicators, fundamental data, and the company's financial statements. This comprehensive approach will yield a synthesized forecast for the stock's price movement in the upcoming months.
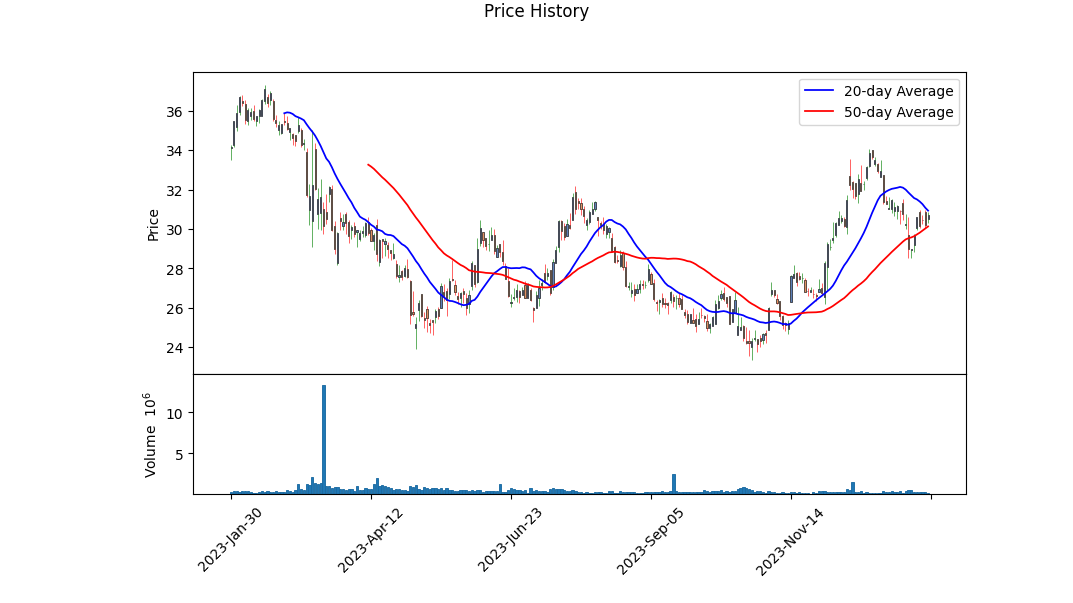
Technical Analysis Overview: The analysis is based on the stock's price, volume, and momentum data. As of the last trading day, the On-Balance Volume (OBV) shows an increasing trend, signaling accumulating volume and potential buying interest that can lead to upward price pressure. However, the MACD Histogram indicates a negative momentum as the value is below zero, suggesting that the stock may experience a consolidation or downward movement in the short term.
Fundamental Analysis Highlights: Washington Federal's fundamentals reveal some areas of concern, particularly a noticeable decline in earnings growth (-0.267) and revenue growth (-0.144). The company however maintains a strong operating margin of 0.45933, which implies efficient management and a potential for profit in the operations. The consistent downturn in earnings may be affecting investor sentiment, which could weigh on the stock's future performance. These fundamental factors must be taken into account when assessing the resilience and growth potential of the organization in the volatile market environment.
Financial and Balance Sheet Insight: A thorough evaluation of recent financial and balance sheet data exposes some significant insights. The company has managed to decrease its net debt, which is a promising sign of fiscal responsibility and could potentially solidify its financial standings against market volatility. The balance sheet further reveals a solid structure with tangible book value growth and a stable retained earnings figure. There is, however, a notable increase in total liabilities, which implies higher leverage and possible financial risk, a factor that investors should monitor closely.
Cash Flow Considerations: The analysis of the cash flows shows positive free cash flow, which is an indicator of the companys ability to generate cash after funding operations and capital expenditures. Also, the large debt transactions in the form of repayments and new issuances suggest significant financial restructuring. Its crucial to note that such activities could impact both the cost of capital and the liquidity profile of the firm.
Market Sentiment and Analyst Expectations: The negative Sharpe, Sortino, Treynor, and Calmar ratios underscore high volatility and underperformance in relation to risk, which may deter certain investors. Nevertheless, growth estimates for the next year look favorable (+18.2%), hinting at a turnaround potentially driven by strategic changes or market conditions.
Risk Assessment and Portfolio Fit: Regarding the WAFD's potential in an investment portfolio, the current risk indicators highlight a high-risk profile, and thus, caution is advised in position sizing and overall portfolio weighting.
Conclusion and Synthesis: In the context of both technical and fundamental data points, WAFD is currently navigating a complex market situation. While technical indicators show potential for a bullish trend continuation, the negative earnings and revenue growth, alongside the risk metrics, suggest that there are substantial challenges ahead. Nevertheless, sound operating margins and positive free cash flow imply operational robustness. Moving forward, if the company manages to improve its fundamental performance and align with the growth projections, we could witness a gradual appreciation in stock price. Monitoring these interrelated elements will be crucial in providing more precise guidance in the mid to long-term trajectory. Prices might face continued volatility in the immediate few months, but the potential for a positive correction is present provided there is an improvement in the aforementioned fundamental concerns. Investors should consider their own risk tolerance and investment strategy before making a decision regarding WAFD.
| Statistic Name | Statistic Value |
| R-squared | 0.361 |
| Adj. R-squared | 0.360 |
| F-statistic | 707.9 |
| Prob (F-statistic) | 4.77e-124 |
| Log-Likelihood | -2,527.9 |
| AIC | 5,060 |
| BIC | 5,070 |
| coef (const) | -0.0255 |
| coef (0) | 1.0314 |
| std err (const) | 0.051 |
| std err (0) | 0.039 |
| t (const) | -0.500 |
| P>|t| (const) | 0.617 |
| [0.025 (const) | -0.126 |
| 0.975 (const) | 0.075 |
| t (0) | 26.606 |
| P>|t| (0) | 0.000 |
| [0.025 (0) | 0.955 |
| 0.975 (0) | 1.107 |
| Omnibus | 159.756 |
| Prob(Omnibus) | 0.000 |
| Jarque-Bera (JB) | 1615.640 |
| Skew | 0.103 |
| Kurtosis | 8.550 |
| Cond. No. | 1.32 |
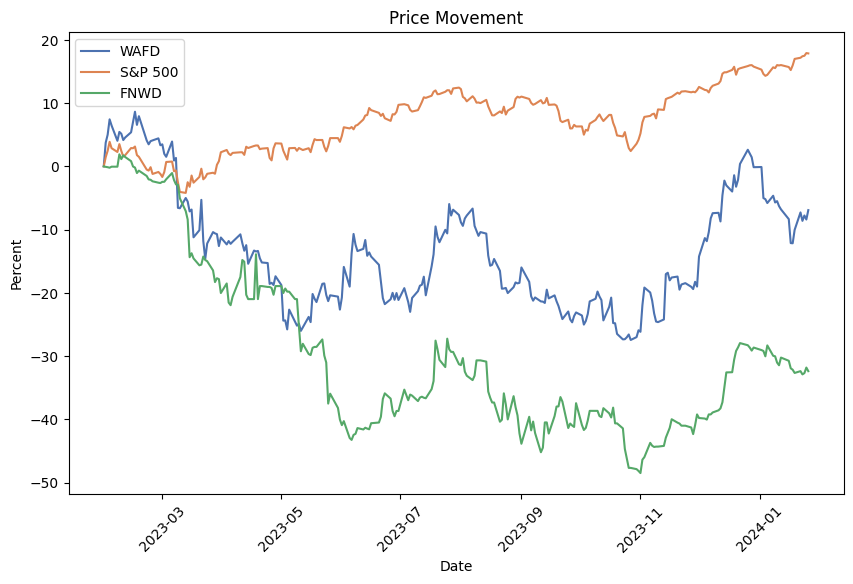
In the linear regression analysis of Washington Federal (WAFD) and the SPDR S&P 500 ETF (SPY), the coefficient of determination (R-squared) is 0.361, indicating that approximately 36.1% of the variability in WAFD's stock price can be explained by the model that uses SPY as a predictor. The adjusted R-squared value is very close, at 0.360, which takes into account the number of predictors in the model and provides a more penalized adjustment to R-squared given that there's only one independent variable. The model exhibits a statistically significant relationship with a very low probability (p-value <0.0001) that the relationship is due to chance, as depicted by the Prob (F-statistic). Alpha, or the intercept, is at -0.0255, which, although negative, is not statistically significant (p-value = 0.617), indicating that at zero market return, the expected return on WAFD is slightly below zero but not distinct from it in a statistical sense.
The slope of the regression line, represented by beta (coefficient for SPY), is 1.0314, suggesting that for every one percentage point change in the SPY, the expected change in WAFD is approximately 103.14 basis points (1.0314%). Having a beta of more than 1 implies WAFD has a more volatile response than the market to systematic risk. However, alpha's significance or lack thereof is an important aspect to consider. Given that alpha is not significantly different from zero, the excess return of WAFD over the market rate of return is not substantial enough to conclude that the stock offers a positive or negative abnormal return over the period analyzed. This relationship can help in understanding the performance of WAFD relative to the market as captured by SPY, particularly useful for investors considering WAFD's behavior in a diversified portfolio.
Washington Federal, Inc. (WAFD) filed its quarterly SEC 10-Q report for the period ended June 30, 2023, presenting a comprehensive overview of its financial activities and outcomes during this quarter. The report delineates the performance, financial position, and operational strategies of Washington Federal for the third quarter of 2023, reflecting substantial aspects of its banking and financial services operations.
The financial statements indicate that Washington Federal maintained a robust balance sheet with total assets of $22.55 billion as of June 30, 2023, compared to $20.77 billion at the end of the previous fiscal year. Key components of the company's assets include cash and cash equivalents which stood at approximately $1.14 billion, reflecting an increase from $684 million. Loans receivable, net of allowance for loan losses, constituted the most significant portion of assets, amounting to $17.38 billion, up from $16.11 billion. Washington Federal saw an increase in available-for-sale securities, at $2.04 billion, and held-to-maturity securities, at $434 million. Customer accounts totaled $16.12 billion, which is slightly higher when compared to the figure at the beginning of the fiscal year. Meanwhile, Washington Federal retained shareholders equity of $2.39 billion by the end of the quarter.
For the third quarter of 2023, Washington Federal reported net income of $61.77 million, whereas it was slightly higher at $63.30 million during the same period in the previous year. The net interest income for the quarter stood at $168.7 million, influenced by interest income of $272.4 million and an interest expense of $103.78 million. The provision for credit losses amounted to $9 million, a rise from $1.5 million in the same quarter of the prior year. Significantly, the bank recognized that loans and other receivables remained a primary source of its interest income, summing up to $232.17 million. Moreover, other income, such as fees and service charges, contributed $13.77 million to the total revenue.
Washington Federal's operational costs included compensation and benefits, occupancy, FDIC insurance premiums, product delivery, and other expenses, totaling $94.7 million for the quarter. Furthermore, the report revealed a comprehensive income of $65.30 million, which took into account not just net income but also other comprehensive income elements like unrealized gains and losses on investment securities.
Notably, Washington Federal managed a considerable level of liquidity, as evidenced by the cash flows from operating activities which generated $131.07 million. The investing activities showed a net cash outflow of $1.29 billion, mainly due to origination and purchase of loans alongside purchases of securities. Financing activities demonstrated a net inflow of $1.61 billion, led primarily by net increases in customer accounts and proceeds from borrowings.
The bank also detailed its policy on allowances for credit losses, which is based on expected credit losses over the life-span of the loans, considering factors like historical loss experience, current conditions, and economic forecasts. This allowance ensures that the bank maintains an appropriate reserve for potential credit losses. Moreover, Washington Federal maintained guidance compliance with the expectations of credit losses on held-to-maturity and available-for-sale debt securities.
Overall, the 10-Q filing painted a picture of a bank with solid asset growth and sustained earnings, albeit with a minor dip compared to the previous year. Washington Federal displayed comprehensive risk management frameworks through its updated expected credit loss and impairment models and exhibited stable financial health through its capital and balance sheet management.
Washington Federal, Inc. (WaFd), a savings and loan holding company operating under the brand WaFd Bank, has recently disclosed its financial results for the quarter which ended on December 31, 2023. The bank has shown a mixed set of financial data with year-over-year declines but sequential quarterly growth in earnings that may interest investors keen on the company's operational performance.
The bank recorded a 16% increase in net earnings from the previous quarter ending September 30, 2023, standing at $58,453,000. This upward trend, however, contrasts with the annual perspective which revealed a 26% decline from the $79,509,000 documented in the quarter that ended December 31, 2022. This variation in earnings reflects the dynamic economic circumstances and the bank's operational responses over the respective periods.
For common shareholders, the adjusted net income calculated after consideration for the preferred stock dividends was $0.85 per diluted share for the most recent quarter. This statistic represents an 18% growth from the $0.72 reported in the quarter just before, but a 27% dip when compared to the equal quarter in the prior year.
Analyzing the banks returns, the return on common shareholders equity was reported at 10.21% for the December 2023 quarter, which signifies an improvement from the 8.73% in the preceding quarter. Although, it is still a considerable reduction from 15.15% from the end of December 2022 quarter. Return on assets followed a similar pattern at 1.0% for the most recent quarter, climbing from 0.9% and slipping from the 1.5% from the same quarter the year before.
Brent Beardall, the CEO of WaFd Bank, addressed the decline in net interest margin which sat at 2.91%, down from the 3.69% peak of the prior year-end quarter. The Federal Reserve's actions on increasing interest rates have inevitably led to market conditions such as the prolonged inverted yield curve that affected the margin performance. Nevertheless, Beardall remained optimistic, particularly in light of prospective policy relaxations expected from the Federal Reserve in 2024, which could ease certain financial pressures.
In terms of credit performance, the bank reported a shift back to net recoveries after two quarters marked by substantial credit losses. It highlighted favorable credit metrics with delinquencies positioned at 0.33% and non-performing loans at a modest 0.26% of the total loans. These figures demonstrate the banks competent risk management and strong credit culture.
Operationally, WaFd indicated mild asset growth reaching $22.6 billion, benefiting from both an increase in net loans and cash reserves, despite a shrink in the fair value of hedge assets. However, the bank observed a slight decrease in customer deposits to $16.0 billion and noted a deceleration in new loan originations amidst a general cooling in the construction loans segment.
Despite some operational setbacks, the bank emphasized its consistent commitment to adding value for its clients through exceptional customer service and technology-driven initiatives. Looking ahead, WaFd anticipates its impending acquisition of Luther Burbank Corporation to culminate during the first quarter of 2024, an event that carries potential implications for enhancing profitability and operational scope.
The bank's comprehensive financial performance further highlights an undeterred commitment to resilient financial positioning and strategic opportunities for future growth. The complete set of quarterly financial results and additional narrations on the banks performance parameters have been made publicly available through a Business Wire press release on January 16, 2024.
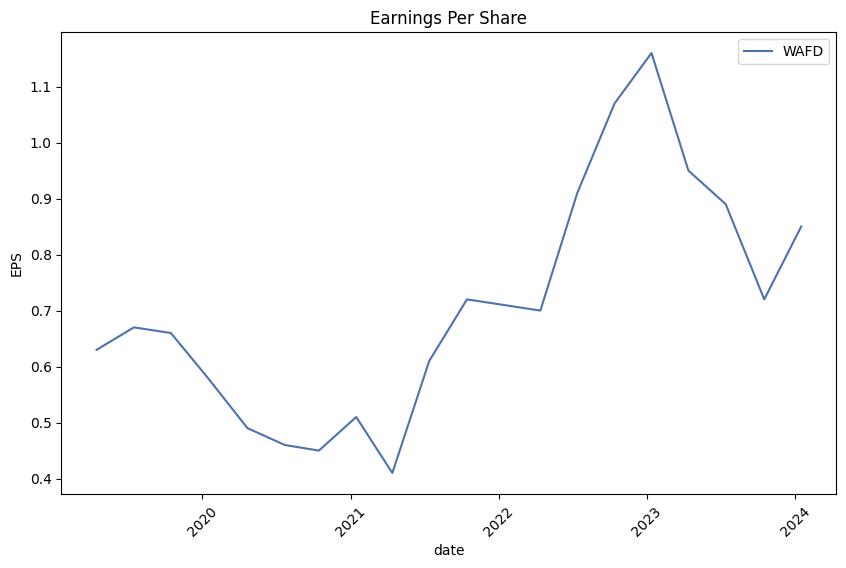
In addition to quarterly insights provided directly from WaFd, an independent analysis by Simply Wall St, underscores the banks financial health. The report identified WaFds consistent ability to elevate its EPS, as well as its judicious CEO compensation practices and significant insider ownership as signs of robust growth potential and sound corporate governance. These financial achievements, combined with a prudent operational philosophy, present WaFd as a noteworthy contender for investment consideration. The further details on WaFd's projected growth and financial outlook are accessible in the report via Simply Wall St.
Washington Federal, Inc. (WAFD) exhibited fluctuations in its return volatility between January 29, 2019, and January 26, 2024. The ARCH model applied suggests that there is a substantial level of volatility, as indicated by the coefficient of the omega parameter. Additionally, the alpha[1] parameter shows that past volatility has a significant effect on current volatility, with higher past values leading to higher current volatility.
| Statistic Name | Statistic Value |
|---|---|
| Mean Model | Zero Mean |
| Vol Model | ARCH |
| Log-Likelihood | -2707.13 |
| AIC | 5418.27 |
| BIC | 5428.54 |
| No. Observations | 1,257 |
| Df Residuals | 1,257 |
| omega | 2.9827 |
| alpha[1] | 0.4889 |
In financial analysis, understanding and quantifying risk is essential when deciding to invest in a particular stock. For Washington Federal, Inc., an investment of $10,000 carries certain risks that can be analyzed through a combination of volatility modeling and machine learning predictions.
Volatility modeling is a statistical approach used to estimate the variance in an asset's returns over time, which in essence provides insight into how much the price of the asset can fluctuate. For a stock like Washington Federal, Inc., it is a critical tool to capture the nature of its price movements. By applying a Generalized Autoregressive Conditional Heteroskedasticity (GARCH) type model, which is well-suited for financial time series data that exhibits time-varying volatility or clustering, we can identify patterns of variance and model them into the future.
The use of this model enables the estimation of the volatility of the stock over the next year, which is an important input when considering potential changes in the stock's price. By understanding the dynamics of volatility, investors can gauge the level of uncertainty or risk associated with the investment. Volatility modeling can also indicate the potential for large price swings, both upward and downward.
Complementing this approach, machine learning predictions through algorithms like the RandomForestRegressor can be employed to predict future stock returns. This algorithm works by training decision trees on different parts of the dataset and averaging the predictions. It inspects the historical data available for Washington Federal, Inc., identifies patterns and relationships between different variables, and then uses this information to forecast future stock price movements.
Combining these two methods provides a multi-dimensional view of the potential risk. The volatility model captures the underlying variability in the stock price, while the machine learning algorithm provides forward-looking predictions that take into account a multitude of factors beyond historical volatility.
Applying these methods to Washington Federal, Inc., if the calculated Annual Value at Risk (VaR) at a 95% confidence level is $381.75 for a $10,000 investment, this indicates that there is a 5% chance that the investor could lose more than $381.75 over the next year. In other words, with 95% confidence, the investor would not expect to lose more than this amount in a worst-case scenario based on normal market conditions within the modeled assumptions and historical patterns.
Analyzing the value at risk combines the probabilistic outcomes of the machine learning predictions and the volatility estimation, painting a picture of both the expected returns and the bounds of typical losses. Being able to quantify the potential downside with a specific monetary value helps in understanding the risk-reward profile associated with the investment and aids in the decision-making process for risk-averse investors.
Similar Companies in BanksRegional:
Finward Bancorp (FNWD), Great Southern Bancorp, Inc. (GSBC), First Mid Bancshares, Inc. (FMBH), Franklin Financial Services Corporation (FRAF), Community West Bancshares (CWBC), Penns Woods Bancorp, Inc. (PWOD), Luther Burbank Corporation (LBC), 1st Source Corporation (SRCE), Waterstone Financial, Inc. (WSBF), Southern Missouri Bancorp, Inc. (SMBC), IF Bancorp, Inc. (IROQ), Colony Bankcorp, Inc. (CBAN), Old Point Financial Corporation (OPOF), Shore Bancshares, Inc. (SHBI), Western New England Bancorp, Inc. (WNEB), Investar Holding Corporation (ISTR), Northfield Bancorp, Inc. (Staten Island, NY) (NFBK), Sierra Bancorp (BSRR), Bogota Financial Corp. (BSBK), The First Bancorp, Inc. (FNLC), First Financial Corporation (THFF), Columbia Banking System, Inc. (COLB), Banner Corporation (BANR), Heritage Financial Corporation (HFWA), Westamerica Bancorporation (WABC), Umpqua Holdings Corporation (UMPQ), Pacific Premier Bancorp, Inc. (PPBI), Glacier Bancorp, Inc. (GBCI), First Interstate BancSystem, Inc. (FIBK)
https://finance.yahoo.com/news/wafds-nasdaq-wafd-earnings-warrant-112814724.html
https://finance.yahoo.com/news/wafd-announces-quarterly-earnings-per-220000021.html
https://www.sec.gov/Archives/edgar/data/936528/000093652823000150/wfsl-20230630.htm
Copyright © 2024 Tiny Computers (email@tinycomputers.io)
Report ID: 9WFLqc
Cost: $0.32573
https://reports.tinycomputers.io/WAFD/WAFD-2024-01-28.html Home