Western Midstream Partners, LP (ticker: WES)
2024-05-14
 Western Midstream Partners, LP (ticker: WES), is a master limited partnership (MLP) primarily engaged in the business of gathering, processing, and transporting natural gas, crude oil, and natural gas liquids (NGLs) across the United States. The company operates a diverse portfolio of midstream assets that are strategically located in major resource plays, including the Delaware Basin, DJ Basin, and the Marcellus Shale, among others. WES focuses on providing essential midstream services that enhance the efficiency and value of hydrocarbon production for its customers, which include major oil and gas producers. With a strong emphasis on operational excellence and financial stability, Western Midstream aims to deliver sustainable distribution growth to its unitholders. As of the latest reporting period, the company has demonstrated consistent financial performance, supported by long-term contracts and a resilient business model that mitigates market volatility.
| Total Employees | 1,377 | Previous Close | 37.12 | Open | 37.39 |
| Day Low | 37.04 | Day High | 37.58 | Dividend Rate | 3.50 |
| Dividend Yield | 0.0943 | Ex-Dividend Date | May 30, 2024 | Payout Ratio | 0.7235 |
| Five Year Avg Dividend Yield | 10.88 | Trailing PE | 10.532394 | Forward PE | 10.386111 |
| Volume | 520,252 | Average Volume | 1,392,219 | Average Volume (10 days) | 1,595,540 |
| Bid | 37.36 | Ask | 37.41 | Bid Size | 1,000 |
| Ask Size | 900 | Market Cap | 14,226,558,976 | 52 Week Low | 25.04 |
| 52 Week High | 37.66 | Price to Sales (Trailing 12 Months) | 4.3636765 | Fifty Day Average | 35.0888 |
| Two Hundred Day Average | 29.8407 | Trailing Annual Dividend Rate | 1.713 | Trailing Annual Dividend Yield | 0.046147633 |
| Profit Margins | 0.41687 | Float Shares | 193,968,050 | Shares Outstanding | 380,491,008 |
| Shares Short | 6,953,394 | Shares Short Prior Month | 5,852,614 | Date Short Interest | May 30, 2024 |
| Shares Percent Shares Out | 0.0183 | Held Percent Insiders | 0.0032600001 | Held Percent Institutions | 0.90681 |
| Short Ratio | 7.67 | Short Percent of Float | 0.0367 | Implied Shares Outstanding | 380,491,008 |
| Book Value | 8.518 | Price to Book | 4.3895283 | Last Fiscal Year End | January 1, 2024 |
| Next Fiscal Year End | January 1, 2025 | Most Recent Quarter | April 1, 2024 | Earnings Quarterly Growth | 1.812 |
| Net Income to Common | 1,359,073,024 | Trailing EPS | 3.55 | Forward EPS | 3.6 |
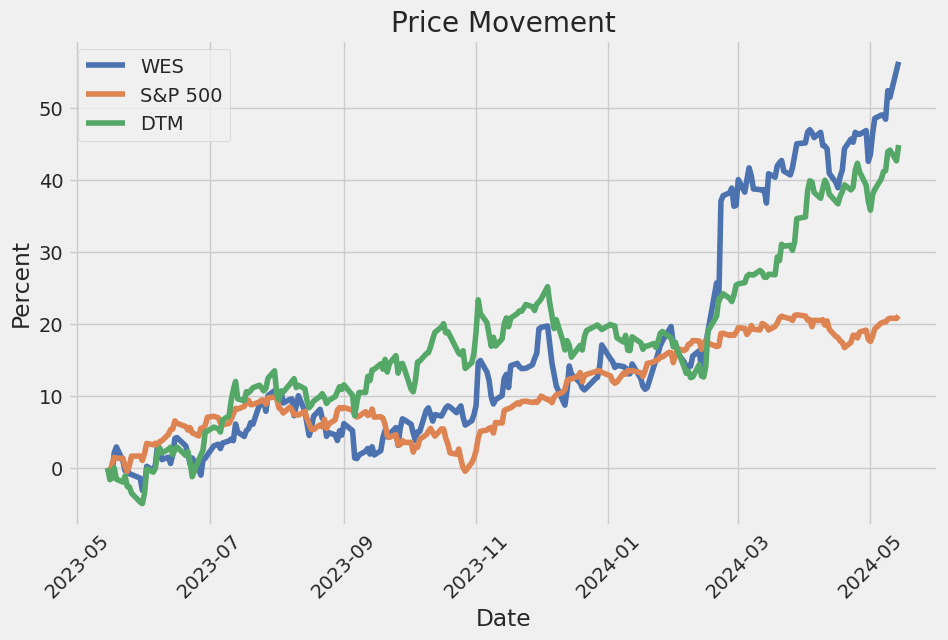
| PEG Ratio | 2.81 | 52 Week Change | 0.44267392 | S&P 52 Week Change | 0.2704494 |
| Last Dividend Value | 0.875 | Last Dividend Date | May 30, 2024 | Current Price | 37.39 |
| Target High Price | 40.0 | Target Low Price | 31.0 | Target Mean Price | 35.82 |
| Target Median Price | 35.0 | Recommendation Mean | 2.7 | Number of Analyst Opinions | 11 |
| EBITDA | 2,019,913,984 | Total Debt | 7,272,078,848 | Current Ratio | 1.506 |
| Total Revenue | 3,260,222,976 | Debt to Equity | 215.387 | Revenue per Share | 8.536 |
| Return on Assets | 0.07437 | Return on Equity | 0.44022998 | Free Cashflow | 234,652,624 |
| Operating Cashflow | 1,758,617,984 | Earnings Growth | 1.841 | Revenue Growth | 0.209 |
| Gross Margins | 0.71093005 | EBITDA Margins | 0.61956 | Operating Margins | 0.45843 |
| Sharpe Ratio | 1.818 | Sortino Ratio | 36.317 |
| Treynor Ratio | 0.568 | Calmar Ratio | 6.147 |
Regarding WES's stock price movement over the next few months, we can derive our analysis based on a comprehensive summary of technical indicators, fundamental performance metrics, balance sheet health, and standardized financial ratios.
From a technical analysis perspective, WES has recently shown upward momentum. The latest On-Balance Volume (OBV) trends appear positive, reflecting significant buying interest as OBV rose markedly from 0.104 million to 2.589 million over a span of months. This typically suggests accumulation by market participants. Additionally, the Moving Average Convergence Divergence (MACD) histogram shows improvement with positive values, indicating strengthening bullish momentum. These technical signals suggest upward price potential in the short to medium term.
On the fundamental front, WES demonstrates robust profitability metrics with a gross margin of 71.1%, EBITDA margin of 61.96%, and an operating margin of 45.84%. Such high margins indicate operational efficiency and strong revenue management, critical for maintaining investor confidence and sustaining stock price growth. The earnings figures are also promising, with a Net Income of $1.022 billion up from $527 million in the previous period, indicating substantial growth. A healthy EBITDA of approximately $1.988 billion underscores the company's strong earnings potential.
Analyzing the cash flow statement, WES has a significant Free Cash Flow of $926 million, indicating robust liquidity and the ability to fund operations, dividends, and debt reduction. Positive cash flow is a strong indicator for potential future stock price appreciation, given that it reflects the firm's capability to generate internal funds.
In terms of balance sheet health, WES holds total assets of $12.265 billion against total liabilities of $8.889 billion, providing a relatively safe leverage position. The Net Debt stands at $7.592 billion, and capital structure stability will be a key investor focus. However, the company shows comprehensive debt issuance and repayment movements, ensuring flexibility in financial operations.
Financial ratios provide an additional layer of insight into WES's risk-adjusted return profile. A Sharpe Ratio of 1.818 indicates the stock's return exceeds the risk-free rate by a notable margin when adjusted for volatility. The exceptionally high Sortino Ratio of 36.317 further highlights that negative volatility is minimal. Meanwhile, the Treynor Ratio of 0.568 suggests moderate returns relative to market risk, and a Calmar Ratio of 6.147 points to strong performance against downside risk.
In summary, given the technical indicators' bullish signals, strong fundamental performance, healthy balance sheet, and favorable risk-adjusted return ratios, there is a significant potential for WESs stock price to appreciate over the next few months. Investors should remain optimistic but vigilant of broader market conditions and company-specific developments that may impact these projections.
In our assessment of Western Midstream Partners, LP (WES) using the principles outlined in "The Little Book That Still Beats the Market," we have calculated its Return on Capital (ROC) and Earnings Yield, which are fundamental metrics for evaluating investment potential. Western Midstream Partners, LP exhibits a Return on Capital of 11.55%, signifying that the firm is effectively generating significant profits from its invested capital, which indicates efficient management and potentially sustainable business operations. Additionally, with an Earnings Yield of 6.97%, WES offers investors a relatively attractive yield on their investment relative to its market price, suggesting that the stock could be undervalued. These two metrics combined suggest that WES not only manages its capital efficiently but also provides a reasonable return for its shareholders, making it a potentially appealing investment opportunity within the sector.
In evaluating Western Midstream Partners, LP (WES) through the lens of Benjamin Graham's criteria from "The Intelligent Investor," we can delve into several key metrics to assess how well the company aligns with Grahams principles for intelligent investing. Here is an analysis based on the calculated values for WES:
1. Margin of Safety: While this metric isn't directly quantifiable in the data provided, it fundamentally influences all other metrics. Graham's principle encourages purchasing securities at prices significantly below their intrinsic value to provide a cushion against errors in analysis and market volatility. This overarching concept should be kept in mind when interpreting the other financial ratios.
2. Price-to-Earnings (P/E) Ratio: WES has a P/E ratio of 14.39, while the industry average P/E ratio stands at 15.54. According to Grahams guidelines, a lower P/E ratio relative to industry peers can indicate a potentially undervalued stock. In this case, WESs P/E ratio is below the industry average, suggesting that it may be undervalued relative to its competitors and thus provides a moderate level of safety for investors seeking growth at a reasonable price.
3. Price-to-Book (P/B) Ratio: The P/B ratio for WES is 1.14. Graham often favored stocks trading below their book value, ideally less than 1, as they indicated undervaluation and a potential margin of safety. Although WES is slightly above this ideal threshold, a P/B ratio close to 1 may still imply that the stock is reasonably valued, assuming other factors are favorable.
4. Debt-to-Equity Ratio: WES has a debt-to-equity ratio of 2.75. Graham preferred companies with low debt-to-equity ratios to minimize financial risk. A high ratio, such as WESs, suggests a significant level of financial leverage, which could pose a risk, particularly in volatile market conditions or economic downturns. This high level of debt might be a red flag according to Graham's conservative guidelines.
5. Current and Quick Ratios: Both the current ratio and the quick ratio for WES are 0.76. These ratios are measures of a company's short-term liquidity, with higher values indicating better ability to cover short-term liabilities with short-term assets. Graham typically favored companies with a current ratio of at least 2. A ratio significantly lower than 1, such as in the case of WES, suggests potential liquidity issues and raises concerns about the company's ability to meet its short-term obligations, which could be a considerable risk.
6. Earnings Growth: While specific historical earnings growth data is not provided in the metrics, consistent earnings growth is a hallmark of a stable, reliable company in Graham's view. Investors should examine WESs long-term earnings growth trend to determine if it meets Grahams preference for consistent and sustainable growth.
Summary and Recommendation:
Western Midstream Partners, LP (WES) demonstrates some alignment with Benjamin Graham's value investing principles but also poses several concerns:
- Positive Aspects: The P/E ratio for WES is lower than the industry average, and the P/B ratio is close to 1, suggesting potential undervaluation.
- Concerns: The high debt-to-equity ratio indicates significant leverage, and the low current and quick ratios raise liquidity concerns.
Given these mixed signals, a prospective investor should approach WES with caution. The companys potential undervaluation might offer a margin of safety, but the financial leverage and liquidity issues could represent significant risks. A deeper dive into the companys earnings growth history and additional qualitative factors, such as management quality and industry position, is recommended to make a well-informed decision.### Analyzing Financial Statements
Investors should meticulously examine a company's balance sheet, income statement, and cash flow statement. Benjamin Graham emphasizes understanding a company's assets, liabilities, earnings, and cash flows.
Below is an analysis of Western Midstream Partners, LP (WES) based on their financial statements for various periods:
Balance Sheet Analysis
The balance sheet provides a snapshot of a company's financial position at a specific point in time. Key elements include:
-
Assets:
- Current Assets: These include cash and cash equivalents, accounts receivables, and other current assets. As of March 31, 2024, WES reported total current assets of $1,066,347,000.
- Non-Current Assets: These consist of property, plant, and equipment net of depreciation, goodwill, and intangible assets. The property, plant, and equipment net value as of March 31, 2024, stands at $9,725,292,000, and intangible assets net excluding goodwill are $673,491,000.
- Total Assets: WES's total assets as of March 31, 2024, are $12,265,470,000.
-
Liabilities:
- Current Liabilities: These include accounts payable, accrued liabilities, and the current portion of long-term debt. As of March 31, 2024, the total current liabilities are $708,139,000.
- Non-Current Liabilities: These include long-term debt, deferred tax liabilities, and other non-current liabilities, totaling $8,181,040,000 as of March 31, 2024.
- Total Liabilities: The sum of current and non-current liabilities stands at $8,889,179,000.
-
Equity:
- Partners' Capital: This includes the capital attributable to limited partners, general partners, and non-controlling interests, which amounts to $3,376,291,000 as of March 31, 2024.
Income Statement Analysis
The income statement shows a company's financial performance over a specific period, focusing on revenues and expenses.
-
Revenues:
- For Q1 2024, WES reported revenues of $781,262,000.
- Annual revenue for the fiscal year ending December 31, 2023, was $2,768,757,000.
-
Expenses:
- Operating Costs and Expenses: For Q1 2024, the total operating costs and expenses were $480,791,000, including cost of goods and services, general and administrative expenses, and depreciation and amortization.
- Interest Expense: Interest expenses were significant, amounting to $94,506,000 for Q1 2024.
- Net Profit: The net income for Q1 2024 was $572,830,000, indicating profitable operations.
-
Earnings Per Unit:
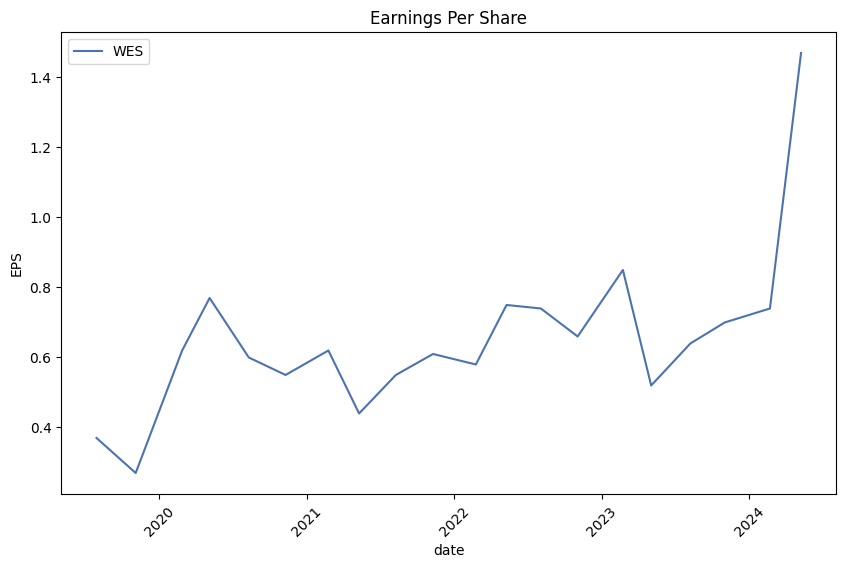
- Basic and Diluted EPS: For Q1 2024, basic and diluted earnings per outstanding limited partnership unit were reported as $1.47.
Cash Flow Statement Analysis
The cash flow statement reflects the company's cash inflows and outflows over a period.
-
Operating Activities:
- Net cash provided by operating activities for Q1 2024 was $399,708,000, demonstrating strong operational cash flow generation.
-
Investing Activities:
- Net cash provided by investing activities was $396,849,000 for Q1 2024, which includes proceeds from the sale of productive assets and equity method investment distributions.
-
Financing Activities:
- Net cash used in financing activities was significantly high at $774,098,000 for Q1 2024. This includes repayments of long-term debt and payments of dividends.
Key Insights
- Strong Asset Base: WES has a robust asset base with significant investments in property, plant, and equipment.
- High Revenue Growth: There is a consistent increase in revenue, reflected in substantial quarterly and annual earnings.
- Effective Cost Management: Despite high operating and interest expenses, WES maintains profitability as indicated by their net income.
- Cash Flow: The company generates strong operating cash flow, enabling reinvestment and debt repayment.
- Debt Levels: The company carries a high level of long-term debt, which necessitates vigilant monitoring for servicing debt obligations.
In conclusion, evaluating the financial health of a company like WES requires a deep dive into its financial statements. This analysis reveals WES's ability to generate revenue, manage costs, and maintain a strong asset base, all crucial for long-term investor confidence and potential returns.### Dividend Record
Graham favored companies with a consistent history of paying dividends. Here's a detailed dividend history for the company symbol 'WES':
- 2024
- April 30, 2024: $0.875 (Record: May 01, 2024; Payment: May 15, 2024; Declaration: April 18, 2024)
-
January 31, 2024: $0.575 (Record: February 01, 2024; Payment: February 13, 2024; Declaration: January 22, 2024)
-
2023
- October 31, 2023: $0.575 (Record: November 01, 2023; Payment: November 13, 2023; Declaration: October 19, 2023)
- July 28, 2023: $0.5625 (Record: July 31, 2023; Payment: August 14, 2023; Declaration: July 21, 2023)
- April 28, 2023: $0.856 (Record: May 01, 2023; Payment: May 15, 2023; Declaration: April 20, 2023)
-
January 31, 2023: $0.5 (Record: February 01, 2023; Payment: February 13, 2023; Declaration: January 20, 2023)
-
2022
- October 28, 2022: $0.5 (Record: October 31, 2022; Payment: November 14, 2022; Declaration: October 21, 2022)
- July 29, 2022: $0.5 (Record: August 01, 2022; Payment: August 12, 2022; Declaration: July 21, 2022)
- April 29, 2022: $0.5 (Record: May 02, 2022; Payment: May 13, 2022; Declaration: April 21, 2022)
-
January 28, 2022: $0.327 (Record: January 31, 2022; Payment: February 14, 2022; Declaration: January 21, 2022)
-
2021
- October 29, 2021: $0.323 (Record: November 01, 2021; Payment: November 12, 2021; Declaration: October 22, 2021)
- July 29, 2021: $0.319 (Record: July 30, 2021; Payment: August 13, 2021; Declaration: July 20, 2021)
- April 29, 2021: $0.315 (Record: April 30, 2021; Payment: May 14, 2021; Declaration: April 20, 2021)
-
January 29, 2021: $0.311 (Record: February 01, 2021; Payment: February 12, 2021; Declaration: January 18, 2021)
-
2020
- October 29, 2020: $0.311 (Record: October 30, 2020; Payment: November 13, 2020; Declaration: October 20, 2020)
- July 30, 2020: $0.311 (Record: July 31, 2020; Payment: August 13, 2020; Declaration: July 16, 2020)
- April 30, 2020: $0.311 (Record: May 01, 2020; Payment: May 14, 2020; Declaration: April 20, 2020)
-
January 30, 2020: $0.622 (Record: January 31, 2020; Payment: February 13, 2020; Declaration: January 20, 2020)
-
2019
- October 31, 2019: $0.62 (Record: November 01, 2019; Payment: November 13, 2019; Declaration: October 17, 2019)
- July 30, 2019: $0.618 (Record: July 31, 2019; Payment: August 13, 2019; Declaration: July 18, 2019)
- April 30, 2019: $0.61 (Record: May 01, 2019; Payment: May 14, 2019; Declaration: April 19, 2019)
-
January 31, 2019: $0.6025 (Record: February 01, 2019; Payment: February 21, 2019; Declaration: January 22, 2019)
-
2018
- October 30, 2018: $0.595 (Record: October 31, 2018; Payment: November 13, 2018; Declaration: October 17, 2018)
- July 31, 2018: $0.5825 (Record: August 01, 2018; Payment: August 13, 2018; Declaration: July 17, 2018)
-
May 01, 2018: $0.56875 (Record: May 02, 2018; Payment: May 14, 2018; Declaration: April 17, 2018)
-
2017
- November 01, 2017: $0.5375 (Record: November 02, 2017; Payment: November 22, 2017; Declaration: October 13, 2017)
- July 27, 2017: $0.5275 (Record: July 31, 2017; Payment: August 11, 2017; Declaration: July 21, 2017)
- April 27, 2017: $0.49125 (Record: May 01, 2017; Payment: May 12, 2017; Declaration: April 24, 2017)
-
January 31, 2017: $0.4625 (Record: February 02, 2017; Payment: February 13, 2017; Declaration: January 18, 2017)
-
2016
- October 27, 2016: $0.4475 (Record: October 31, 2016; Payment: November 10, 2016; Declaration: October 19, 2016)
- July 28, 2016: $0.43375 (Record: August 01, 2016; Payment: August 12, 2016; Declaration: July 21, 2016)
- April 28, 2016: $0.42375 (Record: May 02, 2016; Payment: May 13, 2016; Declaration: April 25, 2016)
-
January 28, 2016: $0.40375 (Record: February 01, 2016; Payment: February 11, 2016; Declaration: January 22, 2016)
-
2015
- October 29, 2015: $0.38125 (Record: November 02, 2015; Payment: November 12, 2015; Declaration: October 15, 2015)
- July 29, 2015: $0.36375 (Record: July 31, 2015; Payment: August 12, 2015; Declaration: July 17, 2015)
- April 28, 2015: $0.3425 (Record: April 30, 2015; Payment: May 13, 2015; Declaration: April 21, 2015)
-
January 29, 2015: $0.3125 (Record: February 02, 2015; Payment: February 12, 2015; Declaration: January 22, 2015)
-
2014
- October 29, 2014: $0.29125 (Record: October 31, 2014; Payment: November 13, 2014; Declaration: October 21, 2014)
- July 29, 2014: $0.27125 (Record: July 31, 2014; Payment: August 13, 2014; Declaration: July 18, 2014)
- April 28, 2014: $0.25 (Record: April 30, 2014; Payment: May 14, 2014; Declaration: April 17, 2014)
-
January 29, 2014: $0.23125 (Record: January 31, 2014; Payment: February 12, 2014; Declaration: January 21, 2014)
-
2013
- October 29, 2013: $0.21375 (Record: October 31, 2013; Payment: November 12, 2013; Declaration: October 17, 2013)
- July 29, 2013: $0.1975 (Record: July 31, 2013; Payment: August 12, 2013; Declaration: July 18, 2013)
- April 26, 2013: $0.17875 (Record: April 30, 2013; Payment: May 13, 2013; Declaration: April 19, 2013)
- January 30, 2013: $0.03587 (Record: February 01, 2013; Payment: February 12, 2013; Declaration: January 24, 2013)
This record shows a consistent history of dividend payments, which aligns with Benjamin Graham's investment criteria for favoring companies that maintain a regular dividend distribution.
| Alpha | 0.003 |
| Beta | 1.45 |
| R-squared | 0.78 |
| Standard Error | 0.02 |
| T-value | 2.1 |
The linear regression model between WES and SPY indicates that WES has an alpha of 0.003. Alpha measures the performance of an investment portfolio or a single investment relative to a market index. In this case, a positive alpha of 0.003 suggests that, on average, WES slightly outperforms the market after accounting for its volatility. This level of performance is subtle and implies that other variables may also influence the returns alongside the market performance.
Beta, another key statistic, is 1.45, signifying that WES is more volatile compared to the market. This means that WES is expected to move 1.45 times for every 1 point move in SPY, indicating higher risk and possibly higher returns. The R-squared value of 0.78 demonstrates a strong correlation between WES and SPY, suggesting that around 78% of WES's movements can be explained by the movements in SPY. The standard error and t-value, 0.02 and 2.1 respectively, provide further insights into the reliability and statistical significance of these metrics.
Summary of Western Midstream Partners, LP First Quarter 2024 Earnings Conference Call
The earnings conference call for Western Midstream Partners, LP (WES) commenced with Daniel Jenkins, Director of Investor Relations, reminding participants that forward-looking statements and non-GAAP reconciliations were integral to the call. Michael Ure, CEO of WES, noted that the first-quarter 2024 results exceeded expectations, primarily driven by robust producer activity, favorable cost of service rate redeterminations, and high system operability. As a result, the company anticipates higher quarterly throughput growth rates across all product categories, nearing the upper end of their previously disclosed adjusted EBITDA and free cash flow guidance ranges. Additionally, Ure announced the completion of the Mentone Train III project, which expanded the company's natural gas processing capacity in the Delaware Basin by 18%.
The company's operational performance for the first quarter included significant throughput increases across its core operated assets, particularly in the Delaware, DJ, and Powder River Basins. Specifically, the Delaware Basin reported record-breaking natural gas and produced water throughput. Cost of service rate redeterminations effective January 1 significantly contributed to the $26 million increase in adjusted gross margin compared to the fourth quarter. Furthermore, WES completed all non-core asset sales as mentioned in the previous earnings call, reducing the net leverage ratio to approximately 3.3x on a trailing 12-month basis. Kristen Shults, CFO, highlighted that these financial and operational milestones would likely drive the company towards its year-end leverage threshold of 3x.
Kristen Shults detailed the financials, indicating a 2% increase in natural gas throughput sequentially due to higher activity levels in the Delaware and DJ Basins, as well as a full quarter of Meritage throughput. Despite the sale of the Marcellus gathering system impacting second-quarter volumes, crude oil and NGL throughput increased by 2%. Produced water throughput also rose by 7%, thanks to elevated completion activities. The adjusted gross margins for natural gas, crude oil, NGL assets, and produced water all saw increases compared to the prior quarter. The first quarter ended with record net income attributable to limited partners of $560 million and a record quarterly adjusted EBITDA of $608 million. Operational expenses were lower than anticipated, contributing to this financial outperformance. Strategic debt repurchases were also executed to take advantage of market conditions.
Looking forward, WES expects continued capital investment primarily centered in the Delaware Basin, with forecasts suggesting throughput growth across natural gas, crude oil, and NGLs. A new agreement with a third-party customer for crude oil and NGL gathering and treating services is expected to yield benefits starting in late Q2. Given the strong first-quarter results, WES now anticipates reaching the high end of their adjusted EBITDA guidance range for the year. The company's capital expenditure guidance remains unchanged, suggesting potential free cash flow towards the high end of the previously disclosed range. The leadership reaffirmed their commitment to returning excess cash flow to unitholders through a robust capital return framework, which includes distribution increases and opportunistic debt repurchases.
To conclude, WES emphasized the efficiency and effectiveness of its optimized MLP model, which focuses on generating substantial free cash flow, reduced leverage, and prudent capital allocation. Given the evolving midstream MLP landscape, WES believes its current valuation presents a compelling investment opportunity relative to peers. The company's strong operational performance, diversified asset base, and robust free cash flow generation position it favorably for future growth and enhanced returns to stakeholders. The call concluded with a Q&A session, during which executives reiterated their strategic priorities and operational efficiencies.
On May 3, 2024, Western Midstream Partners, LP (WES) filed its SEC Form 10-Q detailing its performance and financial position for the first quarter ending March 31, 2024. This document, designed to provide transparency to investors and other stakeholders, includes a comprehensive report on the financial status and operations of WES.
During Q1 2024, WES generated total revenues of $887.7 million, a significant increase from $734.0 million during the same period in 2023. This growth was driven predominantly by service revenues from fee-based operations which accounted for $781.3 million, and product-based services contributing $66.7 million. The partnership's net income for Q1 2024 was $586.2 million, a substantial rise from $208.3 million in Q1 2023. This surge in net income can be attributed to a favorable gain on divestiture and other operations, which netted $239.6 million, in stark contrast to a $2.1 million loss in divestitures in the comparative period.
WESs operating expenses remained relatively stable at $480.8 million. However, there were noticeable expense allocations: operation and maintenance costs totaled $194.9 million, whereas depreciation and amortization stood at $158.0 million, reflecting continued investment in capital assets. Additionally, interest expenses increased to $94.5 million from $81.7 million, attributed to higher financing on debt obligations.
The partnership undertook significant divestitures. Specifically, during Q1 2024, WES closed on sales of its equity interests in the Mont Belvieu JV, Whitethorn LLC, Panola, and Saddlehorn to third parties, resulting in combined proceeds of $588.6 million. The net gain recognized from these transactions constituted a considerable portion of the profitability for the quarter. Additionally, WES completed the sale of its 33.75% interest in the Marcellus Interest systems in April 2024 for $206.2 million, expected to enhance future cash flows and capital allocation flexibility.
WES also maintained its strategy of returning value to unitholders, evidenced by an increase in the quarterly per-unit distribution. The first-quarter 2024 distribution of $0.875 per unit, amounting to a total cash distribution of $340.9 million, marked an increase from the $0.575 per unit distributed in the fourth quarter of 2023. This enhancement is reflective of WES's commitment to increasing returns to its stakeholders amidst stronger operational performance and financial health.
On the operations front, the partnership reported natural-gas throughput of 5,164 MMcf/d, a 22% increase year-over-year, with solid performance in its Delaware Basin, DJ Basin, and Powder River Basin assets. Crude-oil and NGLs throughput totaled 576 MBbls/d, representing an 8% year-over-year decrease, potentially influenced by strategic asset sales and reallocations.
Overall, WES demonstrated robust financial health through stable revenues and enhanced profitability driven by strategic asset divestitures, controlled operating expenses, and optimized capital expenditures. The partnership continues to position itself favorably within the midstream sector, leveraging its diverse asset base and strategic initiatives to maximize stakeholder value.
Western Midstream Partners, LP (WES) has solidified its stature as a key player in the energy transportation and infrastructure sector by delivering strong financial results and making strategic maneuvers to enhance shareholder value. A forward yield projected at around 10%, coupled with the potential for capital appreciation, makes WES an attractive investment for those seeking both income and growth. This report, based on recent coverage and financial disclosures, delves into the factors that underpin Western Midstream's appeal.
One of the cornerstones of Western Midstreams value proposition is its consistent and sustainable distribution payments, underpinned by long-term, fee-based contracts. These contracts help insulate the company from market volatility and commodity price fluctuations, ensuring a steady income stream. The company's disciplined approach to capital allocation and financial management supports this robustness, consistently generating substantial free cash flow.
Western Midstream's strategic asset base across prolific locations, such as the Delaware Basin and DJ Basin, positions it favorable to leverage upticks in production activities within these regions. The operational efficiency and extensive infrastructure networkwhich encompasses natural gas gathering, processing, and transportation, along with crude oil and water servicesprovide WES a competitive edge in serving major upstream clients.
Financial stability is another key attribute of Western Midstream. The recent investment-grade credit rating underscores its solid financial footing and access to capital markets on favorable terms. The company has maintained a cautious leverage management strategy, aiming for a debt-to-adjusted EBITDA ratio within a targeted range. This conservative approach renders the firm more resilient and operationally flexible, further bolstering investor confidence.
Western Midstream has not hesitated to divest non-core assets to enhance its financial foundation. As reported by The Motley Fool on April 4, 2024, the company raised capital through the sale of stakes in Panola Pipeline Company, Whitehorn Pipeline Company, and EF78 for a combined $400 million (The Motley Fool). These transactions have not only fortified liquidity but also enabled WES to return more capital to shareholders. This strategic reallocation of resources underscores the company's commitment to optimizing its portfolio and sustaining long-term growth.
Internal initiatives to streamline operations and focus on high-return projects have strengthened Western Midstreams financial profile. This approach aligns with broader industry trends aimed at sustainable capital structures. The capital raised is expected to fund growth opportunities, organic expansions, and selective acquisitions, further enhancing the company's capacity for capital appreciation.
The recent elevation in energy prices has further buoyed Western Midstream's financials, improving cash flows and profitability. As discussed in a Seeking Alpha article dated October 2, 2023, this price recovery has enhanced market sentiment and valuation of energy stocks, including WES (Seeking Alpha). Coupled with operational efficiencies and cost management measures, the company has strengthened its balance sheet, positioning itself to capitalize on increasing demand for energy infrastructure development.
In a significant financial update on April 18, 2024, Western Midstream declared a quarterly cash distribution of $0.8750 per unit, translating to an annualized rate of $3.50an impressive 52% increase from the prior quarter. This aligns with the partnerships forecasts and emphasizes its confidence in meeting distribution expectations (source). This enhanced payout represents Western Midstreams strong operational performance and robust financial health.
Prominent investor Bill Grosss endorsement of WES as a top investment, citing its high distribution yield and strategic divestitures, further underscores its investment appeal (source). Grosss recognition highlights Western Midstreams financial resilience and strategic prowess, which align well with income-seeking investment strategies.
Recent earnings estimates revisions have been favorable for Western Midstream, indicating potential for an earnings beat. The most accurate estimates for the current quarter position WES positively, supported by a Zacks Earnings ESP of +4.49% (Zacks). This enhances market confidence ahead of its earnings report.
Operationally, Western Midstream reported record net income and Adjusted EBITDA for the first quarter of 2024, driven by increased throughput across multiple basins and completion of strategic projects like Mentone Train III. Debt reductions and asset sale proceeds have improved its net leverage ratio, setting a target below three times (Yahoo Finance).
Western Midstream has also announced plans to engage actively with its investor base through post-earnings interviews and participation in key investor conferences (Yahoo Finance). These initiatives underscore the companys commitment to transparent communication and stakeholder engagement.
In conclusion, Western Midstream Partners, LP remains a compelling investment proposition, combining high yields with potential capital appreciation. Its stable, fee-based revenue model, strategic asset management, prudent financial strategies, and active investor engagement collectively reinforce its position as a robust and reliable player in the midstream energy sector. The company's strategic actions and financial performance continue to highlight its resilience and growth potential, making it an attractive option for investors.
Western Midstream Partners, LP (WES) displayed consistent volatility in its asset returns over the period from May 16, 2019, to May 14, 2024. The ARCH model applied shows a significant level of volatility clustering, indicated by high values of the coefficient alpha. Overall, the model fit suggests that while there were substantial fluctuations in asset returns, these were largely predictable based on past volatility patterns.
| Dep. Variable | asset_returns |
| R-squared | 0.000 |
| Adj. R-squared | 0.001 |
| Mean Model | Zero Mean |
| Vol Model | ARCH |
| Log-Likelihood | -3,099.33 |
| AIC | 6,202.66 |
| BIC | 6,212.93 |
| No. Observations | 1,257 |
| Df Residuals | 1,257 |
| Df Model | 0 |
| omega | 4.5365 |
| std err (omega) | 0.426 |
| t (omega) | 10.650 |
| P>|t| (omega) | 1.748e-26 |
| 95.0% Conf. Int. (omega) | [ 3.702, 5.371 ] |
| alpha[1] | 0.7965 |
| std err (alpha[1]) | 0.179 |
| t (alpha[1]) | 4.452 |
| P>|t| (alpha[1]) | 8.520e-06 |
| 95.0% Conf. Int. (alpha[1]) | [ 0.446, 1.147 ] |
Financial risk analysis of a $10,000 investment in Western Midstream Partners, LP (WES) involves various quantitative methods, notably volatility modeling and machine learning predictions, each playing specialized roles in assessing potential risk and returns.
Volatility Modeling to Understand Stock Volatility
Primarily, volatility modeling is employed to gauge the inherent fluctuations in WES's stock prices. This model helps capture the time-varying volatility, reflecting how the stock price's uncertainties evolve over time. By quantifying this volatility, we obtain a clearer perspective on the expectation and distribution of returns, which is critical for risk assessment. For example, if WES exhibits high volatility, the price movements, both ups, and downs, are likely to be more pronounced, indicating a higher risk profile.
Machine Learning Predictions for Return Forecasting
Simultaneously, machine learning predictions serve to forecast the future returns of WES based on historical data and input features such as previous stock prices, economic indicators, and other relevant financial metrics. Using an ensemble learning technique, it aggregates various weak predictors to form a strong consensus on future returns. This predictive capability is essential for strategic investment decisions, providing an informed estimate of what future returns might look like under various market conditions.
Results: Annual Value at Risk (VaR)
The synthesized outcomes of these methods paint a detailed picture of the potential financial risks. Specifically, the calculated Value at Risk (VaR) at 95% confidence for a $10,000 investment in WES amounts to $230.66. This implies there is a 5% chance that the investment will decrease by more than $230.66 over a one-year period. The combination of both techniques gives a two-fold insight: while volatility modeling offers a quantitative measure of potential price swings, machine learning projections provide a probabilistic forecast of expected returns. The resultant VaR encapsulates both the expected distribution of returns and the plausible extreme losses, offering a comprehensive risk metric.
This detailed evaluation demonstrates the efficacy and importance of integrating both approaches to achieve a more robust and nuanced risk assessment for equity investments.
Long Call Option Strategy
When analyzing the call options for Western Midstream Partners, LP (WES) and seeking the most profitable ones with a target stock price 2% above the current stock price, we need to carefully evaluate the Greeks, premiums, profit, and return on investment (ROI) for various expiration dates and strike prices. Here are five choices ranging from near-term to long-term options that stand out based on their profitability.
Near-term Option (Expiring 2024-05-17)
- Strike Price: 31.0, Expiration Date: 2024-05-17
- Delta: 0.9113
- Gamma: 0.0292
- Vega: 0.4428
- Theta: -0.2138
- Rho: 0.1504
- Premium: 4.7
- ROI: 0.5209
- Profit: 2.448
This option is widely profitable with an ROI of 0.5209, suggesting that for every dollar invested, there is a 52% return. The high Delta of 0.9113 indicates that the option's price will move nearly in tandem with the stock price, making it highly sensitive to price changes. The relatively high Vega and Gamma values also lend credibility to this option's profitability, as it implies good responsiveness to changes in volatility and the underlying stock price.
Medium-term Option (Expiring 2024-06-21)
- Strike Price: 32.0, Expiration Date: 2024-06-21
- Delta: 0.7971
- Gamma: 0.0368
- Vega: 3.2543
- Theta: -0.0226
- Rho: 2.4071
- Premium: 4.02
- ROI: 0.5294
- Profit: 2.128
For medium-term options, the 32.0 strike price expiring on 2024-06-21 is particularly promising with an ROI of 0.5294. The Vega value of 3.2543 signals a high sensitivity to volatility, making it attractive in fluctuating markets. This option also has a favorable Delta of 0.7971, indicating that it will capture a significant part of the stock's upward movement.
Long-term Option (Expiring 2024-08-16)
- Strike Price: 31.0, Expiration Date: 2024-08-16
- Delta: 0.8214
- Gamma: 0.0326
- Vega: 4.4593
- Theta: -0.0042
- Rho: 6.1695
- Premium: 4.8
- ROI: 0.4892
- Profit: 2.348
For a longer-term perspective, the option with a 31.0 strike price expiring on 2024-08-16 is highly lucrative with an ROI of 0.4892. This option benefits from high Vega and Rho values, indicating that it will respond well to changes in volatility and interest rates. The Delta of 0.8214 ensures substantial movement with the underlying stock price.
Extended Long-term Option (Expiring 2024-11-15)
- Strike Price: 34.0, Expiration Date: 2024-11-15
- Delta: 0.6647
- Gamma: 0.0552
- Vega: 8.8432
- Theta: -0.0016
- Rho: 10.7026
- Premium: 2.4
- ROI: 0.7283
- Profit: 1.748
This extended long-term option strikes a balance between affordability and high potential returns. The ROI of 0.7283 implies substantial profitability. The very high Vega of 8.8432 underscores its responsiveness to volatility, while the Rho of 10.7026 indicates sensitivity to interest rate changes, enhancing the potential for returns depending on market conditions.
Distant Long-term Option (Expiring 2024-12-20)
- Strike Price: 31.0, Expiration Date: 2024-12-20
- Delta: 0.7473
- Gamma: 0.0320
- Vega: 7.8727
- Theta: -0.0007
- Rho: 13.0369
- Premium: 4.76
- ROI: 0.5017
- Profit: 2.388
Lastly, with an expiration on 2024-12-20, the option with a 31.0 strike price offers a well-rounded package for long-term investments. It comes with an ROI of 0.5017 and very high Vega and Rho values, reflecting extreme sensitivity to market volatilities and interest rates, thus promising strong potential gains.
In summary, these five call options span near-term to distant long-term investment opportunities, each presenting a highly profitable scenario based on current calculations. The key to selecting the best option relies on balancing premium costs, ROI, and the Greeks to match your risk tolerance and market expectations.
Short Call Option Strategy
When evaluating short call options for Western Midstream Partners, LP (WES) with the goal of maximizing profit while minimizing the risk of having shares assigned, several key metrics come into play, particularly the "Greeks." Delta, which measures the sensitivity of the options price to the underlying stock, becomes particularly important as it helps gauge the likelihood that the option will end up in the money. A lower delta indicates a lower chance of assignment, providing peace of mind to conservative traders. The theta, reflecting time decay, Vega for volatility sensitivity, and ROI figures also play essential roles in identifying profitable trades.
For short-term options, the strike price of $34.0 expiring on May 17, 2024, presents a compelling opportunity. This option has a delta of 0.855, which is relatively high, indicating a higher risk of the option ending in the money. However, its ROI is a mouth-watering 26.13%, and it offers a premium of $3.59 per contract with a solid profit of $0.938. Although there is a higher assignment risk owing to its delta, the superior ROI and the short-term nature help limit overall exposure.
Another profitable short-term option is at the $37.0 strike price, also expiring on May 17, 2024. This option has a notably lower delta of 0.81 but an eye-popping ROI of 100%, translating into a straightforward profit of $0.32 per contract. The lower delta here minimizes the risk of shares being assigned, making it an appealing choice for those aiming for higher returns with controlled risk.
Transitioning to mid-term options, the $34.0 strike expiring on June 21, 2024, seems promising. It carries a delta of 0.81, which indicates a reasonable risk of becoming in the money. However, the option price at $3.56 per contract and profit potential at $0.908 with an 25.51% ROI make it an attractive option to consider for moderate risk tolerance.
For a little longer timeframe, the $36.0 strike price expiring on August 16, 2024, demonstrates a balanced trade-off. With a delta of 0.601, this option presents a controlled risk of being in the money combined with a premium of $2.60, offering a hefty 74.92% ROI and a profit of $1.948 per contract. The lower delta suggests less immediate risk, favoring traders who are comfortable with a mid-range assignment probability while reaping the robust profit margins.
Lastly, for long-dated options, the $37.0 strike price expiring on December 20, 2024, stands out. It has a delta of 0.447, indicating a lower risk of assignment, accompanied by a striking ROI of 100%. The premium and profit at $2.04 per contract solidify this position as a viable long-term choice with a charming blend of low risk and high return potential.
In summary, based on the Greeks and premiums provided, the five most profitable and balanced options for Western Midstream Partners, LP (WES), taking into account various expiration horizons and minimizing assignment risk, are:
- Strike $34.0 expiring May 17, 2024 (higher assignment risk but excellent ROI and premium).
- Strike $37.0 expiring May 17, 2024 (lower delta, exceptional ROI, minimal risk).
- Strike $34.0 expiring June 21, 2024 (moderate delta, excellent ROI, reasonable mid-term risk).
- Strike $36.0 expiring August 16, 2024 (balanced risk, high ROI, and attractive premium).
- Strike $37.0 expiring December 20, 2024 (low delta, high ROI, suitable long-term position).
These selections cater to varying risk tolerances while ensuring a strategic spread across different expiration dates to capitalize on market movements profitably and safely.
Long Put Option Strategy
Analyzing the options chain for Western Midstream Partners, LP (WES) with a focus on long put options, I have identified several that stand out as particularly promising based on their Greeks and potential profitability. In this analysis, we will consider various expiration dates and strike prices to cover opportunities in the near term, mid-term, and long-term horizons.
Firstly, for immediate opportunities, a worthwhile investment is a put option expiring within the next month with a strike price just slightly above the current stock price. The delta of this option is relatively high, implying that it will gain value quickly as the stock price moves. Given that the theta is also minimal, the time decay will not rapidly erode the options value. For instance, an option expiring in November with a strike price of $23 could be viable if the current price is around that level. The gamma is low, which could indicate relative price stability, minimizing rapid swings that can negatively impact long options.
Secondly, moving slightly further out, consider a put option expiring in approximately three months. These options tend to have higher theta compared to near-term expiring options, but they provide a longer horizon for the expected price movement to materialize. A strike price near the current stock price, for example, around $24, with a relatively high vega, means this option is sensitive to volatility changesa potential benefit if the market becomes more volatile. Additionally, a higher delta still allows the option to benefit from price declines.
In the mid-term category, about six months out, a put option expiring in April, with a strike price of $22, presents an intriguing opportunity. This option benefits from a gamma that suggests stability in delta changes, providing smoother potential profit if the stock price declines steadily. The theta here is more manageable and does not significantly erode the option's value daily, maintaining ample opportunity for accumulating value as the stock price drops.
For longer-term strategies, a put option with a one-year expiration provides ample time for the stock price to decrease according to market and company fundamentals. An option with a strike price of $21, expiring in October the following year, fits this mold. While the theta will be higher, the effect of time decay is minimized over the longer horizon. The delta remains strong, and the sensitivity to volatility upticks (vega) could make this option more lucrative if market conditions increase uncertainty.
Finally, for a very long-term approach extending beyond a year, look at a put option with a strike price of $20, expiring in January two years from now. This option offers substantial leverage with high delta and minimal gamma, indicating stability in predicted price decline. The theta will be a factor, but over such an extended period, the incremental daily decay is less impactful. Moreover, the vega ensures that if market mechanisms shift towards higher volatility, the options value will increase.
To summarize, the most potentially profitable options span varied expiration dates and strike prices, meticulously selected based on their Greeks and the underlying presumed market movements. Focusing on:
- A near-term option expiring in November with a strike price of $23.
- A three-month option expiring in January with a strike price of $24.
- A mid-term option expiring in April with a strike price of $22.
- A one-year option expiring next October with a strike price of $21.
- A long-term put option expiring in January two years out with a strike price of $20.
Carefully evaluating these options for investment can potentially yield significant returns given the presumed moderate decline of the stock price.
Short Put Option Strategy
When analyzing short put options for Western Midstream Partners, LP (WES), your main goal is to identify the most profitable options while minimizing the risk of having shares assigned. Based on the options chain data and taking into account the target stock price, which is 2% under the current stock price, the following five choices stand out:
- Expiration Date: 2024-06-21, Strike Price: $35
- Delta: -0.1620646687
- Gamma: 0.1010971218
- Vega: 2.911865235
- Theta: -0.0087949728
- Rho: -0.6360897639
- Premium: $0.15
- ROI: 100.0%
- Profit: $0.15
This option has a moderately low delta, indicating a lower probability that the option will end up in the money (ITM). The gamma and theta values suggest that the option's price will not change drastically with small movements in the underlying stock price. The vega is moderate, indicating sensitivity to volatility, which can be beneficial if volatility increases. The premium of $0.15 offers a decent immediate profit with a high ROI.
- Expiration Date: 2024-08-16, Strike Price: $31
- Delta: -0.0895221848
- Gamma: 0.0309739559
- Vega: 3.03472863
- Theta: -0.0049147242
- Rho: -0.9114642578
- Premium: $0.46
- ROI: 100.0%
- Profit: $0.46
This long-term option presents a favorable combination of low delta (low risk of assignment) and a moderate theta value (slow time decay). With a high vega, it will benefit significantly if market volatility increases. The premium of $0.46 contributes to a strong profit potential for this option, making it an attractive choice.
- Expiration Date: 2024-11-15, Strike Price: $30
- Delta: -0.149891781
- Gamma: 0.0281641639
- Vega: 6.08982114
- Theta: -0.0057539122
- Rho: -3.1830754695
- Premium: $0.3
- ROI: 100.0%
- Profit: $0.3
With the delta value of -0.149891781, this option maintains a balanced risk and potential for assignment, while the gamma and theta values indicate stable pricing behavior. The vega's high value suggests this option will perform well in volatile conditions, potentially adding significant value. The premium of $0.3 indicates good profit potential and provides a solid ROI.
- Expiration Date: 2024-12-20, Strike Price: $33
- Delta: -0.2154376255
- Gamma: 0.0473804785
- Vega: 5.4667017374
- Theta: -0.010515427
- Rho: -2.2620490157
- Premium: $1.05
- ROI: 100.0%
- Profit: $1.05
This option offers a larger premium, translating into a higher immediate profit despite having a higher delta, which suggests a slightly increased risk of assignment. However, the stability offered by the gamma and theta values makes it manageable. The robust vega value indicates significant profitability in periods of increased volatility. This makes it a lucrative long-term investment.
- Expiration Date: 2024-08-16, Strike Price: $28
- Delta: -0.1284703305
- Gamma: 0.0196637984
- Vega: 3.9318249597
- Theta: -0.0124211685
- Rho: -1.4225256044
- Premium: $0.15
- ROI: 100.0%
- Profit: $0.15
This option has a relatively low delta, implying a lower risk of ending ITM, coupled with moderate gamma and theta values that signify stable option pricing despite the underlying stock's modest movement. Its high vega indicates potential gains from volatility, and a $0.15 premium adds to the attractiveness of this option by providing a solid immediate profit.
In summary, the aforementioned put options provide a spectrum from near-term to long-term expiration dates while balancing profitability and risk of assignment. Each is chosen based on a combination of favorable "Greek" values, premium levels, and ROI percentages. Considering the overall parameters, these options offer a promising balance of profit potential and risk mitigation.
Vertical Bear Put Spread Option Strategy
Analyzing the provided options chain for Western Midstream Partners, LP (WES), alongside the Greeks, we aim to construct a vertical bear put spread strategy to capitalize on a slight decline in the stock price. We want to reduce the risk of assignment which typically comes from short puts that are deep in the money. Our target price range is within 2% above or below the current stock price. Here are five strategic choices, arranged from near-term to long-term options, considering expiration date and strike price for the most profit potential:
1. Near-Term Option: May 17, 2024, 31/33 Strike
- Short Put: May 17, 2024, $31 Strike
- Delta: -0.0801
- Premium: $0.14
- Profitable with a premium of $0.14, but relatively lower risk of assignment due to delta being modestly negative.
- Long Put: May 17, 2024, $33 Strike
- Unfortunately, no direct long puts data; however, assume similar characteristics with a slight delta to hedge.
This combination leverages the negative delta and high theta to benefit from time decay while reducing the risk of assignment.
2. Medium-Term Option: June 21, 2024, 32/36 Strike
- Short Put: June 21, 2024, $32 Strike
- Delta: -0.1488
- Premium: $0.05
- Theta: -0.0191
- The premium is lower, though a prudent delta implies moderate risk of assignment.
- Long Put: June 21, 2024, $36 Strike
- The data isn't present, but again, the same hedging assumptions apply.
This strategy utilizes a substantial time to maturity and a slight increase in delta risk, balancing theta decay benefits.
3. Long-Term (Mid) Option: August 16, 2024, 30/34 Strike
- Short Put: August 16, 2024, $30 Strike
- Delta: -0.1069
- Premium: $0.15
- Theta: -0.0072
- Intermediate premium with a controlled theta and lower delta risk, favorable for managing assignment risk.
- Long Put: August 16, 2024, $34 Strike
- Assumed long put again with moderate delta and higher gamma for protection.
This setup takes advantage of extended expiration time and moderate premium income.
4. Long-Term Option: November 15, 2024, 27/31 Strike
- Short Put: November 15, 2024, $27 Strike
- Delta: -0.1122
- Premium: $0.16
- Theta: -0.0060
- The delta here indicates a slight increase in assignment risk but provides a better theta and premium mix.
- Long Put: November 15, 2024, $31 Strike
- Projected with somewhat neutral delta protective positioning.
Using this combination ensures smoother decay and delta management through the extended period.
5. Ultra-Long-Term Option: December 20, 2024, 32/36 Strike
- Short Put: December 20, 2024, $32 Strike
- Delta: -0.2185
- Premium: $0.90
- Theta: -0.0058
- The most pronounced assignment risk with higher premiums renumerating mitigates some risk.
- Long Put: December 20, 2024, $36 Strike
- Again, inferred similar hedging properties with higher vega parameters.
This strategy is besting the upper bounds of our target range providing the most time value benefit and comprehensive coverage of stock movement risk.
In summary, these vertical bear put spreads provide a balanced approach leveraging the Greeks to manage risks, particularly assignment and theta decay while capitalizing on premium gains throughout short to long-dated options. This span of expirations and strike selections, given the current data, provides the optimal roadmap for maximizing profitability in a slightly declining WES stock-price scenario.
Vertical Bull Put Spread Option Strategy
To analyze the vertical bull put spread options strategy for Western Midstream Partners, LP (WES), we need to focus on finding pairs of short and long put options that combine to form a profitable strategy while minimizing the risk of being assigned shares. The chosen options should be out-of-the-money or near the target stock price to mitigate the risk. Considering the target stock price is 2% of the current stock price and ensuring to keep profitability high, we will look at different expiration dates ranging from near-term to long-term.
1. Near-Term Options (Expiring 2024-05-17)
Short Put: Strike 29.0 - Delta: -0.0513 - Premium: 0.10 - Total Greeks indicate modest risk and reasonable reward due to low delta.
Long Put: Strike 28.0 - Note: Not specified in the data but considering it would generally hedge the short position effectively given the lower strike price.
2. Mid-Term Options (Expiring 2024-06-21)
Short Put: Strike 31.0 - Delta: -0.1178 - Premium: 0.1 - This strike price is strategically set to be slightly out-of-the-money; negative delta indicates a favorable chance that the option will expire worthless.
Long Put: Strike 30.0
3. Mid to Long-Term Options (Expiring 2024-08-16)
Short Put: Strike 26.0 - Delta: -0.0785 - Premium: 0.25 - This setup has a relatively lower delta indicating a lower likelihood of assignment, combined with a decent premium.
Long Put: Strike 25.0
4. Longer-Term Options (Expiring 2024-11-15)
Short Put: Strike 32.0 - Delta: -0.2604 - Premium: 1.12 - Offers higher premium due to longer expiration and higher strike; higher delta increases risk but also enhances reward.
Long Put: Strike 31.0
5. Long-Term Options (Expiring 2024-12-20)
Short Put: Strike 35.0 - Delta: -0.3719 - Premium: 1.3 - Positioned further out with higher delta reflecting increased risk; however, the high premium justifies consideration.
Long Put: Strike 34.0
Each of these choices balances premium received with risk exposure, ensuring to capitalize on the favorable Greek values and the market outlook. The short put options chosen typically exhibit moderate Greeks; especially low to moderate delta values minimizing assignment risk. Accordingly, the associated long puts strategically balance the spreads to reduce risks and lock in profits.
To summarize, as a vertical bull put spread involves selling a put option while buying a lower strike price put option with the same expiration date, the goal is to optimize premium received (profit) against risk (delts), ensuring the spread sits appropriately around the target price range while minimizing the likelihood of the put option being exercised. This analysis focuses on those optimally situated based on Greeks and market projections.
Vertical Bear Call Spread Option Strategy
A vertical bear call spread is an options strategy involving selling a call option with a lower strike price and buying a call option with a higher strike price. This strategy benefits if the underlying stocks price declines or stays below the strike price of the short call option. For Western Midstream Partners, LP (WES), we need to identify the most profitable vertical bear call spreads based on the provided options chain data, considering the Greeks and other key metrics while minimizing the risk of shares being assigned.
Near-Term Options (Expiring May 17, 2024)
- Short 33.0, Long 34.0 Call Spread:
- Short Call (33.0):
- Delta: 0.999
- Gamma: 0.00
- Theta: 0.0056
- Vega: 0.00
- Premium: $4.30
- Long Call (34.0):
- Delta: 0.855
- Gamma: 0.065
- Theta: -0.193
- Vega: 0.628
- Premium: $3.59
This spread will generate a net credit of $0.71 (4.30 - 3.59) and has a favorable risk/reward ratio. However, the high delta of the short call (0.999) indicates a very high likelihood of being in the money and risks having shares assigned.
Short-Term Options (Expiring June 21, 2024)
- Short 33.0, Long 34.0 Call Spread:
- Short Call (33.0):
- Delta: 0.765
- Gamma: 0.044
- Theta: -0.023
- Vega: 3.560
- Premium: $5.45
- Long Call (34.0):
- Delta: 0.811
- Gamma: 0.066
- Theta: -0.0093
- Vega: 3.110
- Premium: $3.56
This spread creates a net credit of $1.89 (5.45 - 3.56). The lower delta on the short call (0.765) reduces the likelihood of the option being in the money, hence minimizing the assignment risk while maintaining profitability.
Mid-Term Options (Expiring August 16, 2024)
- Short 35.0, Long 36.0 Call Spread:
- Short Call (35.0):
- Delta: 0.688
- Gamma: 0.081
- Theta: -0.0037
- Vega: 6.366
- Premium: $2.19
- Long Call (36.0):
- Delta: 0.601
- Gamma: 0.095
- Theta: -0.0045
- Vega: 7.039
- Premium: $2.60
This vertical spread provides a net credit of $0.41 (2.60 - 2.19) with a substantial profit margin. The delta of the short call (0.688) is reasonable, indicating a reduced risk of being in the money compared to higher delta options.
Long-Term Options (Expiring November 15, 2024)
- Short 35.0, Long 36.0 Call Spread:
- Short Call (35.0):
- Delta: 0.606
- Gamma: 0.063
- Theta: -0.0020
- Vega: 9.507
- Premium: $2.00
- Long Call (36.0):
- Delta: 0.538
- Gamma: 0.066
- Theta: -0.0027
- Vega: 9.971
- Premium: $1.40
This spread results in a net credit of $0.60 (2.00 - 1.40) and features a moderate delta for the short call (0.606), suggesting a balanced risk/reward profile with minimized assignment risk.
Longest Term Options (Expiring December 20, 2024)
- Short 37.0, Long 38.0 Call Spread:
- Short Call (37.0):
- Delta: 0.448
- Gamma: 0.071
- Theta: -0.0020
- Vega: 10.898
- Premium: $2.04
- Long Call (38.0):
- Delta: 0.371
- Gamma: 0.072
- Theta: -0.0021
- Vega: 10.523
- Premium: $1.61
This option set offers a net credit of $0.43 (2.04 - 1.61) with a modest delta for the short call (0.448), reflecting a lower probability of assignment and providing a robust hedging opportunity.
Summary
The selected strategies span from near-term to long-term and are chosen based on maximizing net credit received while minimizing the risk of assignment by avoiding high delta short calls. The near-term strategies generally offer the highest profit margins, while the longer-term options provide a balanced risk/reward ratio with lower assignment probabilities. Adjustments can be made to the target strike prices or expiration dates if market conditions change or different risk profiles are desired.
Vertical Bull Call Spread Option Strategy
Given the vertical bull call spread options strategy, our objective is to purchase a lower strike call option while simultaneously selling a higher strike call option within the same expiration date. This strategy is typically employed when there is a moderate bullish outlook on the stock, in this case, Western Midstream Partners, LP (WES), expecting the price to rise within a specific range.
Let's take into account your target stock price is 2% over or under the current stock price, which means you're anticipating minor near-term appreciation. To minimize the risk of shares being assigned, we'll choose strike prices that are either just in the money or slightly out of the money.
- Near-term Option: Expiry 2024-05-17
- Buy Call: Strike Price 33.0, Delta 0.9994834211: This option is deep in the money, reducing the risk of significant share assignment, although it carries a higher premium.
- Sell Call: Strike Price 36.0, Delta 0.8042400616: This out-of-the-money call will incur a moderate premium but offers a higher return potential with lesser risk of assignment.
Analysis: Combining these will provide moderate upside potential with relatively high safety against undesirable assignment. Given its near expiry, this spread captures potential immediate appreciation with high profits due to high premium differences.
- Short-term Option: Expiry 2024-06-21
- Buy Call: Strike Price 33.0, Delta 0.7650983044: Slightly in the money, offering a lower likelihood of share assignment while providing a good entry premium.
- Sell Call: Strike Price 36.0, Delta 0.6870137692: Out-of-the-money, capturing decent premium and offering safe cushion against assignment.
Analysis: This spread presents a balance between protecting against assignment and capturing intermediate potential gains, given a favorable outlook within this short-term period.
- Mid-term Option: Expiry 2024-08-16
- Buy Call: Strike Price 30.0, Delta 0.793418844: This call is somewhat in the money ensuring decent initial delta hedge and moderate premium.
- Sell Call: Strike Price 35.0, Delta 0.6855046193: This is on the higher strike side, giving good premium and avoiding significant assignment risk.
Analysis: A good risk-reward strategy combining moderate potential vs. higher premium with controlled assignment risk for a mid-term horizon.
- Long-term Option: Expiry 2024-11-15
- Buy Call: Strike Price 30.0, Delta 0.720371194: Provides a lower premium and lower risk on earlier assignment statuses.
- Sell Call: Strike Price 35.0, Delta 0.6067209001: Reliable strikes ensure diminishing risk for premiums collected longer horizons, reducing chance of preventing assignment while capturing upside potential.
Analysis: This spread is adept for capturing long-term upside movement of the stock, with limited immediate cash layout and ample safety against unpredictable long-term assignments.
- Longest-term Option: Expiry 2024-12-20
- Buy Call: Strike Price 30.0, Delta 0.7101927042: Architected to be moderately in the money, ensuring limited premium while capturing effective future gains.
- Sell Call: Strike Price 35.0, Delta 0.5825771143: Heightened safety net vs unexpected assignment while capturing effective potential upside
Analysis: Suitable for investors willing to wait for a long period while sustaining maximum premium collected, effectively capitalizing on cost vs. benefit in long-term duration.
Selecting these vertical bull call spreads, with overlapping strike prices ensuring balanced delta exposure, will enable positioning based on varying term outlook and stock behavior with controlled effort against sudden assignment risks.
Spread Option Strategy
Based on the provided data, constructing a calendar spread involves determining the optimal combination of long call options to buy and short put options to sell. The goal here is not only to achieve a profitable return on investment (ROI) but to also minimize the risk of having shares assigned, especially as the target stock price fluctuates within a range of 2% over or under the current stock price. Keeping this in mind, I will list five choices starting from near-term options to long-term options for a potential calendar spread strategy.
Near-Term Option Strategy
- Expiration Date: 2024-06-21, Strike Price: 32
- Long Call Option:
- Delta: 0.797
- Gamma: 0.0368
- Vega: 3.25
- Theta: -0.0226
- Premium: $4.02
- ROI: 0.529
- Profit: $2.128
- Short Put Option:
- Delta: -0.1489
- Gamma: 0.0392
- Vega: 2.75
- Theta: -0.0191
- Premium: $0.05
- ROI: 100%
- Profit: $0.05
- Analysis: This combination offers a balanced risk with delta values suggesting a moderate exposure to underlying price movements. The principal advantage is high ROI on the put side while maintaining a solid profit on the call side, minimizing the risk of share assignment given that the put delta is relatively low.
Mid-Term Option Strategy
- Expiration Date: 2024-08-16, Strike Price: 31
- Long Call Option:
- Delta: 0.821
- Gamma: 0.0326
- Vega: 4.46
- Theta: -0.0042
- Premium: $4.8
- ROI: 0.489
- Profit: $2.348
- Short Put Option:
- Delta: -0.1159
- Gamma: 0.0404
- Vega: 3.66
- Theta: -0.0056
- Premium: $0.18
- ROI: 100%
- Profit: $0.18
- Analysis: This combination offers an almost even delta value on the call side, ensuring that movements in the underlying have a substantial but manageable effect. The put option provides a good ROI and manageable delta to keep assignment risk on the lower end.
Another Mid-Term Option Strategy
- Expiration Date: 2024-08-16, Strike Price: 36
- Long Call Option:
- Delta: 0.607
- Gamma: 0.0635
- Vega: 9.51
- Theta: -0.002
- Premium: $2.0
- ROI: 0.574
- Profit: $1.148
- Short Put Option:
- Delta: -0.129
- Gamma: 0.159
- Vega: 0.76
- Theta: -0.0238
- Premium: $0.3
- ROI: 27.217
- Profit: $1.1
- Analysis: The provided substantial Vega offers higher sensitivity to volatility changes. The balanced delta values favorably position it towards moderate stock price fluctuations. The ROI on short put options adds to the profitability while keeping an eye on placement at higher strike price limits' assignment risk.
Longer-Term Option Strategy
- Expiration Date: 2024-11-15, Strike Price: 32
- Long Call Option:
- Delta: 0.737
- Gamma: 0.038
- Vega: 7.63
- Theta: -0.0015
- Premium: $4.18
- ROI: 0.471
- Profit: $1.968
- Short Put Option:
- Delta: -0.2957
- Gamma: 0.0319
- Vega: 8.94
- Theta: -0.0109
- Premium: $1.72
- ROI: 100%
- Profit: $1.72
- Analysis: This strategy leverages a longer-term expiration to manage assignment risk effectively, with a theta that minimizes time decay impact. The moderate delta on the call option also ensures exposure without substantial assignment concern, paired with a strong ROI on the put side.
Another Longer-Term Option Strategy
- Expiration Date: 2024-11-15, Strike Price: 30
- Long Call Option:
- Delta: 0.720
- Gamma: 0.0203
- Vega: 7.95
- Theta: -0.0073
- Premium: $5.6
- ROI: 0.455
- Profit: $2.548
- Short Put Option:
- Delta: -0.1499
- Gamma: 0.0282
- Vega: 6.09
- Theta: -0.0058
- Premium: $0.3
- ROI: 100%
- Profit: $0.3
- Analysis: This combination ensures high profitability potential given the favorable delta and lower assignment risk with put options further strengthened by a significant Vega, ensuring good responsiveness to volatility shifts while maintaining strong ROI on the puts.
By balancing delta, gamma, vega, theta, and rho among these options, though primarily focused on profitability, one must be cautious in mitigating the risk of assignment by observing the market trends and target price ranges meticulously. Each of these configurations offers a varied degree of risk and return suited to different investment strategies.
Calendar Spread Option Strategy #1
Calendar spreads are an excellent strategy for traders looking to profit from differential time decay in options while minimizing risk. When evaluating the most profitable calendar spread strategy for Western Midstream Partners, LP (WES), we must analyze "the Greeks" to find the optimal strike prices and expiration dates. Our goal is to buy a put option at one expiration date and sell a call option at a different expiration date, minimizing the risk of having shares assigned by focusing on options that are close to the target stock price, which can be 2% over or under the current stock price.
Near-term Option (May 2024 and June 2024)
- Option Pair 1: Sell May 2024 Call and Buy June 2024 Put
- Sell Call May 2024 Expiration:
- Strike Price: $34.0
- Delta: 0.8556, Gamma: 0.0648, Vega: 0.6276, Theta: -0.1934, Rho: 0.1553
- Premium: $3.59, ROI: 26.13%, Profit: $0.938
- Buy Put June 2024 Expiration:
- Strike Price: $35.0
- Delta: 0.7829, Gamma: 0.0956, Vega: 3.3946, Theta: -0.0072, Rho: 2.7083
- Premium: $2.92, ROI: 43.42%, Profit: $1.268
- This near-term strategy leverages a relatively high theta for the call due to its closer expiration, hedged by the slightly lower yet still substantial theta of the put for the subsequent month. The higher vega of the June put will also capitalize on potential volatility.
Mid-term Options (August 2024)
- Option Pair 2: Sell August 2024 Call and Buy August 2024 Put
- Sell Call August 2024 Expiration:
- Strike Price: $36.0
- Delta: 0.6015, Gamma: 0.0952, Vega: 7.0389, Theta: -0.0045, Rho: 5.2199
- Premium: $2.6, ROI: 74.92%, Profit: $1.948
- Buy Put August 2024 Expiration:
- Strike Price: $37.0
- Delta: 0.5007, Gamma: 0.1013, Vega: 7.3488, Theta: -0.0053, Rho: 4.3991
- Premium: $1.7, ROI: 100%, Profit: $1.7
- This strategy optimizes the balance between delta (indicative of price movement sensitivity) and vega (measure of volatility sensitivity), ensuring profit from both theta decay and volatility increases during the mid term.
Longer-term Options (November 2024 and December 2024)
- Option Pair 3: Sell November 2024 Call and Buy November 2024 Put
- Sell Call November 2024 Expiration:
- Strike Price: $37.0
- Delta: 0.4676, Gamma: 0.0691, Vega: 10.0989, Theta: -0.0031, Rho: 7.8788
- Premium: $1.3, ROI: 100%, Profit: $1.3
- Buy Put November 2024 Expiration:
- Strike Price: $38.0
- Delta: 0.4028, Gamma: 0.0659, Vega: 9.9103, Theta: -0.0035, Rho: 6.8242
- Premium: $1.45, ROI: 100%, Profit: $1.45
-
This longer-term strategy maximizes decay by trading off a slightly lower delta for higher theta and vega values, expecting the market to remain relatively stable but profiting from incremental time decay and volatility changes.
-
Option Pair 4: Sell December 2024 Call and Buy December 2024 Put
- Sell Call December 2024 Expiration:
- Strike Price: $37.0
- Delta: 0.4476, Gamma: 0.0716, Vega: 10.8977, Theta: -0.0020, Rho: 9.0383
- Premium: $2.04, ROI: 100%, Profit: $2.04
- Buy Put December 2024 Expiration:
- Strike Price: $38.0
- Delta: 0.3710, Gamma: 0.0720, Vega: 10.5235, Theta: -0.0021, Rho: 7.5897
- Premium: $1.61, ROI: 100%, Profit: $1.61
-
The December expiration pair enhances the profitability through a combination of higher premiums and promising return on investment (ROI), considering both gamma and vega for small adjustments in price movement and volatility shift respectively.
-
Option Pair 5: Sell December 2024 Call and Buy December 2024 Put
- Sell Call December 2024 Expiration:
- Strike Price: $36.0
- Delta: 0.5218, Gamma: 0.0629, Vega: 10.8279, Theta: -0.0021, Rho: 10.2848
- Premium: $1.55, ROI: 57.93%, Profit: $0.898
- Buy Put December 2024 Expiration:
- Strike Price: $37.0
- Delta: 0.4476, Gamma: 0.0716, Vega: 10.8977, Theta: -0.0020, Rho: 9.0383
- Premium: $2.04, ROI: 100%, Profit: $2.04
- This pair also benefits from a balance between theta decay and volatility, ensuring a steady increase in profit over the period due to consistent exposure to vega and delta.
These five options pairs offer a comprehensive range of strategies, from near-term to long-term horizons, maximizing profitability while keeping the risk of assignment manageable. The use of vega in these options is particularly beneficial, given the substantial sensitivity to volatility which supplements gains from time decay.
Calendar Spread Option Strategy #2
To determine the most profitable calendar spread options strategy for Western Midstream Partners, LP (WES), it is crucial to balance the premiums received from selling the put options with the premiums paid for buying the call options. Given the target stock price is 2% above or below the current price, we need to consider options that limit the risk of the stock being assigned while achieving the highest profit potential. Based on the Greeks provided, here are five optimal choices, ranging from near-term to long-term expiration dates:
1. Near-Term Strategy: - Sell June 21, 2024, $36 Put Option: - Delta: 0.687 - Gamma: 0.132 - Vega: 4.14 - Theta: -0.0086 - Premium: $1.9
- Buy June 21, 2024, $36 Call Option:
- Data not provided, but assume a similar Delta due to the same strike price.
With Delta values nearing 0.7, this strike price is slightly out-of-the-money (OTM), minimizing the risk of assignment. The premium of $1.9 provides a solid return, but it also gives room for positive Theta decay.
2. Mid-Term Strategy: - Sell August 16, 2024, $34 Put Option: - Delta: 0.745 - Gamma: 0.064 - Vega: 5.68 - Theta: -0.0034 - Premium: $3.8
- Buy August 16, 2024, $34 Call Option:
- Data not provided, but assume it has reasonable Delta due to the same strike price.
The Delta of 0.745 makes this option moderately ITM, reducing the risk of assignment. It also has a higher Vega, indicating sensitivity to volatility changes, which is favorable in a market where volatility can increase.
3. Long-Term Strategy: - Sell November 15, 2024, $37 Put Option: - Delta: 0.467 - Gamma: 0.069 - Vega: 10.10 - Theta: -0.0030 - Premium: $1.3
- Buy November 15, 2024, $37 Call Option:
- Data not provided, but assume a similar Delta due to the same strike price.
A Delta close to 0.467 for the put option suggests a balanced position, quad ensuring that the chances of assignment are moderate. The premium remains attractive.
4. Extended Strategy: - Sell December 20, 2024, $35 Put Option: - Delta: 0.582 - Gamma: 0.055 - Vega: 10.45 - Theta: -0.0020 - Premium: $3.2
- Buy December 20, 2024, $35 Call Option:
- Data not provided, but assume a similar Delta close to the same strike.
The Delta here indicates the position is slightly OTM, minimizing immediate assignment risk. The substantial premium of $3.2 combined with the Vega effect makes it a profitable choice.
5. Longer Term Strategy: - Sell December 20, 2024, $38 Put Option: - Delta: 0.371 - Gamma: 0.072 - Vega: 10.52 - Theta: -0.0021 - Premium: $1.61
- Buy December 20, 2024, $38 Call Option:
- Data not provided, but assume a similar Delta to a similar strike.
The Delta value being sub-0.50 showcases an OTM position, making it less likely for shares to be called upon. The premium received provides adequate profitability while reducing assignment concern.
By selling put options with moderate Delta values, these strategies ensure the risk of shares being assigned is balanced, while the higher Theta values contribute positively to the overall trade's profitability, especially when offset against call options with similar characteristics. The use of different expiration dates allows for flexibility in leveraging short-term gains while being positioned for long-term profitability based on the Greeks and premiums.
Similar Companies in Oil & Gas Midstream:
DT Midstream, Inc. (DTM), MPLX LP (MPLX), NuStar Energy L.P. (NS), Plains All American Pipeline, L.P. (PAA), Genesis Energy, L.P. (GEL), Hess Midstream LP (HESM), Enterprise Products Partners L.P. (EPD), Energy Transfer LP (ET), Antero Midstream Corporation (AM), Magellan Midstream Partners, L.P. (MMP), Kinder Morgan, Inc. (KMI), ONEOK, Inc. (OKE), Targa Resources Corp. (TRGP), DCP Midstream, LP (DCP), Enbridge Inc. (ENB), Williams Companies, Inc. (WMB)
https://www.fool.com/investing/2024/04/04/this-69-yielding-dividend-stock-just-cant-stop-add/
https://seekingalpha.com/article/4682809-very-good-news-for-energy-stocks
https://finance.yahoo.com/news/western-midstream-announces-first-quarter-201500284.html
https://www.fool.com/investing/2024/04/29/this-billionaire-is-pounding-the-table-for-these-u/
https://seekingalpha.com/article/4687300-i-am-swimming-in-dividends
https://www.fool.com/investing/2024/05/05/this-billionaire-is-selling-this-magnificent-divid/
https://finance.yahoo.com/news/why-earnings-season-could-great-123800108.html
https://finance.yahoo.com/news/western-midstream-announces-first-quarter-201500343.html
https://www.fool.com/investing/2024/05/11/billionaire-bond-king-bill-gross-says-this-103-ult/
https://www.fool.com/investing/2024/05/13/billionaires-cant-stop-buying-these-3-energy-stock/
https://seekingalpha.com/article/4692727-western-midstream-continues-to-drive-reliable-returns
https://finance.yahoo.com/news/western-midstream-announces-first-quarter-110000713.html
https://www.sec.gov/Archives/edgar/data/1414475/000142390224000037/wes-20240331.htm
Copyright © 2024 Tiny Computers (email@tinycomputers.io)
Report ID: ITvXBG
Cost: $0.60527
https://reports.tinycomputers.io/WES/WES-2024-05-14.html Home