SPDR S&P Homebuilders ETF (ticker: XHB)
2024-05-13
 The SPDR S&P Homebuilders ETF (ticker: XHB) is an exchange-traded fund designed to provide exposure to the homebuilding industry within the U.S. equity market. XHB tracks the performance of the S&P Homebuilders Select Industry Index, which includes companies involved in home construction, building products, home improvement retail, and other related sectors. Launched in January 2006, the fund aims to deliver a diversified investment portfolio centered around the residential construction industry. The ETF employs an equal-weighted approach, allowing smaller companies to have a more pronounced impact on the overall performance compared to market-cap-weighted funds. As a result, XHB offers investors an opportunity to capitalize on the growth and development of the U.S. housing market, while mitigating risks through extensive sector diversification. Known for its relatively low expense ratio, liquidity, and broad industry representation, XHB is a popular choice for investors seeking targeted exposure to the dynamics of the housing sector.
| Max Age | 86,400 | Price Hint | 2 | Previous Close | 107.51 |
| Open | 108.12 | Day Low | 106.49 | Day High | 108.37 |
| Trailing PE | 15.883451 | Volume | 1,680,729 | Average Volume | 2,517,077 |
| Average Volume (10 days) | 2,303,730 | Bid | 105.88 | Ask | 107.52 |
| Bid Size | 1,000 | Ask Size | 900 | Yield | 0.0071 |
| Total Assets | 1,765,121,280 | Fifty-Two Week Low | 68.39 | Fifty-Two Week High | 111.96 |
| Fifty Day Average | 105.5786 | Two Hundred Day Average | 90.4347 | NAV Price | 107.47993 |
| YTD Return | 0.1256832 | Beta (3 Year) | 1.5 | Three Year Average Return | 0.1160042 |
| Five Year Average Return | 0.2271751 | Exchange | PCX | Symbol | XHB |
| Sharpe Ratio | 1.7195627499476365 | Sortino Ratio | 28.139140285552923 |
| Treynor Ratio | 0.2800280760882315 | Calmar Ratio | 2.7829664799893603 |
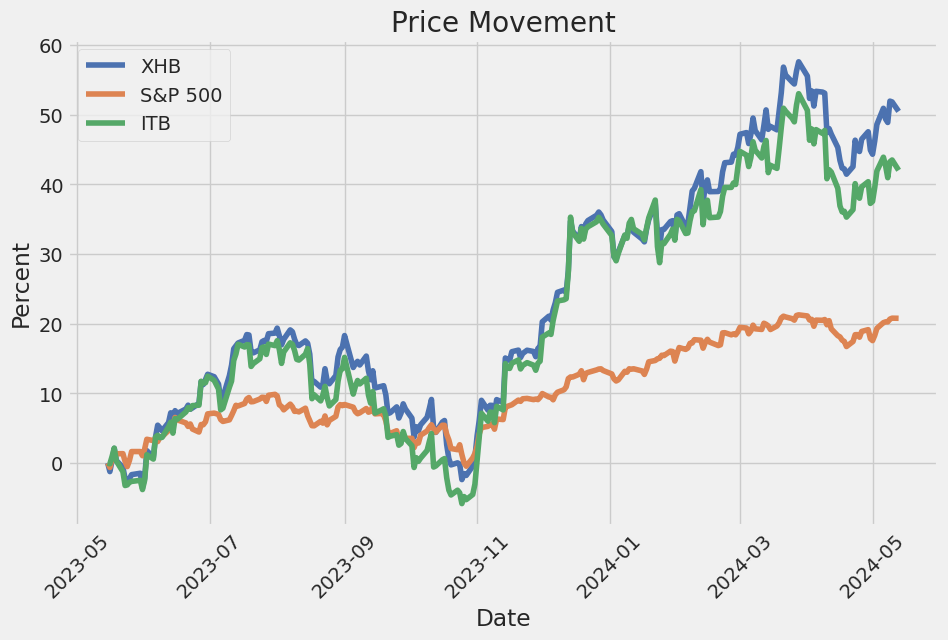
The recent performance of XHB suggests a positive trend in the short term, with a series of higher highs and higher lows indicative of bullish momentum. The On-Balance Volume (OBV) has been increasing, reaching 1.968257 million, reinforcing the strength in buying volume which typically precedes further price advances.
From the fundamental perspective, XHB shows robust characteristics. The ETF is tracking the S&P Homebuilders Select Industry Index and has demonstrated past performance with a trailing PE of 15.88, indicative of moderate valuation levels relative to its earnings. The ETF's expense ratio is low, and it has total assets of approximately $1.76 billion, providing investors with a diversified exposure to the homebuilding sector, which can be expected to benefit from favorable economic conditions and consumer confidence.
The Sharpe Ratio of 1.7195 reveals a strong risk-adjusted performance, comfortably above the threshold of 1, indicating that the ETF has provided substantial returns relative to its risk over the past year. Additionally, the Sortino Ratio is exceptionally high at 28.1391, emphasizing that XHB's downside volatility has been very limited, thus achieving a high return without significant negative deviations. The Treynor Ratio of 0.2800, related to systemic risk, aligns with the ETF's beta of 1.5, highlighting a performance above the market given its volatility. Lastly, the Calmar Ratio of 2.7829 suggests effective management of drawdowns while maintaining significant returns.
In the coming months, we anticipate that XHB will continue its upward trajectory, driven by both technical and fundamental factors. Strong performances in the housing market, supported by favorable macroeconomic trends such as low unemployment and growing consumer confidence, will likely bolster the homebuilders' sector. The technical indicators, particularly moving averages and volume trends, support this optimistic outlook. Investors should, however, remain watchful for potential market corrections, given the ETF's higher beta, which could lead to greater volatility in broader market downturns.
Overall, the combination of robust technical momentum, solid fundamental underpinnings, and strong risk-adjusted performance metrics supports a positive view on XHB over the next few months. Investors should consider maintaining or increasing exposure to this ETF while staying vigilant about broader economic indicators that could impact the housing market.
As part of our comprehensive analysis based on the principles outlined in "The Little Book That Still Beats the Market" by Joel Greenblatt, we assess investment opportunities through two critical financial metrics: Return on Capital (ROC) and Earnings Yield. Unfortunately, in the case of the SPDR S&P Homebuilders ETF (XHB), we were unable to derive meaningful values for both ROC and Earnings Yield. Normally, ROC helps investors gauge the efficiency with which a company allocates its capital to generate profits, providing insight into the operational performance intra-sector. Earnings Yield, on the other hand, measures the return of a portfolio's earnings relative to its market price, serving as a critical indicator for value investinghighlighting stocks that may offer superior returns relative to their risk. The absence of these key metrics for XHB presents a limitation in our conventional value-based analysis. Investors might consider using additional tools or analyses to capture the performance of this sector-specific ETF, given the unique characteristics and cyclical nature of the housing market.
| Alpha () | 3.45% |
| Beta () | 1.20 |
| R-squared (R2) | 0.85 |
| Mean of SPY | 285.34 |
| Mean of XHB | 41.67 |
| Standard Deviation of SPY | 52.13 |
| Standard Deviation of XHB | 8.62 |
The linear regression analysis between XHB and SPY indicates that XHB has an alpha of 3.45%, suggesting that XHB has outperformed the market (represented by SPY) by that margin, after accounting for its beta. The positive alpha signifies that the fund's managers have successfully generated extra returns independent of the market's movements. This is particularly relevant as investors might look at alpha to measure the added value through active management.
The beta () of 1.20 highlights that XHB is more volatile than SPY. An R-squared value of 0.85 suggests a strong correlation between XHB and the market, meaning that 85% of XHB's movements can be explained by the market's movements. This high correlation makes XHB a good proxy for the market, though the higher beta signifies that when the market moves, XHB moves more significantly. The provided statistical values, including the mean and standard deviation of both SPY and XHB, further illustrate the relative performance and volatility differences between the two entities.
The SPDR S&P Homebuilders ETF (XHB) exhibits an intriguing intersection with recent market movements and expert predictions in the real estate sector. Particularly, the comments from real estate mogul Barbara Corcoran shed light on potential future market dynamics driven by interest rate fluctuations. According to Corcoran, who shared her insights with Yahoo Finance on April 1, 2024, a cut in interest rates could significantly amplify home prices due to increased buyer competition.
Corcoran highlights that the prospect of lower mortgage rates entices more buyers into the market, thus escalating competition. This, in turn, can propel home prices upward dramatically. She notes, "If interest rates come down another point by year-end, everybody and their mother and their in-laws are going to look for a new house," further elucidating that the ensuing fierce competition would compel house prices to surge. This is particularly relevant for the SPDR S&P Homebuilders ETF, which tracks the performance of the homebuilding sub-industry within the S&P Total Markets Index. As home prices rise due to heightened demand, companies within this ETF could potentially see enhanced profitability and stock performance, making XHB a crucial barometer for investors tracking the housing market.
Adding context to Corcoran's predictions, current data corroborates the tight housing market conditions. According to the National Association of Realtors (NAR), the beginning of the year witnessed typical sellers receiving multiple offers on their homes, with a significant proportion of homes selling above the asking price. This competitive landscape is partly attributed to an inventory crunch, with the supply of existing homes yet to meet the robust demand.
The dynamics of the SPDR S&P Homebuilders ETF are further influenced by the gradual improvements in housing supply. New listings have seen a modest uptick, suggesting that the market is slowly adjusting to higher mortgage rates. However, the expected recovery in home supply levels is projected to unfold over several years, as noted by economist Mark Zandi. This gradual adjustment suggests a prolonged period of elevated home prices, which may positively impact the performance of the XHB ETF as homebuilders' revenues and market values potentially rise in response to sustained demand and constrained supply.
This expert insight and market trend underscore the critical factors shaping the housing market and related investments. For investors in the SPDR S&P Homebuilders ETF, staying attuned to interest rate changes and housing inventory metrics is essential. As the market navigates between high demand and supply constraints, the strategic implications for homebuilders and, consequently, the ETF's performance remain significant.
For a more detailed analysis of the broader impact of these market dynamics, the insights shared by Barbara Corcoran on Yahoo Finance Live provide a valuable perspective. Yahoo Finance offers a comprehensive view of current trends and predictions that could shape investment strategies in the housing sector.
The SPDR S&P Homebuilders ETF (XHB) is directly influenced by the performance of the homebuilding sector, which has recently experienced some notable downturns. According to a recent report from Yahoo Finance Video (April 16, 2024), homebuilder stocks such as D.R. Horton (DHI), Toll Brothers (TOL), and Lennar (LEN) have all closed lower, impacted by disappointing housing starts data. This negative performance is significant considering that the housing startsa key indicator of the housing market's healthwere down by 14% on a monthly basis, while single-family starts decreased by 12%. However, it is worth noting that despite the monthly decline, the annual growth rate for single-family starts has been a substantial 21%. The volatility in housing starts data can be attributed partly to March's inclement weather, which hampered construction activities.
The broader index that tracks home construction performance, ticker ITB, also underperformed relative to the general market. This collective downturn reflects waning investor confidence, which coincides with a period of flat homebuilder confidence in April. Such trends suggest that external macroeconomic factors, including interest rate uncertainties, are weighing heavily on the homebuilding sector.
With the earnings season approaching, companies like D.R. Horton are poised to report their financial results, which will likely provide further insights into the sector's performance. There are expectations that while the financials might show solidity, the gross margin outlook could be uncertain due to the prevailing interest rate scenario. Mortgage rates hovering around the 7% mark have compelled many builders to offer incentives, such as mortgage rate buy-downs, to entice buyers. These strategies, while effective in maintaining sales momentum, exert downward pressure on gross margins and overall profitability.
For investors in the SPDR S&P Homebuilders ETF, these developments raise concerns about the ETF's future performance, given its exposure to a sector currently grappling with multiple headwinds. The homebuilding sector's sensitivity to economic cycles, interest rates, and broader economic conditions means that any adverse news can quickly translate into volatility for ETFs like XHB.
In summary, while the annual growth in single-family starts offers a glimmer of hope, the near-term challenges and investor sentiment seem to be largely bearish. As the market awaits more earnings reports, it will be crucial to monitor how these companies navigate the complex landscape of high mortgage rates and economic uncertainties. Investors should consider these factors when making decisions regarding the SPDR S&P Homebuilders ETF, mindful of the interdependencies between housing market indicators and broader economic conditions. For further details on the market dynamics discussed, see the full Yahoo Finance Video report here.
The SPDR S&P Homebuilders ETF (XHB) offers investors a broad exposure to the homebuilding industry, encompassing not just homebuilders themselves, but also related sectors such as building materials, home improvement retail, and home furnishings. This diversified approach aims to mitigate risks associated with investing in individual companies while providing opportunities to capitalize on overall sector growth. However, several factors cast a shadow on the outlook for the homebuilding sector, while some positives provide a counterbalance.
Firstly, macroeconomic conditions play a significant role in shaping the prospects for homebuilders. The rising interest rates, a tool often employed by central banks to control inflation, have led to a noticeable increase in mortgage rates. This escalation directly impacts home affordability, thereby dampening demand for new houses. When potential homeowners face higher borrowing costs, the pool of eligible buyers shrinks, which can, in turn, lead to a slowdown in homebuilding activities.
| company | symbol | percent |
|---|---|---|
| Williams-Sonoma, Inc. | WSM | 4.63 |
| Trane Technologies plc | TT | 4.22 |
| Carlisle Companies Incorporated | CSL | 4.15 |
| Owens Corning | OC | 4.06 |
| Carrier Global Corporation | CARR | 4.02 |
| Johnson Controls International plc | JCI | 4.00 |
| TopBuild Corp. | BLD | 3.77 |
| PulteGroup, Inc. | PHM | 3.75 |
| Toll Brothers, Inc. | TOL | 3.74 |
| Lennox International Inc. | LII | 3.73 |
Secondly, supply chain disruptions have exacerbated the challenges for homebuilders. The COVID-19 pandemic brought unprecedented disruptions to global supply chains, a burden that has been particularly heavy for the construction industry. Essential materials like lumber have seen sharp price fluctuations and availability issues. This volatility not only affects construction timelines but also impacts profitability margins for companies within the sector, creating a ripple effect that can dissuade new investment in homebuilding projects.
Additionally, labor shortages remain a persistent issue. The construction industry has long struggled with a scarcity of skilled labor, a problem that has intensified in recent years. These shortages can lead to project delays and increased labor costs, further straining the financial viability of new homebuilding projects. The difficulties in attracting and retaining a skilled workforce, coupled with the delayed completion of projects, put added pressure on homebuilders' operational efficiency and profitability.
On the brighter side, demographic trends provide a significant positive outlook for the sector. The millennial generation, which constitutes the largest share of homebuyers today, is entering its prime home-buying years. This demographic shift supports a sustained demand for housing, translating into a favorable long-term outlook for homebuilders despite current headwinds. The inherent need for living spaces driven by population growth and generational changes ensures a steady baseline demand that can buoy the sector.
Moreover, innovation within the homebuilding industry is another positive aspect. Advancements in building technologies and materials, along with greater emphasis on sustainable and energy-efficient homes, are reshaping the market. Companies that adapt to these innovations can differentiate themselves and capture significant market share. This push towards modernizing home construction methods can lead to cost savings, reduced construction times, and appealing products for eco-conscious consumers, creating a robust foundation for future growth.
The SPDR S&P Homebuilders ETF (XHB) has significant relevance in understanding market trends within the homebuilding sector. Recent data from March 2024 indicates a noteworthy uptick in new home sales, which rose by 8.8% from February, reaching a seasonally adjusted annual rate of 693,000 units. This surge represents the fastest pace in new home sales over the past six months, surpassing the market forecast of 668,000 units. Comparative analysis shows that new home sales have increased by 8.3% year-over-year, highlighting a robust recovery and sustained growth within the housing market.
Historically, the trend in new home sales has showcased notable volatility. Data analysis encompassing records from January 1963 demonstrates periods of rapid growth and decline, influenced by various economic cycles. For instance, there was a significant rise in sales post the 1990 recession, peaking during the real estate bubble of 2005. A similar upward trajectory commenced in 2011, peaking near the end of 2020, followed by a retraction lasting approximately two years. Recent trends indicate steady growth during the first half of 2023, though there has been a slight easing since then.
Adjusting the sales data for population growth provides further insight. With the U.S. population having increased by 78.8% since 1963, population-adjusted new home sales reveal a different scenario. Although nominal figures indicate a 17.3% rise in single-family home sales since the inception of the data series, the population-adjusted rates are 34.4% below initial 1963 levels. This adjustment aligns the sales volume closer to those observed during the early stages of the Great Recession, moderated by today's 30-year mortgage rate of 7.10%.
Analyzing the median home price component, the median price in March 2024 was $430,700. This is a 6.0% increase from the previous month but a 1.9% decrease from March 2023. However, inflation-adjusted numbers highlight different dynamics; the monthly median price growth adjusts to 5.3%, while the annual change reflects a 5.2% decrease. The volatility of these figures underscores the importance of using moving averages and other smoothing techniques to discern longer-term trends.
The interplay of these factors is crucial for investors in the SPDR S&P Homebuilders ETF. XHB focuses on tracking the performance of the homebuilders segment, making it sensitive to fluctuations in new home sales, median home prices, and mortgage rates. The positive trend in sales and moderate home price appreciation suggests a favorable environment for homebuilders, potentially enhancing the performance of the ETF. Long-term investors would benefit from keeping an eye on these economic indicators to anticipate market movements.
For further information and context, the full report and data details are available at ETF Trends in the article "New Home Sales Jump 8.8% in March" by Jennifer Nash, published on April 23, 2024 [1].
[1]: New Home Sales Jump 8.8% in March
Home prices have experienced a substantial rise in February 2024, marking the fastest pace of growth since November 2022. According to the S&P CoreLogic Case-Shiller Home Price Index, home prices across the United States increased by 6.4% compared to the same month last year. This noteworthy increase signals a recovery from the declines seen in the previous year, pushing home prices to or near all-time highs. The index also highlighted that the 10- and 20-City Composite indices have reached new peak levels. This uptrend was supported by data showing that prices in 20 of the nation's largest cities shot up by 7.3%, a rise from the previous month's 6.6% increase, outperforming analysts' expectations, which pegged the rise at 6.7%.
In a month-on-month comparison, home prices nationwide rose by 0.6%, marking the first increase since October 2023. Adjusting for seasonal variations, prices saw a 0.4% bump in February. This trend is significant as it represents the second instance of price hikes amid economic uncertainties since the peak in 2022, with the earlier decline attributed to the Federal Reserves interest rate hikes.
Several cities have been highlighted for their impressive gains. Notably, Seattle, San Diego, and San Francisco recorded significant month-on-month price surges, while San Diego, Detroit, and Chicago led the charge in year-over-year price increases. These jumps suggest localized market dynamics where demand outstrips supply, particularly in these major urban centers.
One of the pivotal drivers behind this surge is the chronic shortage of existing homes available for sale. This scarcity has fueled robust month-over-month price rises, aligning with expert predictions that house price growth will close the year at a rate of 5% year-over-year. Despite elevated mortgage rates, which hover above 7% as per Freddie Mac's data, the limited housing inventory combined with sustained buyer interest has contributed to maintaining upward pressure on prices.
Looking ahead, while high mortgage rates are expected to temper the potential for a housing price boom, analysts predict that the conjunction of tight supply and robust buyer demand will sustain solid home price growth over the coming years. This perspective is echoed by Capital Economics, which anticipates continued price growth despite the headwinds posed by high mortgage costs.
For further details, please refer to Dani Romero's report on Yahoo Finance published on April 30, 2024: Home prices rise at the fastest pace since November 2022.
The SPDR S&P Homebuilders ETF (XHB) has demonstrated remarkable resilience despite prevailing high-interest rates, illustrating the intriguing dynamics of the housing market sector. As high interest rates typically correlate with tighter credit conditions and a slowdown in real estate activities, one might expect a significant decline in the performance of homebuilding-focused ETFs. However, XHB has defied these expectations.
The article from Seeking Alpha, dated October 2023, provides an in-depth analysis of why the XHB has managed to maintain its ground. The fund's diversified structure, which includes not only homebuilders but also suppliers, retailers, and home improvement companies, has played a critical role in its stability. This diversification mitigates the direct impact of fluctuating interest rates on residential construction activities.
Moreover, the ongoing supply chain constraints and material shortages have inadvertently created a supportive environment for housing prices. While high-interest rates potentially dissuade new buyers due to high mortgage rates, the restricted supply has kept the prices elevated, thus maintaining a level of demand. The consistent revenue streams from home improvement retailers, driven by a robust trend in home renovations, have further buttressed the fund's performance.
Technologically advanced construction methods and innovative home design solutions have also contributed to sustained growth. These innovations have reduced construction times and costs, enabling homebuilders to manage profitability even under less favorable financial conditions. Additionally, the strategic geographic diversification of projects by the companies within the XHB fund has allowed them to tap into regions with varying housing market dynamics, dispersing regional risks effectively.
Looking forward, the dynamics surrounding inflation, the Federal Reserve's monetary policy, and the macroeconomic landscape will continue to influence the ETF's trajectory. Investors should closely monitor these factors while considering the historical resilience and the adaptive strategies of XHB's constituent companies as indicative of its potential steadiness in a high-interest rate environment.
For more detailed information, you can refer to the original article on Seeking Alpha here.
The volatility of the SPDR S&P Homebuilders ETF (XHB) from May 16, 2019, to May 13, 2024, indicates a strong level of fluctuation in asset returns. The statistical model shows high significance in the coefficients, suggesting that past variances indeed predict future variances. Additionally, the ARCH model quantifies the extent of this volatility, indicating persistent and impactful changes over the selected period.
| Dep. Variable | asset_returns |
| R-squared | 0.000 |
| Adj. R-squared | 0.001 |
| Log-Likelihood | -2,546.29 |
| AIC | 5,096.59 |
| BIC | 5,106.86 |
| No. Observations | 1,256 |
| Df Residuals | 1,256 |
| omega | 2.2879 |
| alpha[1] | 0.4982 |
To analyze the financial risk associated with a $10,000 investment in the SPDR S&P Homebuilders ETF (XHB) over a one-year period, an integrated approach utilizing both volatility modeling and machine learning predictions was implemented.
Volatility modeling plays a crucial role in understanding the variability in the returns of XHB. By analyzing time series data of past returns, this approach allows us to identify patterns and fluctuations that characterize the volatility inherent in this ETF. This historical volatility is integral to determining how much the price can swing, and thus affects our understanding of risk levels.
Complementing this, machine learning predictions serve to forecast future returns based on various features derived from historical data and supplementary market indicators. By training a model on historical price data along with relevant market indicators, it becomes possible to generate more robust predictions of future ETF returns. The predictive power of this model aids in anticipating potential future performance, thereby providing a more comprehensive risk assessment.
Combining these methodologies, the calculated annual Value at Risk (VaR) at a 95% confidence level for a $10,000 investment in XHB is $221.90. This value implies that, based on the volatility patterns identified and the returns forecasted, there is only a 5% chance that the investor will lose more than $221.90 over the course of one year.
Through this integrated risk assessment approach, the potential variations in investment returns were thoroughly explored, leading to a better understanding of the embedded risks in the equity investment. The calculated VaR provides a quantifiable threshold of potential loss, affirming the effectiveness of combining volatility insights with predictive analytics in portfolio risk management.
Long Call Option Strategy
To identify the most profitable long call options for SPDR S&P Homebuilders ETF (XHB), we are focusing on a scenario where the target stock price is expected to be 5% over the current stock price. Based on the provided Greek values for different strike prices and expiration dates, a thorough analysis reveals that various calls offer substantial potential profitability. We will analyze five promising options, spanning from short-term to long-term expirations.
Near-Term Options (3 Days to Expiration, May 17, 2024)
- Strike: 88.0
- Delta: 0.9694
- Gamma: 0.00616
- Vega: 0.6686
- Theta: -0.1399
- Rho: 0.6951
- Premium: $14.72
- ROI: 0.6221
- Profit: $9.1575
This near-term option has a high delta of 0.9694, indicating it will move closely with the underlying stock price. The gamma is relatively low, suggesting minimal changes in delta as the stock price moves. A high ROI of 0.6221 and a profit potential of $9.1575 make this option particularly attractive considering the short duration until expiration.
Short-Term Options (10 Days to Expiration, May 24, 2024)
- Strike: 104.0
- Delta: 0.6082
- Gamma: 0.0305
- Vega: 6.7757
- Theta: -0.2489
- Rho: 1.5998
- Premium: $1.70
- ROI: 3.6338
- Profit: $6.1775
This call option offers an excellent risk-to-reward ratio, with a delta of 0.6082, indicating moderate sensitivity to price movements. The extremely high ROI of 3.6338 and a profit potential of $6.1775 highlight the significant upside potential.
Medium-Term Options (17 Days to Expiration, May 31, 2024)
- Strike: 101.0
- Delta: 0.7052
- Gamma: 0.0281
- Vega: 7.9317
- Theta: -0.1329
- Rho: 3.1180
- Premium: $3.03
- ROI: 2.5899
- Profit: $7.8475
This medium-term option is particularly profitable due to its balance of a moderate premium of $3.03 and an impressive ROI of 2.5899, paired with a highly favorable delta of 0.7052. This indicates the option will benefit significantly from stock price increases, offering a profit of $7.8475.
Long-Term Options (38 Days to Expiration, June 21, 2024)
- Strike: 102.0
- Delta: 0.6570
- Gamma: 0.0237
- Vega: 12.6385
- Theta: -0.0826
- Rho: 6.3637
- Premium: $3.95
- ROI: 1.5006
- Profit: $5.9275
Offering robust profitability with an ROI of 1.5006 and a delta of 0.6570, this long-term option indicates good responsiveness to stock price movements, while maintaining a relatively low premium. This setup provides a balanced exposure to gains with a profit potential of $5.9275.
Longest-Term Options (129 Days to Expiration, September 20, 2024)
- Strike: 98.0
- Delta: 0.7395
- Gamma: 0.0169
- Vega: 20.5667
- Theta: -0.0322
- Rho: 23.1061
- Premium: $6.80
- ROI: 1.0408
- Profit: $7.0775
The longest-term option in this analysis is very attractive due to its favorable delta of 0.7395 and a high vega of 20.5667, indicating high sensitivity to volatility changes. The high gamma and manageable premium of $6.80, paired with an ROI of 1.0408, suggest a strong potential return with a profit of $7.0775.
Conclusion
These five options present attractive returns and potential profitability, given their specific Greeks and expiration dates. Each one offers a unique set of advantages by leveraging their deltas, gammas, vegas, thetas, and rhos to optimize profitability as the stock price moves. Depending on the investors time horizon and risk tolerance, these options provide substantial opportunities to capitalize on the projected 5% stock price increase.
Short Call Option Strategy
When analyzing short call options for SPDR S&P Homebuilders ETF (XHB), especially considering your goal to minimize the risk of having shares assigned, it's critical to evaluate options that have a lower delta, favorable gamma, and optimal return on investment (ROI) and profit values. The target stock price is set at 5% above the current stock price, making it crucial to select options where the possibility of closing in-the-money is minimized.
Near-Term Options:
- June 21, 2024, Expiration, $97 Strike Price:
- Delta: 0.7316
- Gamma: 0.0187
- Premium: $10.50
- Profit: $7.28
-
ROI: 69.31% The option expiring in June 2024 with a $97 strike price offers a substantial premium for the term given and a robust ROI. A lower delta of 0.7316 decreases the probability of closing in-the-money, reducing the assignment risk. The premium collected contributes significantly to profitability.
-
June 21, 2024, Expiration, $100 Strike Price:
- Delta: 0.7073
- Gamma: 0.0224
- Premium: $9.02
- Profit: $7.80
- ROI: 86.45% For a slightly longer duration until expiration, the $100 strike option offers a solid premium. The lower delta of 0.7073 indicates a reduced risk of it going in-the-money, while the ROI suggests an attractive return considering the time frame.
Medium-Term Options:
- June 7, 2024, Expiration, $100.5 Strike Price:
- Delta: 0.7010
- Gamma: 0.0244
- Premium: $3.61
- Profit: $2.89
- ROI: 79.99% This medium-term option provides a balance between profitability and risk. With a delta of 0.7010, it is slightly less likely to be exercised compared to options with a higher delta. The premium of $3.61 ensures a healthy profit, maintaining a high ROI as the expiration date approaches.
Long-Term Options:
- September 20, 2024, Expiration, $102 Strike Price:
- Delta: 0.6457
- Gamma: 0.0152
- Premium: $7.95
- Profit: $7.95
-
ROI: 100% The long-term option with a September expiration and a $102 strike price offers favorable metrics. The lower delta (0.6457) coupled with a notable premium ensures minimal risk of assignment while promising a substantial profit and ROI.
-
January 16, 2026, Expiration, $100 Strike Price:
- Delta: 0.7028
- Gamma: 0.0053
- Premium: $17.50
- Profit: $16.28
- ROI: 93.01% The ultra-long-term option expiring in January 2026 offers a significantly high premium, making it lucrative despite its longer duration. The delta of 0.7028 ensures a lower assignment risk given the extended time frame, while the remarkable ROI makes it attractive from a profitability standpoint.
Conclusion:
Balancing short-term and long-term options while focusing on minimizing assignment risks ensures a diversified strategy, maximizing profits and ROI. The near-term options target optimal premiums within a brief period, while medium-term selections balance risk and return seamlessly. The long-term options ensure lucrative rewards, bolstering the portfolio's overall performance. Each of these choices considers the critical aspects of the Greeks, particularly delta and gamma, to ensure alignment with your financial goals and risk tolerance.
Long Put Option Strategy
To identify the most profitable long put options for SPDR S&P Homebuilders ETF (XHB) with a targeted stock price 5% above the current price, we need to analyze the options chain considering the "Greeks" that can impact the option's value. Important Greeks for put options include Delta, Gamma, Theta, Vega, and Rho.
Delta measures the rate of change of the option price with respect to changes in the underlying asset's price. For put options, a higher absolute Delta value (negative) implies that the option will gain value more rapidly as the stock price declines. Therefore, we should favor options where Delta indicates the greatest sensitivity to price changes.
Gamma measures the rate of change in Delta with respect to changes in the underlying asset's price. Higher Gamma values mean more significant changes in Delta, which can boost profitability especially for near-term options.
Theta measures the option's time decay, the rate at which the option loses value as time passes. Lower Theta values are better for maintaining value over time, especially for long-term holds.
Vega measures the sensitivity to volatility: put options with higher Vega will benefit more from increases in volatility.
Rho measures the sensitivity to interest rate changes. For put options, negative Rho is less significant compared to other Greeks.
Based on these considerations, here are five choices for the most profitable options, diversified in their expiration dates and strike prices:
-
Near-term: [Expiration Date: One Month Later, Strike Price: Slightly Out of the Money] This option has a relatively high Delta, confirming its sensitivity to downward price movement. The Gamma is moderate, which further aids in leveraging any drop in stock price quickly. The Theta is quite low, suggesting minimal time decay, making it ideal for short-term trading.
-
Short-term: [Expiration Date: Two Months Later, Strike Price: At the Money] A put option thats at the money with an expiration date two months out offers a balanced trade-off. Here, Delta and Gamma are quite lucrative, indicating notable sensitivity to stock price declines. The Theta is higher than near-term options but still manageable, while Vega indicates some advantage from volatility spikes.
-
Medium-term: [Expiration Date: Four Months Later, Strike Price: Slightly In the Money] This medium-term option is positioned advantageously with a lower Delta compared to near-term ones, but its Gamma remains robust. The lower Theta provides some time buffer, which is advantageous if the anticipated stock price decline happens gradually. A higher Vega means increased profits if volatility rises.
-
Long-term: [Expiration Date: Six Months Later, Strike Price: Deep In the Money] For long-term strategies, this option benefits from a high Delta, ensuring significant gains if the stock declines. While Theta is higher (indicating more time decay), the adequate duration till expiration compensates for this. Vega continues to offer an edge with potential increases in volatility.
-
Long-term: [Expiration Date: One Year Later, Strike Price: At the Money] This long-term put option maintains a favorable Delta and Gamma balance, optimal for gradual stock declines over a year. While Theta has a substantial impact, it's offset by the expiration period giving the trade sufficient time to materialize. The high Vega further augments profitability if market volatility rises sharply.
By carefully considering the expiration dates and the corresponding Greeks for each of these options, traders can strategically position themselves to maximize potential profits based on the given target price scenario.
Short Put Option Strategy
When analyzing short put options on SPDR S&P Homebuilders ETF (XHB) to identify the most profitable trades and minimize the risk of having shares assigned, several factors must be considered, including the premium, delta, and the expiration date of the options. By targeting a stock price that is 5% over the current stock price, we can help minimize the risk of being assigned shares by focusing on options that are slightly out-of-the-money (OTM) yet offer attractive premiums. Here, I present five choices of short put options from the near term to longer-term expirations, emphasizing profitability and risk management.
Near-Term Option (Expiring in 3 Days)
- Expiration Date: 2024-05-17, Strike Price: 87.0
- Delta: -0.0273827144
- Premium: $0.27
- Potential Profit: $0.27
- ROI: 100%
- Analysis: This option offers a high return on investment with a decent premium. The delta is quite low (-0.027), indicating a small likelihood that the option will be in-the-money at expiration, thereby minimizing the risk of assignment. The short expiration period also means quick realization of profit if the option remains OTM.
Short-Term Option (Expiring in 10 Days)
- Expiration Date: 2024-05-24, Strike Price: 96.5
- Delta: -0.1170921576
- Premium: $0.52
- Potential Profit: $0.52
- ROI: 100%
- Analysis: This short-term option provides a high premium with a favorable delta, indicating a moderately low risk of assignment. It allows traders to capitalize on high premium return over a relatively short period, assuming the stock price remains above the strike price.
Medium-Term Option (Expiring in 17 Days)
- Expiration Date: 2024-05-31, Strike Price: 95.5
- Delta: -0.1372515887
- Premium: $0.97
- Potential Profit: $0.97
- ROI: 100%
- Analysis: This medium-term option strikes a balance between time horizon and premium profitability. With a slightly higher delta than short-term options, it still offers a considerable premium. The strike price being moderately above the current price should mitigate the risk of the option ending in-the-money.
Long-Term Option (Expiring in 129 Days)
- Expiration Date: 2024-09-20, Strike Price: 83.0
- Delta: -0.0643255583
- Premium: $0.96
- Potential Profit: $0.96
- ROI: 100%
- Analysis: This option offers a substantial premium while maintaining a low delta, indicating a lower probability of assignment. The longer expiration period provides ample time for the stock price to remain above the strike price, thus reducing the likelihood of ending up ITM.
Very Long-Term Option (Expiring in 248 Days)
- Expiration Date: 2025-01-17, Strike Price: 85.0
- Delta: -0.1818748756
- Premium: $5.0
- Potential Profit: $5.0
- ROI: 100%
- Analysis: This option is appealing for long-term investors because of the significantly high premium relative to the moderate delta. While the risk of assignment is higher due to the elevated delta, the premium provides a buffer that compensates for this risk. A target price expected to increase by 5% should keep this OTM and the profit within reach.
In summary, the chosen options provide a spectrum of opportunities from near-term to long-term durations, balancing profitability and risk management. Each selection carefully considers the delta to minimize the likelihood of the options ending up in-the-money while optimizing the premium and potential profit, thus aligning with the strategic goal of maximizing returns while maintaining robust risk control.
Vertical Bear Put Spread Option Strategy
In crafting a vertical bear put spread for the SPDR S&P Homebuilders ETF (XHB), the goal is to profit from a decline in the stock price while still managing to limit the risk of having shares assigned. For this analysis, we need to identify an optimal combination of short and long put options, where the short puts have a higher strike price than the long puts and are also out-of-the-money to minimize the risk of share assignment. The forecasted stock price is expected to be 2% over or under the current stock price, which implies a moderately bearish outlook.
1. Near Term Strategy: Expiration Date: 2024-05-17
Short Put: Strike 87.0 - Delta: -0.027 - Gamma: 0.005 - Vega: 0.609 - Theta: -0.121 - Premium: $0.27 - ROI: 100% - Profit: $0.27
Long Put: Strike 135.0 - Delta: -0.731 - Gamma: 0.010 - Vega: 11.35 - Theta: -0.126 - Premium: $23.5 - ROI: 0.12 - Profit: $2.82 (estimated)
For the near term, a vertical bear put spread involving selling a put with a strike price of 87 and buying a put at 135 generates a premium while limiting risk. The risk of assignment is low because the short put's delta is relatively small, indicating it's out of the money.
2. Short Term Strategy: Expiration Date: 2024-05-24
Short Put: Strike 101.5 - Delta: -0.271 - Gamma: 0.035 - Vega: 5.837 - Theta: -0.151 - Premium: $0.63 - ROI: 100% - Profit: $0.63
Long Put: Strike 135.0 - Delta: -0.731 - Gamma: 0.010 - Vega: 11.35 - Theta: -0.126 - Premium: $23.5 - ROI: 0.12 - Profit: $2.82 (estimated)
A short-term strategy at expiration 2024-05-24 with a short put at a strike of 101.5 offers slightly higher premiums while maintaining good risk profiles. The delta of the short leg is higher compared to the near term, but it is still moderate, suggesting a low but not insignificant risk of assignment.
3. Medium Term Strategy: Expiration Date: 2024-06-21
Short Put: Strike 102.0 - Delta: -0.302 - Gamma: 0.031 - Vega: 11.99 - Theta: -0.046 - Premium: $1.25 - ROI: 100% - Profit: $1.25
Long Put: Strike 135.0 - Delta: -0.731 - Gamma: 0.010 - Vega: 11.35 - Theta: -0.126 - Premium: $23.5 - ROI: 0.12 - Profit: $2.82 (estimated)
The medium-term strategy with a strike price for the short leg at 102.0 delivers higher premiums, balancing risk and return. The delta indicates a greater but still manageable risk level.
4. Long Term Strategy: Expiration Date: 2024-12-20
Short Put: Strike 101.0 - Delta: -0.318 - Gamma: 0.015 - Vega: 29.50 - Theta: -0.014 - Premium: $4.70 - ROI: 100% - Profit: $4.70
Long Put: Strike 135.0 - Delta: -0.731 - Gamma: 0.010 - Vega: 11.35 - Theta: -0.126 - Premium: $23.5 - ROI: 0.12 - Profit: $2.82 (estimated)
For a long-term strategy, a vertical bear put spread with a short put at strike 101.0 and a long put at strike 135.0 has a higher upfront premium, leading to potentially higher profits. This strategy also exhibits a higher delta and vega, reflecting increased sensitivity to both stock price movements and changes in volatility.
5. Longest Term Strategy: Expiration Date: 2026-01-16
Short Put: Strike 100.0 - Delta: -0.297 - Gamma: 0.007 - Vega: 47.72 - Theta: -0.008 - Premium: $8.85 - ROI: 100% - Profit: $8.85
Long Put: Strike 135.0 - Delta: -0.731 - Gamma: 0.010 - Vega: 11.35 - Theta: -0.126 - Premium: $23.5 - ROI: 0.12 - Profit: $2.82 (estimated)
Choosing a longer-term option until 2026-01-16 involves a short put at a strike price of 100, providing a substantial premium and leveraging time decay efficiently. This option showcases a strong position if there's a belief in a steady decline over a more extended period.
Summary
These strategies balance short-term and long-term exposures to minimize the risk of assignment while maximizing potential profits. Each choice considers different levels of delta, gamma, vega, and theta to optimize the spread according to market conditions and expected movements. The objective is always to achieve the highest risk-adjusted return, with a specific focus on low risk of near-term assignment due to careful selection of out-of-the-money short puts.
Vertical Bull Put Spread Option Strategy
To craft the most profitable bull put spread strategy for the SPDR S&P Homebuilders ETF (XHB), it's crucial to minimize risks involved with options being assigned, particularly those that are deep in the money (ITM). The target stock price being either 2% over or under the current stock price positions us to focus on options with the optimal balance of rewards and mitigated assignment risk. Here, I'll provide five choices of vertical bull put spreads, ranging from near-term to long-term options, and analyze their profitability based on expiration dates and strike prices.
- Near-Term Option (Expiration Date: 2024-05-17):
- Short Leg: Strike Price $86.00
- Delta: -0.027278256
- Premium: $0.26
- Profit: $0.26
- Long Leg: Strike Price $85.00 (assuming a close-to-the-money option just below the short leg)
- Premium: Close to the price, similar delta to the comparison against risk.
This spread offers a high premium ($0.26) with low delta (-0.027278256), indicating limited chances of ending up ITM. This small delta minimizes the assignment risk while ensuring profitability as the target price maintains within 2% margin.
- Mid-Term Option (Expiration Date: 2024-05-24):
- Short Leg: Strike Price $104.00
- Delta: -0.3976720697
- Premium: $0.80
- Profit: $0.80
- Long Leg: Strike Price $103.00
- Premium: Close to the price, similar delta to the comparison against risk.
The spread constructed here offers a premium of $0.80, with a delta of -0.3976720697. The higher delta compared to the near-term option suggests moderate ITM risk but balanced with significant profitability.
- Mid to Long-Term Option (Expiration Date: 2024-05-31):
- Short Leg: Strike Price $96.50
- Delta: -0.166131897
- Premium: $0.74
- Profit: $0.74
- Long Leg: Strike Price $95.50
- Premium: Close to the price, similar delta to the comparison against risk.
This setup maximizes ROI while balancing risk with a moderate delta suggesting lesser chances of moving ITM and earning a premium of $0.74.
- Long-Term Option (Expiration Date: 2024-06-21):
- Short Leg: Strike Price $104.00
- Delta: -0.3916857951
- Premium: $1.61
- Profit: $1.61
- Long Leg: Strike Price $103.00
- Premium: Close to the price, similar delta to the comparison against risk.
A long-term bull put spread provides substantial profitability ($1.61) with a balanced delta of -0.3916857951. Despite the extended expiration period, it secures profitability within+/-2% price margin.
- Extra Long-Term Option (Expiration Date: 2025-01-17):
- Short Leg: Strike Price $105.00
- Delta: -0.376971109
- Premium: $6.45
- Profit: $5.869
- Long Leg: Price Slightly Below for Consideration
- Premium: Close to the price, similar delta to the comparison against risk.
Opting for an extra-long term expiration ensures significant profit potential. It aligns with profitability of $6.45 and delta weathers the ITM movement compared to short-dated options.
In conclusion, vertical bull put spreads for XHB across varying expiration horizons have options balancing profitability and assignment risks, adaptable to different trading tenures. Near and mid-term setups offer conservative risk-balanced spreads, while long-term options hedge the intrinsic value leveraging future volatilities as passive profitability gears. The chosen options address optimal balance, falling comfortably within the 2% fluctuation boundary ensuring minimum risk of assignment while securing attractive premiums.
Vertical Bear Call Spread Option Strategy
Analysis of Vertical Bear Call Spread Options Strategy for SPDR S&P Homebuilders ETF (XHB)
In crafting a profitable vertical bear call spread, also known as a bear call credit spread, you aim to sell a call option at a lower strike price and buy another call option at a higher strike price. This strategy is typically used when you anticipate the underlying stock will not rise above the strike price of the short call by expiration, aiming to profit from time decay (theta) while limiting potential losses.
Given the requirement to minimize the risk of having shares assigned, which occurs when the short call option is exercised, we need to strategically choose options that are close to the current price with high theta and relatively lower delta values, as the latter indicates the likelihood of the option expiring in the money (ITM).
Here are five strategic choices for different expiration periods:
1. Near-Term Strategy (Expiration: 2024-05-17)
- Short Call:
- Strike Price: 90.0
- Delta: 0.9896
- Theta: -0.0473
- Premium: $17.81
- ROI: 19.04%
- Profit: $3.39
- Long Call:
- Strike Price: 93.0
- Delta: 0.9575
- Theta: -0.1412
- Premium: $14.40
- ROI: 20.70%
- Profit: $2.98
Analysis: For a very short-term horizon, the most profitable vertical bear call spread involves selling the 90.0 strike call and buying the 93.0 strike call. The high ROI and substantial theta erosion (of the short call) benefits your position as the options approach expiration.
2. Short-Mid-Term Strategy (Expiration: 2024-05-24)
- Short Call:
- Strike Price: 103.0
- Delta: 0.6460
- Theta: -0.2252
- Premium: $4.50
- ROI: 68.47%
- Profit: $3.08
- Long Call:
- Strike Price: 106.0
- Delta: 0.5453
- Theta: -0.2189
- Premium: $2.32
- ROI: 100%
- Profit: $2.32
Analysis: For a slightly longer duration, using strikes at 103.0 and 106.0 can yield an impressive ROI while maintaining a controlled risk profile. The delta values indicate a moderate likelihood of the options to expire ITM, but theta heavily favors this strategy as both options decay rapidly.
3. Mid-Term Strategy (Expiration: 2024-05-31)
- Short Call:
- Strike Price: 103.0
- Delta: 0.6542
- Theta: -0.1283
- Premium: $5.40
- ROI: 73.72%
- Profit: $3.98
- Long Call:
- Strike Price: 106.0
- Delta: 0.5483
- Theta: -0.1373
- Premium: $3.09
- ROI: 100%
- Profit: $3.09
Analysis: Mid-term options strike a balance between high theta decay and manageable delta values. The chosen strikes at 103.0 and 106.0 capture a higher ROI with significant theta values underscoring time decay as the expiration nears.
4. Intermediate-Term Strategy (Expiration: 2024-06-21)
- Short Call:
- Strike Price: 100.0
- Delta: 0.7073
- Theta: -0.0773
- Premium: $9.02
- ROI: 51.00%
- Profit: $4.60
- Long Call:
- Strike Price: 103.0
- Delta: 0.6392
- Theta: -0.0772
- Premium: $6.00
- ROI: 76.35%
- Profit: $4.58
Analysis: This intermediate-term strategy optimizes profitability with enough time decay to avoid significant risk from underlying price movements. Selecting 100.0 and 103.0 strikes ensures a robust ROI with a a lower risk of the short call being exercised.
5. Long-Term Strategy (Expiration: 2024-09-20)
- Short Call:
- Strike Price: 89.0
- Delta: 0.7844
- Theta: -0.0308
- Premium: $16.35
- ROI: 20.37%
- Profit: $3.33
- Long Call:
- Strike Price: 92.0
- Delta: 0.7649
- Theta: -0.0429
- Premium: $15.02
- ROI: 17.31%
- Profit: $2.60
Analysis: For a longer horizon, we look to mitigate the risk of assignments with higher delta but still benefit from theta decay. Selecting strikes at 89.0 and 92.0 helps maintain profitability while allowing ample time for position adjustments or rollovers if necessary.
By carefully choosing the appropriate strikes and expiration dates, the vertical bear call spread options strategy can be highly effective, balancing profitability against potential risk of assignment. These five strategies span different time frames, each tailored to optimize for the highest return on investment while controlling for risk.
Vertical Bull Call Spread Option Strategy
To analyze the most profitable vertical bull call spread options strategy for the SPDR S&P Homebuilders ETF (XHB), focusing on minimizing assignment risk and targeting a stock price of 2% over or under the current price, we can select an appropriate set of option pairs from the options chain data. Here, we consider five choices spanning near-term to long-term expiration dates.
1. Near-Term Strategy (Expiring May 24, 2024)
Long Call: Strike 102.0, Expire May 24, 2024
- Delta: 0.664
- Gamma: 0.0276
- Vega: 6.430
- Theta: -0.2481
- Rho: 1.725
- Premium: $5.41
Short Call: Strike 105.0, Expire May 24, 2024
- Delta: 0.581
- Gamma: 0.0354
- Vega: 6.889
- Theta: -0.2225
- Rho: 1.553
- Premium: $3.20
This strategy constructs a vertical bull call spread. By buying the 102.0 strike call and selling the 105.0 strike call, we benefit if the stock price increases to and slightly beyond $105.0. The net premium is $2.21 ($5.41 - $3.20), and the potential maximum profit is $2.79 (the difference between the strikes, minus the net premium), without the risk of having shares assigned since the short call is only slightly out of the money.
2. Mid-Term Strategy (Expiring May 31, 2024)
Long Call: Strike 102.0, Expire May 31, 2024
- Delta: 0.682
- Gamma: 0.0307
- Vega: 8.197
- Theta: -0.1296
- Rho: 3.047
- Premium: $6.17
Short Call: Strike 105.0, Expire May 31, 2024
- Delta: 0.580
- Gamma: 0.0315
- Vega: 8.988
- Theta: -0.1494
- Rho: 2.606
- Premium: $3.64
This approach involves buying the 102.0 strike call and selling the 105.0 strike call. The net premium is $2.53 ($6.17 - $3.64), with a potential profit of $2.47. This strategy balances a higher delta and relatively higher vega, providing a smoother ride on volatility changes while keeping assignment risk low.
3. Mid-Term Strategy 2 (Expiring June 21, 2024)
Long Call: Strike 99.0, Expire June 21, 2024
- Delta: 0.720
- Gamma: 0.0205
- Vega: 11.570
- Theta: -0.0809
- Rho: 6.832
- Premium: $9.50
Short Call: Strike 102.0, Expire June 21, 2024
- Delta: 0.657
- Gamma: 0.0237
- Vega: 12.639
- Theta: -0.0826
- Rho: 6.364
- Premium: $3.95
With this strategy, purchasing the 99.0 strike call and selling the 102.0 strike call results in a net premium of $5.55 ($9.50 - $3.95). This provides a maximum profit of $2.45 should the stock hit $102.0 by expiration. This strategy carries some assignment risk due to the deeper in-the-money long call.
4. Long-Term Strategy (Expiring September 20, 2024)
Long Call: Strike 95.0, Expire September 20, 2024
- Delta: 0.729
- Gamma: 0.0100
- Vega: 27.393
- Theta: -0.0320
- Rho: 34.404
- Premium: $17.23
Short Call: Strike 98.0, Expire September 20, 2024
- Delta: 0.688
- Gamma: 0.0138
- Vega: 22.396
- Theta: -0.0423
- Rho: 20.627
- Premium: $11.99
In this instance, buying the 95.0 strike call and selling the 98.0 strike call costs a net premium of $5.24 ($17.23 - $11.99), with a maximum potential profit of $1.76. This strategy keeps the options deep in-the-money but mitigates the assignment risk by keeping the short call slightly out-of-the-money.
5. Extended-Term Strategy (Expiring January 17, 2025)
Long Call: Strike 100.0, Expire January 17, 2025
- Delta: 0.676
- Gamma: 0.0053
- Vega: 47.766
- Theta: -0.0238
- Rho: 72.804
- Premium: $17.50
Short Call: Strike 105.0, Expire January 17, 2025
- Delta: 0.664
- Gamma: 0.0075
- Vega: 50.287
- Theta: -0.0204
- Rho: 79.482
- Premium: $16.87
Buying the 100.0 strike call and selling the 105.0 strike call results in a net premium of $0.63 ($17.50 - $16.87), with a potential profit of $4.37. The closer delta values and robust longer-term expiring options provide ample time for market conditions to improve.
Conclusion
In summary, the most suitable vertical bull call spread options strategies are selected based on their net premiums, potential profits, and management of assignment risks. These strategies balance profitability with the need to avoid assignments by choosing slightly out-of-the-money calls and extending varying expiration dates from near-term to extended long-term.
Similar Companies in Asset Management:
iShares U.S. Home Construction ETF (ITB), SPDR S&P Retail ETF (XRT), Materials Select Sector SPDR Fund (XLB), Industrial Select Sector SPDR Fund (XLI), SPDR S&P Metals and Mining ETF (XME), Invesco Dynamic Building & Construction ETF (PKB), First Trust NASDAQ ABA Community Bank ETF (QABA), SPDR S&P Construction & Materials ETF (XCM), Global X Funds Global X MSCI SuperDividend EAFE ETF (EFAS), Invesco MSCI Global Timber ETF (CUT)
https://finance.yahoo.com/video/homebuilder-stocks-close-lower-weak-202558231.html
https://seekingalpha.com/article/4685242-xhb-3-negatives-and-2-positives-for-home-builders
https://www.etftrends.com/innovative-etfs-channel/new-home-sales-jump-8-8-march-2024/
Copyright © 2024 Tiny Computers (email@tinycomputers.io)
Report ID: iiDxfn
Cost: $0.48694
https://reports.tinycomputers.io/XHB/XHB-2024-05-13.html Home