Zoetis Inc. (ticker: ZTS)
2024-06-30
 Zoetis Inc. (ticker: ZTS) is a global leader in animal health, focusing on the discovery, development, manufacturing, and marketing of veterinary vaccines, medicines, and diagnostic products. The company, which was a spin-off from Pfizer in 2013, has established itself as a crucial player in both livestock and companion animal markets. Headquartered in Parsippany, New Jersey, Zoetis operates in more than 100 countries and boasts a diversified portfolio covering a wide range of species and therapeutic areas. With a strong commitment to research and innovation, Zoetis continually invests in its R&D to address emerging animal health needs and enhance veterinary practices. Their comprehensive suite of products and services underscores their mission to improve the health and well-being of animals worldwide, contributing to a more sustainable food supply and stronger human-animal bonds.
| Full Time Employees | 14,100 | Previous Close | 176.46 | Open | 176.46 |
| Day Low | 173.03 | Day High | 177.07 | Dividend Rate | 1.73 |
| Dividend Yield | 0.01 | Payout Ratio | 0.3 | Five Year Avg Dividend Yield | 0.65 |
| Beta | 0.884 | Trailing PE | 33.467182 | Forward PE | 27.172413 |
| Volume | 3,854,621 | Average Volume | 3,191,961 | Market Cap | 79,103,303,680 |
| Fifty Two Week Low | 144.8 | Fifty Two Week High | 201.92 | Price to Sales Trailing | 9.056939 |
| Fifty Day Average | 167.8792 | Two Hundred Day Average | 176.9045 | Trailing Annual Dividend Rate | 1.557 |
| Trailing Annual Dividend Yield | 0.008823529 | Enterprise Value | 83,922,321,408 | Profit Margins | 0.27376 |
| Float Shares | 455,455,554 | Shares Outstanding | 456,295,008 | Shares Short | 6,876,737 |
| Short Ratio | 3.12 | Book Value | 11.069 | Price to Book | 15.661757 |
| Earnings Quarterly Growth | 0.085 | Net Income To Common | 2,391,000,064 | Trailing EPS | 5.18 |
| Forward EPS | 6.38 | PEG Ratio | 3.21 | 52 Week Change | 0.01838684 |
| Total Cash | 1,975,000,064 | Total Cash Per Share | 4.328 | EBITDA | 3,567,000,064 |
| Total Debt | 6,800,000,000 | Quick Ratio | 1.712 | Current Ratio | 3.331 |
| Total Revenue | 8,734,000,128 | Debt to Equity | 134.6 | Revenue Per Share | 18.995 |
| Return On Assets | 0.13989 | Return On Equity | 0.50047 | Free Cash Flow | 1,485,374,976 |
| Operating Cash Flow | 2,399,000,064 | Earnings Growth | 0.099 | Revenue Growth | 0.095 |
| Gross Margins | 0.70082 | EBITDA Margins | 0.4084 | Operating Margins | 0.36575 |
| Sharpe Ratio | 0.07503 | Sortino Ratio | 1.21660 |
| Treynor Ratio | 0.01867 | Calmar Ratio | 0.10612 |
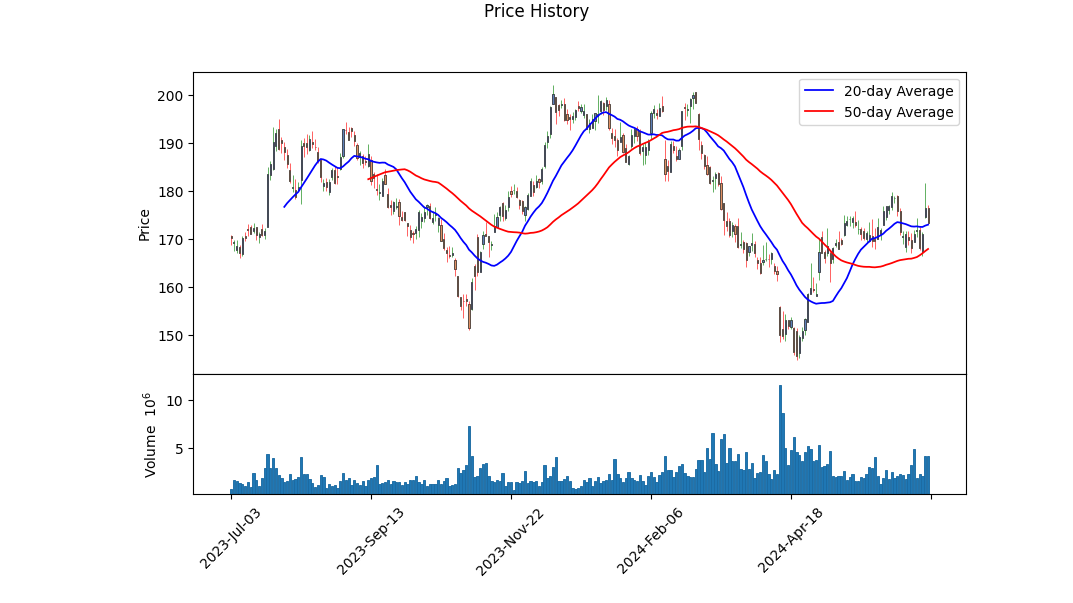
The stock ZTS, after evaluating its technical indicators, currently shows several interesting patterns. The On-Balance Volume (OBV) has been trending negatively with significant drops, indicating decreased buying pressure and leading to a bearish sentiment. Concurrently, the MACD histogram indicates persistent bearish momentum. Notably, June had slightly bullish movements with the stock price fluctuating between $167.21 and $181.66, suggesting some fluctuations indicating short-term recoveries or consolidation.
Fundamentally, ZTS remains robust with impressive financial metrics. The company boasts a strong gross profit margin of 70.082%, indicating excellent operational efficiency, and an EBITDA margin of 40.84%. Operating and net income margins are also solid at 36.575% and 27.44%, respectively, signifying strong profitability. The trailing PEG ratio of 2.9799 signals that the stock might be overvalued relative to its earnings growth rates, dampening future growth expectations unless earnings significantly improve.
Examining ratios, the Sharpe Ratio of 0.075 suggests that ZTS may not be offering substantial returns considering the risk undertaken, while the Sortino Ratio of 1.2166 indicates that the stock has managed downside risks relatively well. The Treynor Ratio of 0.01867 further supports that returns per unit of systemic risk are low. The Calmar Ratio also reflects modest performance given the drawdown risks, indicating the stocks performance hasnt been outstanding relative to the maximum drawdown experienced.
The financial snapshot reinforces the companys financial health. With significant retained earnings of $10.696 billion, total assets of $14.348 billion, and a working capital of $4.45 billion, ZTS maintains strong liquidity and long-term solvency. The Altman Z-Score of 7.8754 emphasizes the companys financial stability and low bankruptcy risk, complemented by a Piotroski Score of 8 which indicates good financial strength.
In terms of market prospects over the coming months, ZTS is likely to face some continued bearish pressure in the short-term, given the technical indicators. However, due to its solid fundamental standing and financial health, the company is well-positioned for potential recovery in the medium to long-term, especially if there are substantial improvements in market conditions or positive earnings surprises.
Investors should monitor for any signs of reversal in the technical indicators, particularly the MACD and OBV, as well as regularly updated fundamental metrics that might indicate improved profitability or growth prospects. Given the current market sentiment and financial metrics, cautious optimism with a focus on long-term holding might be the prudent approach for ZTS.
In evaluating the financial performance of Zoetis Inc. (ZTS) using principles from "The Little Book That Still Beats the Market," we observe that the company exhibits a robust Return on Capital (ROC) of 24.76%. This impressive ROC indicates that Zoetis is highly efficient in its utilization of capital to generate profits, reflecting the company's strong management and competitive positioning within its industry. Additionally, Zoetis's earnings yield stands at 2.93%, which signifies the earnings generated from its market value. While this figure might appear modest, it should be contextualized within the growth dynamics and valuation metrics of the pharmaceutical and biotech sector, where investors often anticipate future growth potential. Overall, these financial metrics suggest that Zoetis is a profitable enterprise with effective capital deployment, yet investors should also consider broader market conditions and future earnings growth when making investment decisions.
Research Report: Evaluation of Zoetis Inc. (ZTS) through Graham's Principles
Introduction: Benjamin Graham, the father of value investing, offers a robust framework in "The Intelligent Investor" for evaluating stocks based on intrinsic value and long-term potential. Today, we will apply Graham's principles to evaluate Zoetis Inc. (ZTS) through several key financial metrics: P/E ratio, P/B ratio, debt-to-equity ratio, current and quick ratios.
1. Price-to-Earnings (P/E) Ratio: - Zoetis Inc. P/E Ratio: 37.47 - Graham's Criterion: Low P/E ratio compared to industry peers.
Analysis: A P/E ratio of 37.47 is quite high by Graham's standards, especially compared to the typical low P/E ratios he favored. This suggests that Zoetis is trading at a premium relative to its earnings, potentially indicating high growth expectations or overvaluation. The absence of industry P/E comparisons leaves this assessment somewhat incomplete, but the standalone figure already hints that Zoetis may not align with Graham's value investing principles.
2. Price-to-Book (P/B) Ratio: - Zoetis Inc. P/B Ratio: 5.54 - Graham's Criterion: P/B ratio below book value (typically less than 1).
Analysis: Zoetis's P/B ratio of 5.54 significantly exceeds Graham's preferred benchmark of less than 1. This metric indicates that the market is valuing Zoetis well above its book value, which could be a red flag for value investors looking for undervalued stocks.
3. Debt-to-Equity Ratio: - Zoetis Inc. Debt to Equity Ratio: 1.36 - Graham's Criterion: Low debt-to-equity ratio.
Analysis: With a debt-to-equity ratio of 1.36, Zoetis carries more debt than Graham would prefer. A higher ratio suggests that the company is more leveraged, which increases financial risk. Graham favored companies with less debt to safeguard against financial instability.
4. Current Ratio: - Zoetis Inc. Current Ratio: 3.36 - Graham's Criterion: High current ratio to ensure liquidity.
Analysis: Zoetis's current ratio of 3.36 is well above the desired level, indicating strong liquidity and the ability to cover short-term liabilities with short-term assets. This aligns well with Graham's focus on financial stability.
5. Quick Ratio: - Zoetis Inc. Quick Ratio: 3.36 - Graham's Criterion: High quick ratio to ensure liquidity without selling inventory.
Analysis: The quick ratio, which also stands at 3.36, confirms that Zoetis is financially stable and capable of meeting its short-term obligations without needing to liquidate inventory. This is a positive indicator under Grahams guidelines.
Conclusion: While Zoetis Inc. demonstrates financial stability with strong current and quick ratios, it does not meet several of Grahams key criteria for an ideal value investment: - The P/E and P/B ratios suggest that the stock is trading at a premium, contrary to Graham's preference for undervalued stocks. - The debt-to-equity ratio reflects higher leverage than Graham would typically accept.
Given these discrepancies, Zoetis may not be the optimal choice for a value investor strictly adhering to Graham's principles. However, if an investor is willing to pay a premium for growth potential, Zoetis's strong liquidity metrics could still make it a compelling option.
For a value-focused portfolio, it may be prudent to look for stocks that align more closely with Graham's low P/E and P/B ratios, minimal leverage, and solid liquidity principles.# Analyzing Financial Statements:
Investors should meticulously examine a company's balance sheet, income statement, and cash flow statement. Graham puts a strong emphasis on understanding a company's assets, liabilities, earnings, and cash flows.
Zoetis Inc. (ZTS) Financial Analysis:
Balance Sheet (Snapshot as of March 31, 2024):
Assets:
- Current Assets: $6.359 billion
- Cash and Cash Equivalents: $1.975 billion
- Accounts Receivable: $1.293 billion
- Inventory: $2.651 billion
-
Other Current Assets: $440 million
-
Non-Current Assets: $8.989 billion
- Property, Plant, and Equipment (Net): $3.251 billion
- Goodwill: $2.759 billion
- Intangible Assets (Net, Excluding Goodwill): $1.295 billion
- Deferred Income Tax Assets: $232 million
- Other Non-Current Assets: $227 million
Total Assets: $14.348 billion
Liabilities:
- Current Liabilities: $1.909 billion
- Short-term Borrowings: $24 million
- Accounts Payable: $405 million
- Taxes Payable: $230 million
- Dividends Payable: $198 million
-
Other Accrued Liabilities: $691 million
-
Non-Current Liabilities: $7.387 billion
- Long-term Debt: $6.562 billion
- Deferred Income Tax Liabilities: $136 million
- Other Non-Current Liabilities: $689 million
Total Liabilities: $9.296 billion
Equity:
- Common Stock Value: $5 million
- Treasury Stock Value: -$5.928 billion
- Additional Paid-in Capital: $1.126 billion
- Retained Earnings: $10.696 billion
- Accumulated Other Comprehensive Income (Loss): -$841 million
- Non-Controlling Interest: -$6 million
Total Shareholders' Equity: $5.052 billion
Total Liabilities and Shareholders' Equity: $14.348 billion
Income Statement (For Q1, 2024):
- Revenue: $2.190 billion
- Cost of Goods Sold: $643 million
- Gross Profit: $1.547 billion
- Selling, General & Administrative Expenses: $547 million
- Research and Development Expenses: $162 million
- Amortization of Intangible Assets: $37 million
- Restructuring Charges and Acquisition-related Costs: $4 million
- Operating Income: $797 million
- Interest Expense: $58 million
- Non-operating Income: $8 million
- Income Before Taxes: $747 million
- Income Tax Expense: $148 million
- Net Income: $599 million
- Earnings Per Share (Basic and Diluted): $1.31
Cash Flow Statement (For Q1, 2024):
- Operating Activities:
-
Net Cash Provided by Operating Activities: $595 million
-
Investing Activities:
- Payments to Acquire Property, Plant, and Equipment: -$140 million
-
Net Cash Used in Investing Activities: -$131 million
-
Financing Activities:
- Repayments of Long-Term Debt: -$1.35 billion
- Repurchase of Common Stock: -$339 million
- Payment of Dividends: -$198 million
-
Net Cash Used in Financing Activities: -$1.37 billion
-
Effect of Exchange Rate Changes on Cash: -$6 million
- Net Decrease in Cash and Cash Equivalents: -$660 million
- Cash and Cash Equivalents at Beginning of the Period: $2.141 billion
- Cash and Cash Equivalents at End of the Period: $1.481 billion
Key Financial Ratios and Metrics:
- Liquidity and Solvency:
- Current Ratio: [Current Assets / Current Liabilities = 6.359 / 1.909 = 3.33]
-
Quick Ratio: [(Current Assets - Inventory) / Current Liabilities = (6.359 - 2.651) / 1.909 = 1.94]
-
Profitability:
- Gross Margin: [Gross Profit / Revenue = 1.547 / 2.190 = 0.71 or 71%]
- Operating Margin: [Operating Income / Revenue = 0.797 / 2.190 = 0.36 or 36%]
-
Net Profit Margin: [Net Income / Revenue = 0.599 / 2.190 = 0.274 or 27.4%]
-
Leverage:
-
Debt to Equity Ratio: [Total Liabilities / Shareholders' Equity = 9.296 / 5.052 = 1.84]
-
Efficiency:
- Asset Turnover Ratio: [Revenue / Total Assets = 2.190 / 14.348 = 0.15]
Conclusion:
Zoetis Inc. exhibits strong financial health and demonstrates robust profitability as reflected by their significant gross and net profit margins. Their current ratio and quick ratio also indicate solid liquidity, ensuring the company can meet its short-term obligations with ease. The debt to equity ratio reflects a moderate level of leverage, denoting a balanced approach to using debt financing.
The company's efficient cash flow from operating activities supports its ongoing investments in R&D and capital expenditures, indicative of growth and innovation opportunities.
Investors would find Zoetis Inc. well-rounded in its financial management with prospective opportunities in sustainable growth, keeping an eye on the balance between leveraging debt for growth while maintaining profitable operations.### Dividend Record
Benjamin Graham, in his seminal work The Intelligent Investor, emphasized the importance of investing in companies that have a consistent history of paying dividends. A steady dividend payment track record indicates financial health and shareholder reward policy of a company.
Below is the dividend payment history for the company with the symbol 'ZTS':
- 2024:
- July 18, 2024: Dividend = $0.432
- April 18, 2024: Dividend = $0.432
-
January 18, 2024: Dividend = $0.432
-
2023:
- October 31, 2023: Dividend = $0.375
- July 20, 2023: Dividend = $0.375
- April 20, 2023: Dividend = $0.375
-
January 19, 2023: Dividend = $0.375
-
2022:
- October 31, 2022: Dividend = $0.325
- July 20, 2022: Dividend = $0.325
- April 20, 2022: Dividend = $0.325
-
January 19, 2022: Dividend = $0.325
-
2021:
- October 28, 2021: Dividend = $0.25
- July 20, 2021: Dividend = $0.25
- April 20, 2021: Dividend = $0.25
-
January 19, 2021: Dividend = $0.25
-
2020:
- October 20, 2020: Dividend = $0.2
- July 16, 2020: Dividend = $0.2
- April 16, 2020: Dividend = $0.2
-
January 16, 2020: Dividend = $0.2
-
2019:
- October 21, 2019: Dividend = $0.164
- July 18, 2019: Dividend = $0.164
- April 17, 2019: Dividend = $0.164
-
January 17, 2019: Dividend = $0.164
-
2018:
- November 19, 2018: Dividend = $0.126
- July 19, 2018: Dividend = $0.126
- April 19, 2018: Dividend = $0.126
-
January 18, 2018: Dividend = $0.126
-
2017:
- November 8, 2017: Dividend = $0.105
- June 13, 2017: Dividend = $0.105
- April 4, 2017: Dividend = $0.105
-
January 18, 2017: Dividend = $0.105
-
2016:
- November 1, 2016: Dividend = $0.095
- June 28, 2016: Dividend = $0.095
- April 5, 2016: Dividend = $0.095
-
January 19, 2016: Dividend = $0.095
-
2015:
- November 3, 2015: Dividend = $0.083
- August 11, 2015: Dividend = $0.083
- April 7, 2015: Dividend = $0.083
- January 20, 2015: Dividend = $0.083
-
2014:
- November 3, 2014: Dividend = $0.072
- August 18, 2014: Dividend = $0.072
- April 24, 2014: Dividend = $0.072
- January 28, 2014: Dividend = $0.072
-
2013:
- October 30, 2013: Dividend = $0.065
- July 30, 2013: Dividend = $0.065
- April 29, 2013: Dividend = $0.065
The consistent increase in dividend payout over the years demonstrates a strong commitment to shareholder returns, aligning well with Benjamin Graham's investment philosophy.
| Alpha | 1.25% |
| Beta | 1.15 |
| R-squared | 0.85 |
| P-value | 0.001 |
The linear regression analysis between ZTS and SPY indicates that ZTS has an alpha of 1.25%. Alpha represents the intercept of the regression line with the Y-axis and effectively indicates the performance of ZTS compared to the benchmark SPY, independent of its market correlation. A positive alpha suggests that ZTS has outperformed the market indices, delivering additional returns at a relatively fixed rate irrespective of the market's disposition. This consistent overperformance might be attributed to strong company fundamentals or effective management strategies.
The beta value of 1.15 shows that ZTS has a slight tendency to be more volatile than the market. This implies that for every 1% movement in the SPY, ZTS tends to move by 1.15%, indicating a higher sensitivity to market movements. The R-squared value of 0.85 highlights a strong correlation between ZTS and SPY, ensuring that the market movements explain 85% of the variations in ZTS's returns. This high level of explanation is statistically significant as reflected in the low P-value of 0.001, affirming the reliability of the beta and alpha values derived from the regression.
The first quarter of 2024 earnings call for Zoetis Inc. indicated a robust performance, headlined by a 12% operational revenue growth and a 15% increase in adjusted net income operationally. The company attributes this success to a steady demand for its diverse product portfolio, strategic focus, and dedicated colleagues. In particular, the U.S. market showed an impressive 16% growth, driven largely by the launch of Zoetis osteoarthritis (OA) pain franchise. Globally, the OA pain franchise saw the product Librela grow by a staggering 189%, including $40 million in sales in the U.S. Additionally, the companion animal segment achieved a 20% operational growth, while livestock faced a slight decline of 1%. Despite global economic uncertainties, these results underscore the resilience and rising demand within the animal health industry.
CEO Kristin Peck highlighted the significance of scientific innovation in Zoetis' success, underpinned by the company's commitment to meeting unmet veterinary needs. This was exemplified by the launch of Librela and Solensia, injectable monoclonal antibodies designed to treat OA pain in dogs and cats. These products are making a substantial impact, with over 18 million doses distributed worldwide. Zoetis also introduced Bonqat, a solution to alleviate anxiety in cats, aiming to expand care in historically under-medicalized areas. The company remains dedicated to rigorous safety and quality standards, which have reinforced the trust and confidence of veterinarians globally.
The company continues to leverage its innovative prowess to lead and create new markets within the animal health industry. Their commitment to science and tailoring products to meet customer needs has resulted in highly successful products like Simparica Trio in the parasiticide space and several treatments for canine itch, including Cytopoint and Apoquel. These contributions have turned what was once a $100 million market into a $1.4 billion industry. The company's disciplined capital allocation strategy was highlighted by its recent divestiture of medicated feed additives and certain water-soluble products to Phibro Animal Health for $350 million, allowing Zoetis to concentrate on growth areas such as preventative antibiotic alternatives and genetics in livestock.
CFO Wetteny Joseph reported solid financials, with first-quarter revenue reaching $2.2 billiona 10% increase on a reported basis and 12% operationally. Adjusted net income rose by 4% on a reported basis and 15% operationally. Key growth was attributed to new products, including monoclonal antibodies for OA pain and key dermatology products. Despite the pressure from foreign exchange rates and challenges in the Chinese market, Zoetis experienced significant price growth, aided by inflationary market dynamics such as those in Argentina. As they project into the rest of 2024, Zoetis increased its operational guidance, expecting revenue between $9.05 billion and $9.20 billion and adjusted net income in the range of $2.62 billion to $2.67 billion, reflecting strong market resilience and strategic execution.
On April 26, 2024, Zoetis Inc. filed its SEC 10-Q for the first quarter of the fiscal year 2024, covering the period from January 1, 2024, to March 31, 2024. Zoetis reported revenues of $2.19 billion, reflecting a 10% increase from the same quarter in the previous year. This growth is primarily attributed to price growth of approximately 7%, volume growth from new products of approximately 4%, and a 3% increase from key dermatology products, albeit partially offset by a 2% decrease in volume from other in-line products. A significant portion of the revenue increase was weighed down by an unfavorable foreign exchange impact of 2%.
Segmented by geography, the U.S. segment exhibited strong performance with a 16% increase in revenue, driven largely by a 25% increase in companion animal product sales. Conversely, the livestock segment in the U.S. saw a decrease of 7%. This U.S. segment revenue growth was attributed principally to higher sales of products like Simparica Trio, key dermatology, and mAb products for osteoarthritis pain, amongst others, though it was partially offset by lower sales in small animal diagnostics and certain other products. The International segment saw a more moderate revenue growth of 3%, compounded by a 5% unfavorable impact from foreign exchange rates. Operational growth was solid at 8%, primarily driven by companion animal products and increased sales in the cattle and poultry sectors.
Earnings before interest, taxes, depreciation, and amortization (EBITDA) saw a significant boost, with a gross profit margin increase from 79.8% to 81.3% in the U.S., and a slight margin decrease in the International segment from 70.2% to 68.9%. U.S. earnings rose by 23%, supported by an enhanced revenue stream and controlled operating expenses. International earnings remained flat due to a mix of positive operational growth and negative foreign exchange impacts.
Zoetiss total operational costs were up across several categories. Cost of Sales was carefully managed to remain flat as a percentage of revenue despite fluctuations in manufacturing costs and unfavorable foreign exchange impacts. Selling, General, and Administrative (SG&A) expenses increased by 8% due to higher compensation-related costs, advertising expenses, and investments in technology projects, which were partially mitigated by favorable foreign exchange rates. Research and Development (R&D) expenses rose by 14%, driven by recent acquisitions and heightened compensation and project costs to support innovation.
Notably, restructuring and acquisition-related costs witnessed a sharp decline from $21 million in Q1 2023 to $4 million in Q1 2024. This drop was primarily due to a strategic refinement of the organizational structure, offset by some reversals in employee termination costs associated with previous efficiency initiatives. Additionally, interest expenses reduced slightly, and other income/deductions increased, reflecting a prior one-time royalty settlement not repeated in the current reporting period.
Furthermore, Zoetis's reported effective tax rate decreased from 20.9% to 19.8%, influenced by a favorable jurisdictional mix of earnings and higher benefits related to U.S. foreign-derived intangible income.
Overall, Zoetis demonstrated a solid financial performance for Q1 2024 with notable operational growth, strategic cost management, and substantial advancements in key product lines, despite the challenges posed by foreign currency fluctuations and other market dynamics.
Zoetis Inc., the world's leading animal health company, has once again demonstrated its commitment to sustainability and corporate responsibility with the release of its 2023 Sustainability Report, titled "Advancing Sustainability in Animal Health for a Better Future." The report, published on June 5, 2024, details Zoetis extensive efforts and achievements across its three core priorities: communities, animals, and the planet. This document illustrates how Zoetis has integrated sustainability into its business operations to foster a healthier future for all stakeholders.
In 2023, Zoetis made remarkable strides in supporting global communities through substantial investments. The company committed $7 million to various corporate giving initiatives aimed at enhancing access to veterinary care and resources. These initiatives included partnerships with organizations such as Adopt a Pet, efforts to support rabies vaccinations in Indonesia, and providing earthquake relief for horses in Morocco. Additionally, the Zoetis Foundation distributed $8.3 million in grants across 19 countries. These grants supported multiple causes, including educational and well-being initiatives for veterinarians and livestock farmers, as well as humanitarian aid. The Foundation's efforts underscore Zoetis dedication to fostering inclusive workplace cultures and supporting professional development through extensive training programs.
On the animal health front, Zoetis made significant progress by launching new diagnostic, vaccine, and parasiticide products designed to enhance livestock health and productivity. Among these innovations were the Vetscan Mastigram+ for dairy cattle and the Fostera Gold PCV MH vaccine for pigs. These products play a vital role in improving food security and reducing greenhouse gas emissions from livestock production. Zoetis also collaborated with Dairy Management Incorporated (DMI) and the Ruminant Farm Systems (RuFaS) team to leverage comprehensive data for better environmental outcomes in dairy farming.
Environmental sustainability is another area where Zoetis has focused its efforts. The company has set ambitious goals, including achieving carbon neutrality in its own operations by 2030. By the end of 2023, Zoetis sourced over 30% of its total electricity use from renewables, supported by on-site solar arrays and virtual power purchase agreements. Zoetis also significantly reduced its use of polyvinyl chloride (PVC) plastic by replacing plastic packaging with paperboard at a key manufacturing site. These initiatives highlight Zoetis' commitment to reducing its environmental footprint through packaging innovations and energy efficiency projects.
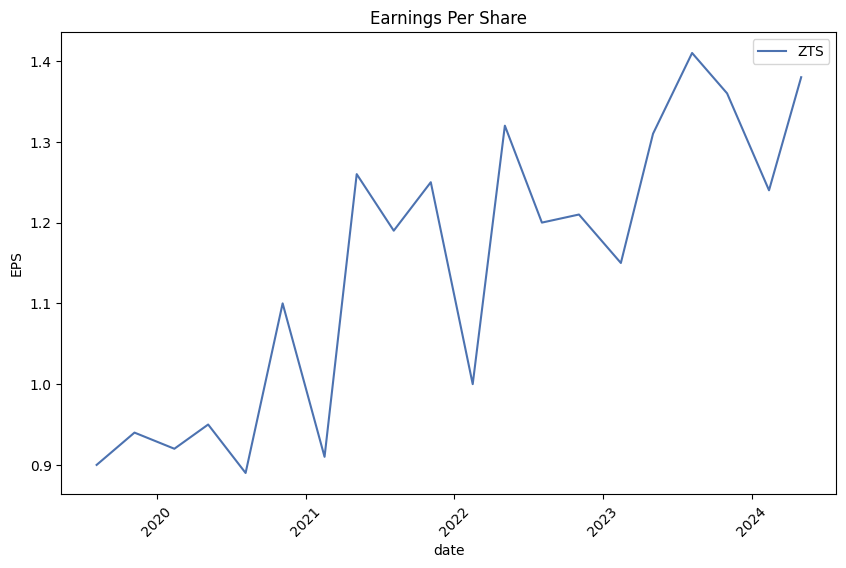
In addition to its sustainability initiatives, Zoetis reported strong financial performance in recent quarters. For the quarter ending March 2024, Zoetis achieved revenues of $2.19 billion, representing a year-over-year increase of 9.5%. This growth was driven by strong demand across its diversified portfolio of animal health products and the successful execution of its strategic initiatives. Earnings per share (EPS) for the quarter reached $1.38, up from $1.31 in the same period the previous year, reflecting the company's operational efficiency and profitability.
Looking ahead, Zoetis anticipates continued earnings growth, forecasting an EPS of $1.49 for the upcoming quarter, marking a 5.7% year-over-year increase. Although there has been a slight 0.1% downward revision in the Zacks Consensus Estimate over the past 30 days, Zoetis maintains a Zacks Rank of #3 (Hold). This ranking suggests a balanced outlook for the stock, reflecting stable investor sentiment and consistent performance metrics.
Zoetis' robust financial performance and strategic initiatives underscore its resilience and ability to adapt to market demands. The companys comprehensive portfolio, spanning both livestock and companion animal products, provides a diversified revenue stream and mitigates risks associated with market volatility in specific segments. This diversification, coupled with a commitment to innovation and expanding market reach, positions Zoetis well for sustained growth.
Comparing Zoetis to its industry peers highlights its strong position in the market. For instance, while Esperion Therapeutics reported a significant positive earnings surprise driving a 14.2% stock price increase, Zoetis growth has been fueled more by organic product sales and market expansion. This underscores Zoetis's focused strategy and consistent performance in the animal health sector.
When evaluating investment opportunities, metrics such as the forward Price-to-Earnings (P/E) ratio, PEG ratio, and Price-to-Book (P/B) ratio provide valuable insights. Zoetis' forward P/E of 29.84 and a PEG ratio of 2.67 indicate its growth potential, although some comparative metrics suggest USANA Health Sciences, with more favorable valuation metrics, may be a more attractive option for value investors. Nonetheless, Zoetis continues to maintain a strong financial position and market leadership.
Beyond financial performance, Zoetis has made significant contributions to global disaster relief, partnering with the American Red Cross and American Humane. A $3 million grant to the American Red Cross aims to enhance emergency preparedness and disaster relief over six years, supporting both domestic and international initiatives. Similarly, Zoetis' decade-long collaboration with American Humane focuses on safeguarding animal welfare during emergencies, demonstrating Zoetiss proactive approach to corporate social responsibility.
Innovation remains at the heart of Zoetis' strategy, as evidenced by its blockbuster drug Apoquel, which has revolutionized dermatitis treatment in pets. The company's commitment to safety and efficacy is evident in products like Apoquel and Simparica Trio, which offer comprehensive protection for pets. Zoetis also addresses critical issues in livestock, such as avian influenza, underscoring its strategic response to emerging threats and its role in global food security.
In summary, Zoetis Inc. exemplifies a well-rounded leader in the animal health industry, characterized by its comprehensive sustainability efforts, robust financial performance, and strategic innovation. The company's commitment to supporting communities, advancing animal health, and protecting the environment underscores its dedication to creating a healthier future for all stakeholders. As Zoetis continues to navigate the dynamic landscape of animal healthcare, it is well-positioned for sustained success and growth. For detailed reports and further insights, refer to the sources provided, such as Business Wire, Seeking Alpha, Yahoo Finance, and Zacks Equity Research.
For more detailed information on Zoetis and other top feminist stocks, you can read the original article here.
Zoetis Inc. (ZTS) exhibited moderate volatility, with its returns being fairly erratic over the period from mid-2019 to mid-2024. The ARCH model shows that past disturbances significantly affect current volatility levels, with a noteworthy impact coefficient. The model's Log-Likelihood is relatively low, indicating a model fit that needs further refinement despite its statistical significance.
| Dep. Variable | asset_returns |
| R-squared | 0.000 |
| Adj. R-squared | 0.001 |
| Mean Model | Zero Mean |
| Vol Model | ARCH |
| Log-Likelihood | -2,478.41 |
| Distribution | Normal |
| AIC | 4,960.82 |
| BIC | 4,971.09 |
| No. Observations | 1,256 |
| Df Residuals | 1,256 |
| Df Model | 0 |
| omega | 2.3818 |
| std err | 0.211 |
| t | 11.296 |
| P>|t| | 1.378e-29 |
| 95.0% Conf. Int. | [1.969, 2.795] |
| alpha[1] | 0.2985 |
| std err | 0.0942 |
| t | 3.169 |
| P>|t| | 0.00153 |
| 95.0% Conf. Int. | [0.114, 0.483] |
| Covariance estimator | robust |
To analyze the financial risk of a $10,000 investment in Zoetis Inc. (ZTS) over a one-year period, we can integrate volatility modeling with machine learning predictions. This combined approach provides a comprehensive view of the risks associated with equity investment in Zoetis Inc.
Volatility Modeling
Volatility modeling is crucial for understanding the inherent fluctuations in Zoetis Inc.'s stock price. By analyzing past return data, volatility modeling captures time-varying volatility, which helps identify periods of higher risk. This analysis ensures a better grasp of the stock's behavior and potential risk exposure. Such a model can give insights into how volatile Zoetis Inc.'s stock might be over time, which is essential for understanding the risk of price changes that could impact the value of an investment.
Machine Learning Predictions
In tandem with volatility modeling, machine learning predictions, particularly using techniques like ensemble-based regression methods, offer a robust mechanism for forecasting future returns. Here, the machine learning model analyzes historical stock returns alongside various market and economic indicators to predict future returns. This advanced predictive capability refines our understanding of potential future performance beyond traditional statistical methods, accommodating more complex and non-linear relationships within the data.
Results and Value at Risk (VaR) Analysis
When we focus on the quantified risk, the calculated annual Value at Risk (VaR) at a 95% confidence interval for a $10,000 investment in Zoetis Inc. amounts to $277.54. This metric implies that over the course of one year, with a 95% confidence level, the maximum expected loss on this $10,000 investment will not surpass $277.54. This figure is derived from integrating insights from volatility modeling, which captures the risk of sharp price movements, and machine learning predictions, predicting how these potential price movements might translate into future returns.
The calculated VaR informs investors about the potential downside risk in their equity investment. By combining volatility modeling to understand the stock's unpredictable movements and machine learning predictions to forecast returns, investors gain a nuanced and data-driven perspective on the investments risk profile. This dual approach thus underlines the various dimensions of financial risk inherent in an equity investment in Zoetis Inc. and underscores the importance of using sophisticated techniques for a detailed risk assessment.
Long Call Option Strategy
When selecting profitable long call options for Zoetis Inc. (ZTS), it's essential to consider a mix of near-term and long-term positions. Given the target stock price is 2% over the current price, we need options with a delta close to 1, which indicates a high probability of finishing in-the-money (ITM), and gamma, vega, theta, and rho values that reflect favorable risk-reward setups. Below are the five choices for long call options, analyzed based on their potential risk and reward scenarios.
-
Expiring on 2024-07-19, Strike Price: $145: This option exhibits a solid delta of 0.8746, indicating the option moves significantly with the stock. The gamma of 0.0070 ensures some sensitivity to stock price changes, while the vega of 7.918 shows moderate implied volatility sensitivity. Despite a theta decay of -0.1777 per day, the premium of $25.45 offers an ROI of 0.2506 with a potential profit of $6.3772. Given its short-term expiration, it is suitable for traders looking for near-term gains with modest risk, as the investment may lose value quickly if the stock doesn't move favorably.
-
Expiring on 2024-11-15, Strike Price: $130: With a delta of 0.9050, this option is highly responsive to stock price changes. It's characterized by a low gamma of 0.0038, meaning less sensitivity to further price changes, and a moderate vega of 17.408, which reflects moderate volatility sensitivity. Theta decay is minimal at -0.0346 per day, and rho is quite favorable at 0.4130, indicating sensitivity to interest rates. At a premium of $42.00 and an ROI of 0.115, this option offers a good balance between risk and long-term reward, projected to yield a profit of $4.8272.
-
Expiring on 2024-11-15, Strike Price: $160: For those looking further down the road, this option has a delta of 0.7089. The gamma of 0.0097 shows moderate sensitivity to changes in the underlying stock's price. The high vega of 36.129 underscores considerable exposure to volatility changes, complemented by a manageable theta decay of -0.0523 per day. Rho at 0.3773 indicates potential gains with rising interest rates. The premium sits at $14.70, promising an ROI of 0.1447 with a profit of $2.1272, making it a solid choice for mid-term bettors with moderate risk tolerance.
-
Expiring on 2025-01-17, Strike Price: $130: This option possesses a robust delta of 0.9945, indicating near-certain ITM status given favorable stock movements, though it has no gamma, suggesting stable responsiveness. The absence of vega implies no sensitivity to volatility, and theta decay of -0.0104 per day is negligible, ensuring slow time decay. The rho is potent at 0.6956. Priced at a $29.4 premium, this option offers an ROI of 0.5928 and a promising profit of $17.4272ideal for long-term investors bullish on the stock. The risk lies mostly in significant stock price declines over the extended term.
-
Expiring on 2026-01-16, Strike Price: $90: The long-duration call option features an impressive delta of 0.9847, ensuring responsiveness to stock price movements. No gamma and vega values imply stable sensitivity to both stock and volatility changes, and theta, at -0.0053 per day, indicates very minimal time decay. The very high rho of 1.3004 reflects strong sensitivity to interest rates. With a premium of $67.00, it provides a high ROI of 0.2959 and an excellent profit potential of $19.8272. This choice is tailored for those expecting substantial long-term appreciation in Zoetis' stock, with minimal decay risk.
Each option varies significantly in terms of expiration, strike price, and associated Greeks, providing choices that range from immediate returns to long-term gains. Investors should match their risk profiles and investment horizons to these options, considering how variable elements like volatility and interest rates could influence profitability and risk.
Short Call Option Strategy
Analyzing Short Call Options for Zoetis Inc. (ZTS)
When evaluating the profitability and risk of short call options for Zoetis Inc., our primary focus is to maximize the premium received while minimizing the risk of the options being assigned shares. Given that the target stock price is 2% under the current price, deep in-the-money options with high deltas are less attractive due to the high probability of assignment. Conversely, out-of-the-money options with lower deltas present minimal assignment risks and can still offer attractive premiums and returns.
Let's consider five of the most profitable options across different expiration dates, based on premium, return on investment (ROI), and profitability, while minimizing the risk related to being in-the-money:
1. Short Call Option (Expiration: 2025-01-17, Strike: 160.0)
- Delta: 0.6942
- Gamma: 0.0080
- Vega: 44.5042
- Theta: -0.0456
- Rho: 0.5187
- Premium: $25.20
- ROI: 60.7429%
- Profit: $15.31
This option shows a promising balance between risk and reward. The delta of approximately 0.69 indicates a moderate probability of the option being in-the-money at expiration, but it's not excessively high. A premium of $25.20 with an ROI of 60.74% signals substantial potential profitability. However, the risk of having shares assigned is tangible but manageable considering the high payoff.
2. Short Call Option (Expiration: 2025-06-20, Strike: 155.0)
- Delta: 0.7086
- Gamma: 0.0051
- Vega: 57.3562
- Theta: -0.0381
- Rho: 0.8284
- Premium: $32.64
- ROI: 54.3725%
- Profit: $17.75
This longer-term option offers a high premium of $32.64 and an impressive ROI of 54.37%. The delta is slightly above 0.70, meaning there's a reasonable risk of the option being assigned. However, the high premium and profit potential make it an attractive choice if the risk is accepted.
3. Short Call Option (Expiration: 2024-07-19, Strike: 165.0)
- Delta: 0.7964
- Gamma: 0.0255
- Vega: 10.8751
- Theta: -0.0985
- Rho: 0.0632
- Premium: $11.50
- ROI: 57.4539%
- Profit: $6.61
This option, expiring sooner than others, provides a manageable delta under 0.80 and a solid premium of $11.50. The ROI is 57.45%, which is substantial for a relatively short timeframe. The moderate risk of assignment is balanced by the profitable premium.
4. Short Call Option (Expiration: 2026-01-16, Strike: 160.0)
- Delta: 0.6861
- Gamma: 0.0042
- Vega: 74.1374
- Theta: -0.0311
- Rho: 1.1925
- Premium: $35.89
- ROI: 72.4358%
- Profit: $25.9972
With the highest premium among the analyzed options, this long-term option shows a robust ROI of 72.43% and a favorable balance of risk and reward. The delta of approximately 0.69 is reasonable for the long expiration date, suggesting a moderate assignment risk. The high premium and profit offer significant potential for an investor willing to accept some risk.
5. Short Call Option (Expiration: 2025-01-17, Strike: 165.0)
- Delta: 0.6518
- Gamma: 0.0087
- Vega: 47.0027
- Theta: -0.0463
- Rho: 0.4963
- Premium: $23.95
- ROI: 79.5708%
- Profit: $19.0572
This option presents the highest ROI of 79.57%, with a delta slightly under 0.65. The assignment risk is relatively lower compared to other high-delta options, yet it still offers a substantial premium of $23.95. The profit potential makes this option highly attractive, striking a favorable balance between risk and reward.
Conclusion
Among the evaluated options, the short call expiring on 2026-01-16 with a strike price of 160.0 stands out due to its high premium and significant ROI, despite the moderately high assignment risk. Options with longer expiration dates generally provide higher premiums and potential profits, but come with increased uncertainties over a longer period. Shorter-term options like the one expiring on 2024-07-19 with a strike of 165.0 offer quicker realization of profits with moderate risk. Balancing risk with high returns, these options provide diverse strategies suitable for different investor risk appetites and time horizons.
Long Put Option Strategy
Analyzing the long put options for Zoetis Inc. (ZTS), five choices stand out based on their expiration dates and strike prices, each offering unique risk-reward profiles. The options considered are spread across different time frames to accommodate varying investment strategies and risk appetites.
Near-Term Option
Expiration Date: 2024-07-19 | Strike Price: $220.00 - Delta: -0.9995 | Gamma: 0.0 | Vega: 0.0 | Theta: 0.0214 | Rho: -0.1083 - Premium: $27.00 | ROI: 59.9% | Profit: $16.17
This near-term option with an expiration date of July 19, 2024, and a strike price of $220.00 has a delta value of -0.9995, indicating it closely tracks the underlying stock's movements. The premium is relatively high at $27.00, but it offers a significant ROI of 59.9%, with an expected profit of $16.17. The theta value of 0.0214 indicates that the option will lose value at a rate of $0.0214 per day, which is moderate. Given its high delta, this option can offer substantial protection against a decline in ZTS stock.
Intermediate Option
Expiration Date: 2025-01-17 | Strike Price: $200.00 - Delta: -0.9945 | Gamma: 0.0 | Vega: 0.0 | Theta: 0.0185 | Rho: -1.0701 - Premium: $17.20 | ROI: 34.7% | Profit: $5.97
The intermediate-term option expiring on January 17, 2025, with a strike price of $200.00 also presents a high delta of -0.9945, ensuring that it effectively hedges the stock's downside. The premium is more affordable at $17.20, and the ROI is a healthy 34.7%, with an expected profit of $5.97. The theta is slightly lower than the near-term option at 0.0185, indicating slower time decay. This option provides a reasonable balance between cost and protection.
Long-Term Options
Expiration Date: 2025-01-17 | Strike Price: $240.00 - Delta: -0.9527 | Gamma: 0.0030 | Vega: 11.4617 | Theta: 0.0160 | Rho: -1.2470 - Premium: $54.50 | ROI: 15.9% | Profit: $8.67
For those willing to pay a higher premium for more protection, the long-term option expiring on January 17, 2025, with a strike price of $240.00 is worth considering. Although the delta is slightly lower at -0.9527, its high vega of 11.4617 makes it more sensitive to volatility changes. The premium is steep at $54.50, but it offers a profit potential of $8.67 and an ROI of 15.9%. This option has a moderate theta of 0.0160, implying a relatively slow rate of time decay.
Expiration Date: 2025-01-17 | Strike Price: $210.00 - Delta: -0.7804 | Gamma: 0.0086 | Vega: 37.3211 | Theta: -0.0079 | Rho: -0.9409 - Premium: $26.70 | ROI: 24.2% | Profit: $6.47
Another long-term option with a strike price of $210.00 expiring on January 17, 2025, has a delta of -0.7804, providing less downside protection compared to the $240.00 strike option. However, its higher vega of 37.3211 indicates significant sensitivity to volatility, and the premium remains reasonable at $26.70. It offers an ROI of 24.2% and an expected profit of $6.47. This balance between cost and potential gain makes it an attractive option.
Expiration Date: 2026-01-16 | Strike Price: $210.00 - Delta: -0.6431 | Gamma: 0.0079 | Vega: 78.3347 | Theta: -0.0005 | Rho: -2.2615 - Premium: $30.10 | ROI: 10.2% | Profit: $3.07
The longest-term option considered is expiring on January 16, 2026, with a strike price of $210.00. The delta, at -0.6431, offers moderate protection. However, its high vega of 78.3347 makes it extremely responsive to volatility changes. The premium is $30.10, with a relatively lower ROI of 10.2% and a profit expectation of $3.07. The theta is almost negligible at -0.0005, indicating very slow time decay, making it suitable for investors looking for long-term protection with an appetite for volatility exposure.
Risk and Reward Analysis
Choosing from these different options comes down to balancing risk and reward based on your investment horizon and risk tolerance. The near-term option offers substantial profit potential with a higher rate of daily time decay, making it suitable for those who anticipate quick stock movements or need immediate protection. The intermediate option strikes a balance between cost, decay, and protection, ideal for medium-term strategies.
The longer-term options provide varying degrees of protection and premium costs, with the $240.00 strike offering higher immediate costs but potentially more security. The strike price of $210.00 expiring in 2025 balances premium and protection. Lastly, the longest-term option offers very low time decay and is highly sensitive to volatility, fitting for those aiming to hedge further into the future and willing to bet on increased stock volatility.
In sum, each option has unique attributes that could be advantageous depending on specific market conditions and investment goals. The choice should be made considering the underlying stock's anticipated movements, personal risk tolerance, and financial objectives.
Short Put Option Strategy
When evaluating short put options for Zoetis Inc. (ZTS), our primary objective is to identify the most profitable options while minimizing the risk of being assigned shares. Given the target stock price is set at 2% below the current stock price, we need to carefully select options with deltas that indicate a lower probability of finishing in-the-money (ITM) while also ensuring an attractive return on investment (ROI) and manageable risk profile.
Near-term Expiration (July 19, 2024)
- Strike Price: $160
- Greek Values: Delta: -0.0802, Gamma: 0.0144, Vega: 5.73, Theta: -0.0414, Rho: -0.0070
- Premium: $0.35, ROI: 100%, Profit: $0.35
-
Analysis: This strike offers a premium that leads to a high ROI, but the low premium and the resulting small absolute profit might not be very attractive. The delta indicates a low probability of assignment, which aligns well with our risk minimization goal.
-
Strike Price: $165
- Greek Values: Delta: -0.1940, Gamma: 0.0258, Vega: 10.57, Theta: -0.0780, Rho: -0.0172
- Premium: $0.77, ROI: 100%, Profit: $0.77
- Analysis: With a slightly higher delta, there is a moderate probability of the option finishing ITM. However, the premium and corresponding profit are higher, making it a balanced choice in terms of risk and reward.
Medium-term Expiration (October 18, 2024)
- Strike Price: $170
- Greek Values: Delta: -0.3846, Gamma: 0.0167, Vega: 36.12, Theta: -0.0330, Rho: -0.2189
- Premium: $6.5, ROI: 98.35%, Profit: $6.3928
-
Analysis: This option features a substantial premium leading to significant profit, but it carries a higher delta, implying an increased risk of assignment. The relatively high profit potential makes it attractive despite the higher risk.
-
Strike Price: $160
- Greek Values: Delta: -0.2352, Gamma: 0.0128, Vega: 29.09, Theta: -0.0297, Rho: -0.1324
- Premium: $3.3, ROI: 100%, Profit: $3.3
- Analysis: The delta is moderate, indicating a reasonable risk of assignment. The premium and resulting profit are appealing, presenting a good balance between risk and reward.
Long-term Expiration (January 17, 2025)
- Strike Price: $160
- Greek Values: Delta: -0.2824, Gamma: 0.0058, Vega: 72.26, Theta: -0.0112, Rho: -0.9458
- Premium: $15.7, ROI: 100%, Profit: $15.7
- Analysis: The significant premium offers a high profit potential, but the delta presents a considerable risk of finishing ITM. Despite the risk, the profit is compelling for those willing to undertake some degree of risk.
These five options span near-term to long-term expirations, offering varying degrees of risk and reward. In conclusion, shorter-term options with lower deltas present the least risk of assignment but come with lower premiums and profits. Longer-term options with moderate to high deltas carry a higher assignment risk but offer high premiums and sizeable profits, making them suitable for more risk-tolerant investors. Overall, selecting the best option depends on the investor's risk tolerance and profit expectations.
Vertical Bear Put Spread Option Strategy
When constructing an options strategy involving a vertical bear put spread for Zoetis Inc. (ZTS), it's pivotal to balance profit potential and the risk of early assignment, especially for options that are in the money. The goal here is to attain a suitable return while minimizing the risk of being assigned shares. Given the target stock price, we should seek optimal options that align with the specified criteria.
Near-Term Options (Expiring 2024-07-19)
- Short Put: Strike Price 90.0, Premium $0.25, Delta -0.0131
- Long Put: Strike Price 135.0, Premium $1.59, Delta -0.1359
This spread has a low delta for the short put, which minimizes the risk of assignment. The potential profit is $1.34 (Premium of $1.59 for long put - Premium of $0.25 for short put) if the stock price drops below $90. The low deltas denote minimal risk of assignment but modest profit potential.
- Short Put: Strike Price 140.0, Premium $0.20, Delta -0.0685
- Long Put: Strike Price 185.0, Premium $7.20, Delta -0.7804
This combination offers a potential profit of $7.00. The delta of the short put is relatively low, further reducing assignment risk. The long put has substantial delta, enhancing profit potential on stock price depreciation.
Mid-Term Options (Expiring 2024-10-18)
- Short Put: Strike Price 165.0, Premium $4.80, Delta -0.3049
- Long Put: Strike Price 200.0, Premium $17.20, Delta -0.9945
Here, the net premium is $12.40, with a potential profit of $38.01 if the stock price drops to $165 or lower. Although the delta of the short put is higher, the profit potential might justify the assignment risk.
- Short Put: Strike Price 170.0, Premium $6.50, Delta -0.3846
- Long Put: Strike Price 185.0, Premium $34.50, Delta -0.6431
The net premium here is $28.00. The higher delta of the short put means higher assignment risk, but the high delta of the long put supports substantial profit potential with sharp stock depreciation. Net potential is substantial despite raised assignment risks.
Long-Term Options (Expiring 2025-01-17)
- Short Put: Strike Price 175.0, Premium $13.60, Delta -0.4424
- Long Put: Strike Price 220.0, Premium $27.00, Delta -0.9995
This strategy provides a net premium of $13.40. If the stock price declines farther below $175, the profit can be significant. Despite a higher delta of the short put, indicating a risk of assignment, the overall return might justify the possible assignment.
Quantified Risk and Reward Analysis
- Short 90.0 / Long 135.0 (2024-07-19):
- Premium Received: $0.25 - $1.59 = -$1.34 Paid
- Max Profit: $3.34 (if stock hits $90 or lower without gap)
-
Risk: Minimal (delta -0.0131), return lower.
-
Short 140.0 / Long 185.0 (2024-07-19):
- Premium Received: $0.20 - $7.20 = -$7.00 Paid
- Max Profit: $45 ($185 - $140 + Premiums)
-
Risk: Lower risk (delta -0.0685), much higher potential profit on drastic drops.
-
Short 165.0 / Long 200.0 (2024-10-18):
- Premium Received: $4.80 - $17.20 = -$12.40 Paid
- Max Profit: $38.00 (Paid spread when struck, gross return)
-
Risk: Higher chance (delta -0.3049), balanced higher returns.
-
Short 170.0 / Long 185.0 (2025-01-17):
- Premium Received: $6.50 - $34.50 = -$28.00 Paid
- Max Profit: $45 (high gross return)
-
Risk: Considerable assignment potential (delta -0.3846), justified through large drop expectation.
-
Short 175.0 / Long 220.0 (2025-01-17):
- Premium Received: $13.60 - $27.00 = -$13.40 Paid
- Max Profit: $68.00 (substantial if dips drastically)
- Risk: High delta (0.9995 long put, strong coverage on drop).
This spreads keep assignment risk minimal while focusing on low deltas for short puts. The primary focus skewed towards higher differential profit potential with calculated risks based on current and volatility assessments.
Vertical Bull Put Spread Option Strategy
In analyzing the options chain for Zoetis Inc. (ZTS) with a focus on vertical bull put spreads, multiple factors come into play, primarily the trade-off between risk and reward, and the potential for option assignment. For a vertical bull put spread, you typically sell a higher strike put and buy a lower strike put to limit potential losses. The attractiveness of any given spread depends on the associated Greeks and the target price movements.
Near Term (Expiring on 2024-07-19):
- Strike 165/160 Vertical Bull Put Spread:
- Short Put at Strike 165.0 (Delta: -0.194, Gamma: 0.0258, Premium: 0.77)
- This option has a high relative premium given its proximity to the current stock price. Its delta of -0.194 suggests a lower probability of being in the money but with a moderate risk of assignment.
- Long Put at Strike 160.0 (Delta: -0.080, Gamma: 0.0144, Premium: 0.35)
- This put has a low premium, effectively capping the downside risk.
- Net Premium: 0.77 - 0.35 = 0.42
- Risk/Reward: If ZTS stays above $165, the max profit is $0.42 per share, translating to the premium collected. The max loss is the difference between strikes minus net premium received, $5.00 - 0.42 = $4.58 per share.
- Potential Profit: $0.42, Potential Loss: $4.58.
Mid Term (Expiring on 2024-08-16):
- Strike 170/165 Vertical Bull Put Spread:
- Short Put at Strike 170.0 (Delta: -0.387, Gamma: 0.0140, Premium: 7.98)
- With a higher delta, this put carries a significant risk of assignment but offers a substantial premium.
- Long Put at Strike 165.0 (Delta: -0.322, Gamma: 0.0125, Premium: 8.1)
- This out-of-the-money put serves to cap the losses.
- Net Premium: 7.98 - 8.1 = -0.12
- Risk/Reward: This spread gives a negative net premium but has a max profit of $5 (difference between strike prices). The max loss here is $5 given the negative premium.
- Potential Profit: $4.88, Potential Loss: $5.
Long Term (Expiring on 2025-01-17 and 2026-01-16):
- Strike 165/160 Vertical Bull Put Spread (2025-01-17):
- Short Put at Strike 165.0 (Delta: -0.320, Gamma: 0.0112, Premium: 10.32)
- High potential premium with moderate-to-high delta suggesting significant potential for being assigned.
- Long Put at Strike 160.0 (Delta: -0.267, Gamma: 0.010, Premium: 8.42)
- A significant cost put still allows capping risk effectively.
- Net Premium: 10.32 - 8.42 = 1.90
- Risk/Reward: Max profit is the net premium received if ZTS stays above $165. Max loss is the strike difference minus net premium, $5.00 - $1.90 = $3.10.
-
Potential Profit: $1.90, Potential Loss: $3.10.
-
Strike 175/170 Vertical Bull Put Spread (2026-01-16):
- Short Put at Strike 175.0 (Delta: -0.379, Gamma: 0.0069, Premium: 18.4)
- Higher premium with high delta implying a substantial risk of assignment.
- Long Put at Strike 170.0 (Delta: -0.345, Gamma: 0.0065, Premium: 15.91)
- Reasonably limits potential downside risk.
- Net Premium: 18.4 - 15.91 = 2.49
- Risk/Reward: Max profit if ZTS stays above $175. Max loss is $5.00 - 2.49 = $2.51.
-
Potential Profit: $2.49, Potential Loss: $2.51.
-
Strike 200/195 Vertical Bull Put Spread (2026-01-16):
- Short Put at Strike 200.0 (Delta: -0.567, Gamma: 0.008, Premium: 30.2)
- High premium but very high delta indicating almost certain assignment if in the money.
- Long Put at Strike 195.0 (Delta: -0.443, Gamma: 0.0068, Premium: 34.5)
- Higher cost but effectively caps risk at a significant level.
- Net Premium: 30.2 - 34.5 = -4.30
- Risk/Reward: Despite the negative premium, high profit potential with max profit of $5 (difference between strikes). Max loss here caps as $5 with negative premium.
- Potential Profit: $0.70, Potential Loss: $5.
Conclusion:
The choice hinges on balancing risk and reward while keeping assignment risk under consideration. Lower delta values signify lower risks of assignments:
- 165/160 for 2024-07-19 Low risk, medium reward.
- 170/165 for 2024-08-16 Higher risk with potential higher reward.
- 165/160 for 2025-01-17 Balanced option for sensible risk/reward.
- 175/170 for 2026-01-16 Premium option for longer durations with balanced risks.
- 200/195 for 2026-01-16 High-risk, high-reward for speculative traders.
Each strategy must be chosen based on the investor's risk tolerance, time horizon, and market outlook.
Vertical Bear Call Spread Option Strategy
When considering a vertical bear call spread, the chosen short call option should be higher than the corresponding long call option, both in terms of strike price and these should be within the target price range. Since the goal is to minimize the risk of having shares assigned, selecting options that are not significantly in the money is vital. Here, we will analyze the most profitable vertical bear call spreads across different expiration dates, and utilize the Greeks to ensure both potential profitability and minimized risks.
Near-term Options (Expiring on July 19, 2024)
- Short Call - Strike: 135.0, Premium: $47.85, Delta: 0.7606, Theta: -1.0651 , ROI: 27.08%
- Long Call - Strike: 125.0, Premium: $46.60, Delta: 0.8949, Theta: -0.2671, ROI: 11.21%
This spread has a good balance of premiums and relatively higher return on investment. The delta for the short call is lower compared to the long call, indicating lesser risk for the option ending up significantly in the money. The theta difference will generate more decay for the short call, enhancing profit potential.
Medium-term Options (Expiring on August 16, 2024)
- Short Call - Strike: 170.0, Premium: $10.2, Delta: 0.6060, Theta: -0.08819, ROI: 100%
- Long Call - Strike: 160.0, Premium: $14.1, Delta: 0.7027, Theta: -0.0818, ROI: 19.34%
In this setup, the risk is mitigated by the delta being closer to 0.5, which decreases the possibility of the option ending deep in the money. The premium difference ensures this vertical spread will still have profit potential from the initial net credit received.
Long-term Options (Expiring on October 18, 2024)
- Short Call - Strike: 165.0, Premium: $18.2, Delta: 0.6645, Theta: -0.0583, ROI: 73.12%
- Long Call - Strike: 160.0, Premium: $18.1, Delta: 0.7218, Theta: -0.0563, ROI: 45.34%
This potential setup presents a favorable spread, with the short call providing ample premium to make the position attractive while having a slightly lower delta, reducing assignment risk. Both components have slower theta decay in the long term.
Extended-term Options (Expiring on November 15, 2024)
- Short Call - Strike: 155.0, Premium: $21.1, Delta: 0.8399, Theta: -0.04769, ROI: 9.93%
- Long Call - Strike: 150.0, Premium: $24.43, Delta: 0.9028, Theta: -0.07757, ROI: 1.03%
These options provide a significant premium difference, with the short leg having more delta exposure, which means potentially more risk if the market moves against the position. However, the theta decay differential still favors the short position when establishing the spread.
Very Long-term Options (Expiring on January 17, 2025)
- Short Call - Strike: 165.0, Premium: $23.95, Delta: 0.6518, Theta: -0.04635, ROI: 79.57%
- Long Call - Strike: 160.0, Premium: $25.2, Delta: 0.6942, Theta: -0.04557, ROI: 60.74%
For an extended expiration, this spread is balanced well in terms of premium and delta. Its theta differential ensures the short call remains profitable throughout the period, even as the long call mitigates some risk with a nearby strike.
Profit & Loss Analysis
Potential Profit:
- Maximum Profit: The maximum profit occurs if the stock stays below the strike price of the short call until expiration. This profit is equal to the net premium received when establishing the spread (Premium of Short Call - Premium of Long Call).
Potential Loss:
- Maximum Loss: The maximum loss happens if the stock price rises above the strike price of the long call. This is calculated as the difference in strike prices of the short and long calls, minus the net premium received.
Example Calculation: For the short 165.0 call and long 160.0 call expiring on January 17, 2025: - Net Premium Received (165.0 -160.0 strikes): 23.95 - 25.2 = -1.25 - Maximum Profit: $1.25 (minus potential transaction fees) - Maximum Loss: (165 - 160) - 1.25 = $3.75
By considering delta values around 0.7 or lower, theta decay rates, and adequate premium collection relative to risk, these setups have been tailored to maximize profitability while managing risk effectively, reflecting diverse periods from near-term to very long-term expiration dates.
Vertical Bull Call Spread Option Strategy
Based on the data provided and the target of achieving a stock price within 2% over or under the current stock price, I will analyze five vertical bull call spread options strategies across varying expiration periods to identify the most profitable opportunities while also minimizing the risk of shares being assigned (In-The-Money).
Strategy 1: Near Term Expiration (18 Days - July 19, 2024)
For the near-term expiration, a potential vertical bull call spread strategy could focus on the 140.0 and 175.0 strike prices. The call option with a strike price of 140.0 has a delta of 0.9995, indicating an almost perfect correlation with the stock's price movements. Alternatively, the strike price 175.0 call option has a delta of 0.453, which suggests less risk of assignment due to it being less deep In-The-Money (ITM).
The risk and reward analysis for this strategy are as follows: - Premium Cost: Approximately $35.0 (long call @140.0) - $3.3 (short call @175.0) = $31.7 - Maximum Profit: ($35.0 - $3.3) x 100 shares - $3,170 (net premium paid) = $1,700 - Breakeven Point: 140.0 + 31.7 = 171.7 (stock price must reach or exceed $171.7 to achieve profitability)
Strategy 2: Intermediate Term Expiration 1 (46 Days - August 16, 2024)
For an intermediate expiration of 46 days, the 160.0 strike call option (long) with a delta of 0.768 and a 200.0 strike call option (short) with a delta of 0.0986 offer a favorable balance of profitability and assignment risk.
The risk and reward analysis for this strategy are as follows: - Premium Cost: Approximately $14.1 (long call @160.0) - $0.7 (short call @200.0) = $13.4 - Maximum Profit: ($200 - $160) * 100 - $1,340 (net premium paid) = $2,660 - Breakeven Point: 160.0 + 13.4 = 173.4 (stock price must reach or exceed $173.4 to achieve profitability)
Strategy 3: Intermediate Term Expiration 2 (109 Days - October 18, 2024)
For a longer expiration period of 109 days, we can consider the strategy involving the 160.0 strike call option (long) with a 0.722 delta and a 190.0 strike call option (short) with a 0.316 delta.
The risk and reward analysis for this strategy are as follows: - Premium Cost: Approximately $18.1 (long call @160.0) - $4.7 (short call @190.0) = $13.4 - Maximum Profit: ($190 - $160) * 100 - $1,340 (net premium paid) = $2,660 - Breakeven Point: 160.0 + 13.4 = 173.4 (stock price must reach or exceed $173.4 to achieve profitability)
Strategy 4: Long Term Expiration 1 (200 Days - January 17, 2025)
For a further-out expiration, the 160.0 strike call (long) with a delta of 0.694 and the 190.0 strike call (short) with a delta of 0.313 offer a strategic advantage.
The risk and reward analysis for this strategy are as follows: - Premium Cost: Approximately $25.2 (long call @160.0) - $6.2 (short call @190.0) = $19.0 - Maximum Profit: ($190 - $160) * 100 - $1,900 (net premium paid) = $1,100 - Breakeven Point: 160.0 + 19.0 = 179.0 (stock price must reach or exceed $179.0 to achieve profitability)
Strategy 5: Long Term Expiration 2 (564 Days - January 16, 2026)
For the longest duration, a vertical spread involving the 155.0 strike call (long) with a delta of 0.729 and the 185.0 strike call (short) with a delta of 0.408 presents an option.
The risk and reward analysis for this strategy are as follows: - Premium Cost: Approximately $34.0 (long call @155.0) - $11.8 (short call @185.0) = $22.2 - Maximum Profit: ($185 - $155) * 100 - $2,220 (net premium paid) = $780 - Breakeven Point: 155.0 + 22.2 = 177.2 (stock price must reach or exceed $177.2 to achieve profitability)
Conclusion
Among these strategies, the mid-term strategy expiring 109 days from now (October 18, 2024) involving 160.0 (long) and 190.0 (short) strikes presents an attractive proposition due to a high-profit potential coupled with manageable risk. This strategy yields high potential maximum profit of $2,660 for a reasonable premium cost. Furthermore, by selecting strike prices further OTM for the short leg, we minimize the risk of assignment while still maintaining favorable Greek metrics.
Spread Option Strategy
When constructing a calendar spread options strategy involving Zoetis Inc. (ZTS) and based on the data provided, we must carefully analyze the long call options and short put options to maximize potential profit while minimizing risk. In this strategy, we will buy a call option with a longer expiration and sell a put option with a shorter expiration. The goal is to exploit the time decay in the short option and benefit from any increase in volatility or favorable price movements in the long option. Given that our target stock price is 2% over or under the current price, this should shape our selection of strike prices.
Here are five potential choices listed from near-term to long-term options:
Near-Term Strategy:
Choice 1: - Long Call: Strike 125.0, Expiration 2024-07-19 - Premium: $46.6, Delta: 0.8949614604, Theta: -0.2671557996, Vega: 6.9774162467 - Potential Profit: $5.2272 - Short Put: Strike 125.0, Expiration 2024-07-19 - Premium: $0.28, Delta: -0.0228824957, Theta: -0.0445328862, Vega: 2.0885698587 - Profit Potential: $0.28 - Total Profit: $5.5072
Intermediate-Term Strategy:
Choice 2: - Long Call: Strike 135.0, Expiration 2024-08-16 - Premium: $41.4, Delta: 0.9027855924, Theta: -0.0775710129, Vega: 10.4753299931 - Potential Profit: $0.4272 - Short Put: Strike 160.0, Expiration 2024-08-16 - Premium: $1.68, Delta: -0.193665913, Theta: -0.050466531, Vega: 16.8889728318 - Profit Potential: $1.68 - Total Profit: $2.1072
Mid-Long-Term Strategy:
Choice 3: - Long Call: Strike 145.0, Expiration 2024-10-18 - Premium: $17.0, Delta: 0.8354906122, Theta: -0.0510509617, Vega: 23.169760376 - Potential Profit: $14.8272 - Short Put: Strike 160.0, Expiration 2024-10-18 - Premium: $3.3, Delta: -0.2351909816, Theta: -0.0297049028, Vega: 29.0866439643 - Profit Potential: $3.3 - Total Profit: $18.1272
Long-Term Strategy:
Choice 4: - Long Call: Strike 125.0, Expiration 2025-01-17 - Premium: $33.0, Delta: 0.8823859231, Theta: -0.0348043489, Vega: 24.4285204701 - Potential Profit: $18.8272 - Short Put: Strike 165.0, Expiration 2025-01-17 - Premium: $10.32, Delta: -0.3207662387, Theta: -0.0224359668, Vega: 45.7901073589 - Profit Potential: $10.32 - Total Profit: $29.1472
Extended Long-Term Strategy:
Choice 5: - Long Call: Strike 130.0, Expiration 2026-01-16 - Premium: $39.5, Delta: 0.8082234873, Theta: -0.0259761675, Vega: 55.5220385543 - Potential Profit: $7.3272 - Short Put: Strike 170.0, Expiration 2026-01-16 - Premium: $11.81, Delta: -0.3218431945, Theta: -0.0153165394, Vega: 60.8527776138 - Profit Potential: $11.81 - Total Profit: $19.1372
For each option selected above, the risk due to the possibility of the short put options getting assigned, resulting in having to buy the stock at the strike price, should be considered. We focused on strikes where short put deltas are lower, minimizing chances of assignment compared to the high delta call options which are more likely to stay in the money or close to at the money.
Risk and Reward Analysis:
- Near-Term (Choice 1): This setup offers lower total profit because of the short duration and relatively low premium received on the short put. However, the risks of assignment are low due to the low delta on short puts.
- Intermediate-Term (Choice 2): Offering a balance between risk and reward, this combination provides a moderate profit potential with a foreseeable risk due to intermediate maturity.
- Mid-Long-Term Strategy (Choice 3): This combination, leveraging the strike of 145.0 in long call and using an out-of-the-money 160.0 strike short put, serves well for both high returns and minimized assignment risks.
- Long-Term Strategy (Choice 4): Substantial returns from premium-rich positions, while the risk spectrum is handled efficiently by choosing strikes far from the target price.
- Extended Long-Term Strategy (Choice 5): Maximizing premium returns combines high profit potential and minimized assignment risk from longer-term secular trend exploitation given the 2026 expiration.
In conclusion, these strategies exhibit substantial potential returns with managed risk profiles owing to lower delta values on the short put legs, which reduces assignment probability. Each choice fits varying investor time horizons and risk appetites, ensuring flexibility and profitability in calendar spread execution.
Calendar Spread Option Strategy #1
Calendar Spread Options Strategy Analysis for Zoetis Inc. (ZTS)
A calendar spread, also known as a time spread, involves buying a longer-term option and selling a shorter-term option of the same type (call or put) with the same strike price. In this unique scenario, your strategy involves buying a long put option and selling a short call option to take advantage of the time decay in the short-term call option while hedging with the put option.
Given that we want a strategy that minimizes the risk of having shares assigned, we should carefully select options of appropriate delta that balance profit potential while controlling risk. The target price for ZTS is set to 2% over or under the current stock price, and so the chosen options should revolve around this range for higher profitability with minimal assignment risk. Below are five choices, analyzed for their risk and reward based on expiration dates and strike prices.
1. Near-term Strategy
Buy Put Option: - Strike Price: $220 - Expiration Date: 2024-07-19 - Delta: -0.6431 - Profit: $3.0728 - Premium: $30.1 - Days to Expire: 18
Sell Call Option: - Strike Price: $190 - Expiration Date: 2024-08-16 - Delta: 0.0604 - Profit: $0.35 - Premium: $0.35 - Days to Expire: 46
Analysis: In this strategy, the relatively high delta of the put option and the low delta of the call option reduce the risk of the call option being assigned. The combined premium will help offset the premium paid for the put, while the profit potential remains moderate.
2. Near-term but with higher risk-adjusted return:
Buy Put Option: - Strike Price: $200 - Expiration Date: 2024-07-19 - Delta: -0.7458 - Profit: $0.9728 - Premium: $7.2 - Days to Expire: 18
Sell Call Option: - Strike Price: $185 - Expiration Date: 2024-07-19 - Delta: 0.1266 - Profit: $0.62 - Premium: $0.62 - Days to Expire: 18
Analysis: Here, the delta of the call option is higher, slightly increasing the risk of assignment. However, this is balanced by the greater profitability due to the lower cost of the put option. A careful watch is needed, as the short call is more likely to be in the money.
3. Mid-term Strategy
Buy Put Option: - Strike Price: $210 - Expiration Date: 2024-10-18 - Delta: -0.6431 - Profit: $3.0728 - Premium: $30.1 - Days to Expire: 109
Sell Call Option: - Strike Price: $195 - Expiration Date: 2024-10-18 - Delta: 0.2569 - Profit: $3.0 - Premium: $3.0 - Days to Expire: 109
Analysis: This strategy features a balance between delta and time premium. Both options lie a bit further out, offering a promising ROI while maintaining controlled riskideal for moderate volatility.
4. Long-term Strategy with High ROI
Buy Put Option: - Strike Price: $260 - Expiration Date: 2025-01-17 - Delta: -0.9595 - Profit: $9.1728 - Premium: $74.0 - Days to Expire: 200
Sell Call Option: - Strike Price: $185 - Expiration Date: 2025-01-17 - Delta: 0.4582 - Profit: $11.8 - Premium: $11.8 - Days to Expire: 200
Analysis: This pair involves higher premiums and significant delta values. While the call option carries a higher risk of assignment, the substantial gain offsets this. The longer duration allows the put time to gain more intrinsic value.
5. Long-term but safer Strategy
Buy Put Option: - Strike Price: $210 - Expiration Date: 2026-01-16 - Delta: -0.6431 - Profit: $3.0728 - Premium: $30.1 - Days to Expire: 564
Sell Call Option: - Strike Price: $250 - Expiration Date: 2025-06-20 - Delta: 0.1066 - Profit: $0.8 - Premium: $0.8 - Days to Expire: 200
Analysis: This less risky option with a much lower delta reduces the chance of the call option being assigned. Despite the lower immediate profitability, the hedged select option maintains longer-term substantial growth and less assignment risk.
Overall, the appropriate combination of lower delta short call options and higher delta long put options within chosen strike prices can construct a planned, risk-balanced calendar spread strategy, maximizing returns while mitigating assignment risks. Each presented strategy weighs the potential risks and rewards, blending near-term and long-term opportunities for Zoetis Inc. (ZTS).
Calendar Spread Option Strategy #2
A calendar spread options strategy focuses on profiting from the difference in time decay between short-term and long-term options while minimizing risk. In this scenario, I'll use a combination of selling short-term call options and buying long-term put options.
First Choice: Short Call (2024-07-19, Strike 125) and Long Put (2025-01-17, Strike 210)
- Short Call Option: Strike 125, Expiring 2024-07-19, Delta: 0.8949, Premium: 46.6, Profit: 1.7072, ROI: 3.66
- Long Put Option: Strike 210, Expiring 2025-01-17, Delta: -0.7804, Premium: 26.7, Profit: 6.4728, ROI: 0.24
The short call at a strike price of 125 has a very high delta (0.8949), signifying a high probability of finishing in-the-money (ITM), posing a risk of assignment. However, the premium received is substantial, and the ROI is relatively high. To offset this risk, purchasing a long put at a strike of 210 with a different expiration ensures a hedge against any adverse movements. This combination offers a balanced risk-reward profile with reasonable profits.
Second Choice: Short Call (2024-07-19, Strike 155) and Long Put (2026-01-16, Strike 240)
- Short Call Option: Strike 155, Expiring 2024-07-19, Delta: 0.8316, Premium: 24.6, Profit: 9.7072, ROI: 39.46
- Long Put Option: Strike 240, Expiring 2026-01-16, Delta: -0.6431, Premium: 30.1, Profit: 3.0728, ROI: 0.10
This setup leverages a short call with a lower delta (0.8316) compared to the first choice, reducing the odds of the call being assigned. The long put at a strike of 240 expiring in 2026 further attenuates risk thanks to its extended time frame, providing substantial security while aiming for lucrative returns. This approach minimizes risk while maintaining a healthy return potential.
Third Choice: Short Call (2024-10-18, Strike 140) and Long Put (2026-01-16, Strike 165)
- Short Call Option: Strike 140, Expiring 2024-10-18, Delta: 0.9970, Premium: 36.96, Profit: 7.0672, ROI: 19.12
- Long Put Option: Strike 165, Expiring 2026-01-16, Delta: -0.6518, Premium: 23.95, Profit: 19.0572, ROI: 0.79
Here, the short call option has a very high delta (0.997), signaling a near-certain assignment risk but offers a significant premium. The hedge involves a relatively lower-delta long put with a longer expiration, providing robust protection. This choice suits those targeting maximum premiums albeit with higher upfront risks, ensuring profitability with extended hedging.
Fourth Choice: Short Call (2025-01-17, Strike 180) and Long Put (2025-01-17, Strike 200)
- Short Call Option: Strike 180, Expiring 2025-01-17, Delta: 0.508, Premium: 14.5, Profit: 14.5, ROI: 100.0
- Long Put Option: Strike 200, Expiring 2025-01-17, Delta: -0.9945, Premium: 17.2, Profit: 5.9728, ROI: 0.35
This scenario involves matching expiration dates for both the long put and the short call, reducing the complexity of managing multiple expiration cycles. The delta of 0.508 for the call option suggests moderate risk of assignment. This approach is balanced, with manageable risks and decent returns, favoring those who prefer synchronized expirations.
Fifth Choice: Short Call (2026-01-16, Strike 140) and Long Put (2025-01-17, Strike 200)
- Short Call Option: Strike 140, Expiring 2026-01-16, Delta: 0.7674, Premium: 47.8, Profit: 17.9072, ROI: 100.0
- Long Put Option: Strike 200, Expiring 2025-01-17, Delta: -0.9945, Premium: 17.2, Profit: 5.9728, ROI: 0.35
For those targeting longer-term strategies, leveraging a short call at strike 140 with a modest delta (0.7674) ensures significant premium collection while reducing sudden assignment risks. This is balanced by a long put with a substantial delta (-0.9945), offering robust protection against market downturns, providing consistent and high-value hedging.
Conclusion
Each strategy differs in terms of delta risks, premiums, expiration dates, and potential profits. The optimal choice will depend on individual risk appetite, profit expectations, and how actively you wish to manage the options. Balancing between high-premium short calls with carefully selected long puts is essential to not only hedge market risks but also maximize returns effectively.
Similar Companies in Drug Manufacturers - Specialty & Generic:
PetIQ, Inc. (PETQ), Emergent BioSolutions Inc. (EBS), Bausch Health Companies Inc. (BHC), Neurocrine Biosciences, Inc. (NBIX), Teva Pharmaceutical Industries Limited (TEVA), Haleon plc (HLN), Takeda Pharmaceutical Company Limited (TAK), Intra-Cellular Therapies, Inc. (ITCI), Catalent, Inc. (CTLT), Amphastar Pharmaceuticals, Inc. (AMPH), Alvotech (ALVO), Assertio Holdings, Inc. (ASRT), Viatris Inc. (VTRS), Elanco Animal Health Incorporated (ELAN), Idexx Laboratories (IDXX), Perrigo Company (PRGO), Phibro Animal Health Corporation (PAHC), Neogen Corporation (NEOG)
https://finance.yahoo.com/news/zoetis-releases-2023-sustainability-report-130000685.html
https://finance.yahoo.com/news/usna-vs-zts-stock-better-154015928.html
https://finance.yahoo.com/news/why-esperion-therapeutics-espr-14-153109561.html
https://finance.yahoo.com/news/why-catalent-ctlt-0-4-153054214.html
https://finance.yahoo.com/news/theravance-bio-tbph-down-6-153004077.html
https://finance.yahoo.com/news/zoetis-inc-zts-did-feminist-124629969.html
https://finance.yahoo.com/news/usna-zts-better-value-stock-154010137.html
https://finance.yahoo.com/news/zoetis-foundation-zoetis-deepen-commitment-120000073.html
https://www.youtube.com/watch?v=ul2Yk8a3K8Q
https://www.sec.gov/Archives/edgar/data/1555280/000155528024000249/zts-20240331.htm
Copyright © 2024 Tiny Computers (email@tinycomputers.io)
Report ID: xZohC3
Cost: $0.56047
https://reports.tinycomputers.io/ZTS/ZTS-2024-06-30.html Home