APA Corporation (ticker: APA)
2024-01-28
 APA Corporation, with the ticker symbol APA, is a prominent energy company engaged in the exploration, development, and production of oil and natural gas. Founded in 1954 and headquartered in Houston, Texas, APA operates through various subsidiaries, with significant operations in the United States, Egypt's Western Desert, and the North Sea of the United Kingdom. APA Corporation strives to deliver competitive and sustainable returns to its shareholders by leveraging a diversified asset base, advanced technology, and a strategic approach to operational efficiency. The company is committed to safety, environmental stewardship, and corporate responsibility. With a robust portfolio of resource assets, APA has established itself as an industry leader in the energy sector. Its focus on cost-effective operations and growth through both exploration success and strategic acquisitions enables it to maintain a strong presence in the global energy market. The company's financial performance, strategic developments, and operational updates are closely followed by investors and analysts, reflecting its significant role in the energy industry and the broader stock market.
| City | Houston | State | TX | Country | United States |
| Industry | Oil & Gas E&P | Sector | Energy | Full Time Employees | 2,273 |
| Previous Close | 32.04 | Open | 32.07 | Day Low | 31.63 |
| Day High | 32.265 | Dividend Rate | 1.00 | Dividend Yield | 3.11% |
| Payout Ratio | 19.96% | Five Year Avg Dividend Yield | 2.74% | Beta | 3.31 |
| Trailing PE | 6.41 | Forward PE | 6.19 | Volume | 3,941,740 |
| Average Volume | 4,610,201 | Average Volume 10 Days | 5,257,300 | Market Cap | 9,731,096,576 |
| Fifty Two Week Low | 29.95 | Fifty Two Week High | 46.15 | Price to Sales Trailing 12 Months | 1.15 |
| Fifty Day Average | 34.6978 | Two Hundred Day Average | 37.44075 | Trailing Annual Dividend Rate | 1.00 |
| Trailing Annual Dividend Yield | 3.12% | Enterprise Value | 16,474,760,192 | Profit Margins | 18.07% |
| Float Shares | 304,931,247 | Shares Outstanding | 303,055,008 | Shares Short | 14,881,330 |
| Book Value | 3.514 | Price To Book | 9.14 | Earnings Quarterly Growth | 8.8% |
| Net Income To Common | 1,524,999,936 | Trailing Eps | 5.01 | Forward Eps | 5.19 |
| Total Cash | 95,000,000 | Total Cash Per Share | 0.31 | Ebitda | 5,272,999,936 |
| Total Debt | 5,692,000,256 | Total Revenue | 8,439,000,064 | Debt To Equity | 270.147 |
| Revenue Per Share | 27.267 | Return On Assets | 16.643% | Return On Equity | 102.898% |
| Free Cash Flow | 1,553,374,976 | Operating Cash Flow | 3,512,000,000 | Revenue Growth | -20% |
| Gross Margins | 71.442% | Ebitda Margins | 62.484% | Operating Margins | 39.775% |
| Sharpe Ratio | -11.616825112356649 | Sortino Ratio | -180.9357895077389 |
| Treynor Ratio | -0.2223624310684886 | Calmar Ratio | -0.7973434301956489 |
Upon analyzing the provided data for the stock in question, a multifaceted approach suggests cautious optimism in the medium term, albeit with an air of prudence due to some underlying risks. Technical analysis indicates that the volume balance, as per the OBV (On-Balance Volume), has shown increased selling pressure over the considered period, dropping significantly, which generally signals bearish sentiment. Coupled with the MACD (Moving Average Convergence Divergence) histogram shifting from negative to positive territory, short-term momentum may be gleaned; however, the overall negative OBV trend could overshadow this positivity.
The recent uptick on the last trading day presents a potential sign of reversal, but without a larger context or supportive indicators, one should refrain from labeling it as a firm bullish indication. It is essential to consider the fundamental data which shows strengths, such as the normalized EBITDA indicating operational profitability and a robust gross profit. This foundational soundness may support a better price recovery in the forthcoming months.
However, the balance sheet presents a situation where substantial liabilities exist against total assets, with also a sizeable amount of net debt. This may hold back the stock's capacity to grow in value extensively due to the financial leverage and the inherent risk it carries. Moreover, cash flow analysis portrays a company able to generate a positive operating cash flow, an encouraging sign for maintaining business operations and potentially mitigating some financial strain.
Analyst expectations suggest average estimates that tilt toward the optimistic side for the next year, indicating potential earnings growth. Yet, the negative growth estimates for the upcoming quarters must be accounted for, as they might paint a more turbulent short-term financial landscape. This mixture of positive earnings forecasts and anticipated short-term earnings contractions complicates the outlook.
Lastly, considering the risk-adjusted performance measures, which are notably poor, as indicated by substantially negative Sharpe, Sortino, Treynor, and Calmar ratios, caution is crucial. These ratios allude to a lackluster past performance when set against the risk taken, which may sway investor sentiment.
In conclusion, the potential for short-term gains exists, primarily driven by fundamental business performance and tentative technical recovery signals. However, considerable risk factors should temper investor expectations, with adverse financial ratios warning of possible continued volatility. Recommendations include monitoring upcoming earnings reports, industry-specific news, and subsequent technical indicator changes to ascertain the sustainability of any positive price movements. Be vigilant of any signs of financial stress or increased bearish volume that may undermine potential growth.
| Dependent Variable | y |
| R-squared | 0.226 |
| Adjusted R-squared | 0.226 |
| F-statistic | 367.1 |
| Prob (F-statistic) | 5.51e-72 |
| Log-Likelihood | -3,514.1 |
| No. Observations | 1,257 |
| AIC | 7,032 |
| BIC | 7,043 |
| Coefficient | 1.6278 |
| Standard Error | 0.085 |
| t-value | 19.161 |
| P>|t| | 0.000 |
| 95% Conf. Interval Lower Bound | 1.461 |
| 95% Conf. Interval Upper Bound | 1.794 |
| Omnibus | 332.961 |
| Prob(Omnibus) | 0.000 |
| Skew | -0.505 |
| Kurtosis | 17.998 |
| Durbin-Watson | 1.848 |
| Condition No. | 1.32 |
| Alpha | 0.0115 |
| Beta | 1.6278 |
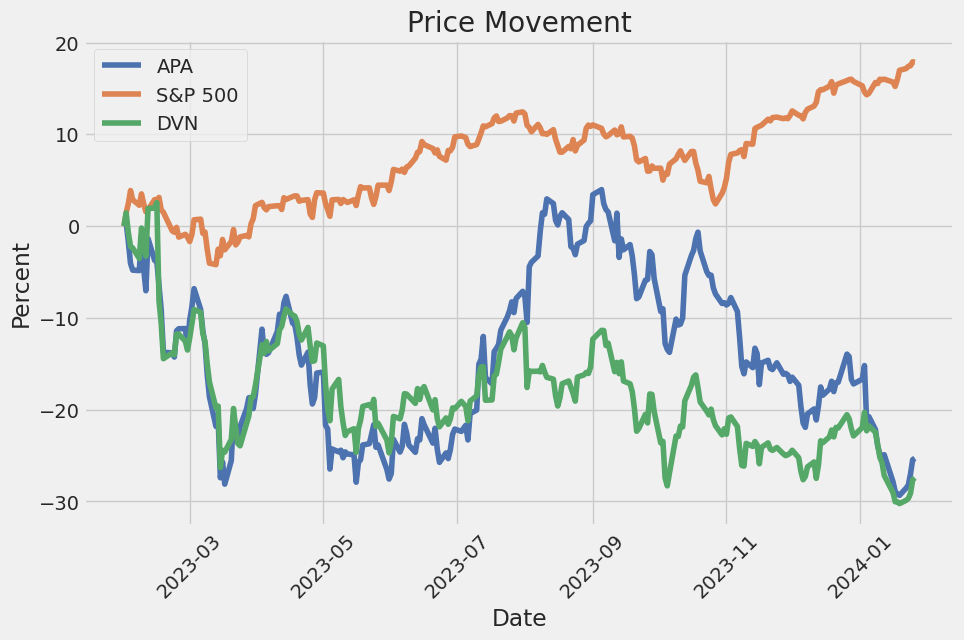
The linear regression model indicates the relationship between APA (the stock of APA Corporation) and SPY (an ETF that tracks the S&P 500 and represents the market). With an alpha of 0.0115, the model suggests that, on average, APA has a small positive performance offset relative to the movement predicted by SPY. This performance, not explained by the market variation, is marginal but positive. The beta value is 1.6278, showing that APA is more volatile than the market; when SPY moves by 1 percent, APA is expected to move by approximately 1.628 percent in the same direction.
The R-squared value of 0.226 indicates that approximately 22.6% of the variability in APA's returns is explained by the variation in SPY's returns, leaving a considerable amount of variance unaccounted for by the market's movements. The model's F-statistic is 367.1 with an associated p-value that is practically zero, suggesting the regression model is statistically significant and that there is a very low probability that the observed relationship between APA and SPY is due to chance. However, it should be recognized that a notable amount of APA's return variation is due to other factors or inherent volatility in APA itself, not fully captured by SPY's movements.
APA Corporation's third quarter 2023 earnings call began with introductions by Gary Clark, Vice President of Investor Relations. The call layout was established with CEO and President John Christmann providing an overview, followed by insights from Steve Riney, Executive Vice President and CFO. The call included a Q&A session with other executives available to answer questions. APA Corporation's supplemental financial and operational information was made available on their Investor Relations website.
John Christmann shared that APA Corporation once again surpassed the upper range of their guidance for adjusted oil production, crediting successful execution and strong well performance in the Permian Basin. The North Sea operations met the high end of guidance helped by the Storr North well production ramp. Egyptian operations saw a smaller-than-expected growth in gross oil volumes. Overall, third-quarter reported oil volumes showed a significant year-over-year increase. Drilling activities in the U.S. and Egypt maintained a steady pace, while drilling in the North Sea was suspended, with efforts redirected towards safety, base production management, and asset maintenance. Additionally, there was a highlight on the successful appraisal drilling in Suriname with forward movement on FPSO development. The fourth quarter is expected to observe slightly lower production due to North Sea shut-ins, despite steady U.S. oil production and an anticipated modest increase in Egyptian operations. Christmann addressed challenges in Egypt's drilling program and increased work-over activity to manage a growing backlog.
Steve Riney provided a financial breakdown, reporting a consolidated net income under Generally Accepted Accounting Principles (GAAP) of $459 million or $1.49 per share. Adjusted net income, excluding one-time items, was at $410 million or $1.33 per share. Free cash flow was at $307 million for the quarter, with 32% returned to shareholders. He also commented on the impact of the Cheniere gas sales contract, which added $32 million in free cash flow for the quarter. Riney projected the contract to contribute significantly in the following quarter and into 2024. He indicated stronger production and free cash flow in the latter half of the year, staying on target with the year's guidance, and mentioned the ongoing focus on capital returns and debt reduction.
In the Q&A session, topics ranged from the North Sea production decline against free cash flow to updated timetables on Suriname's exploration and development. Questions on Egypt's stability and growth plans were addressed, as well as APA's broader exploration strategy, including new ventures like Alaska. Discussion encompassed Permian Basin operations, with interest in the Permian's growth potential and the strategic addition of a sixth rig. Egypt's operational increase was noted, and insights were provided on APA's capability to handle potential regional instability. The exploration budget received attention, with interest in how the proposed $150 million would be allocated beyond Suriname. The call ended with Christmann reiterating the successful appraisal in Suriname, growth in Egypt, and continued strong performance in the Permian, leading into 2024 with optimism.
During the third quarter of 2023, APA Corporation (APA) reported net income attributable to common stock of $459 million, or $1.49 per share. This performance is based on the consolidated financials as of September 30, 2023, which included various revenue streams, expenses, and derivative gains or losses. Total revenues for the quarter amounted to $2,309 million while operating expenses tallied up to $1,476 million. The net income before income taxes was $833 million. For the nine months ended September 30, 2023, the company's net income attributable to common stock was $1,082 million, or $3.50 per share.
APA's revenues are primarily derived from the production and sale of oil, gas, and natural gas liquids (NGLs), which amounted to $2,079 million for the quarter and $5,500 million for the nine-month period. Additional revenues came from purchased oil and gas sales, totaling $229 million and $612 million for the quarter and nine-month period, respectively. The company also realized both realized and unrealized gains and losses from its derivative instruments related to commodity prices and hedging activities.
Operating expenses were led by lease operating expenses, gathering, processing, and transmission costs, and purchased oil and gas costs. Depreciation, depletion, and amortization expenses for the nine-month period were significant at $1,117 million. General and administrative expenses for the quarter increased to $139 million. There were minor transaction, reorganization, and separation costs, asset retirement obligation accretion, and some impairments.
APA's financial statements account for its equity method investments, with a particular focus on the company's interest in Kinetik Holdings Inc. (Kinetik), in which APA recognized an investment using the fair value option. APA reported changes in fair value and gains from its equity method interest in Kinetik, which is recognized in its consolidated statement of operations. As of September 30, 2023, APA held an approximate 14 percent ownership interest in Kinetik.
The company's capital structure included long-term debt of $5,582 million after accounting for current maturities. APA's capital and financing activities also included a stock repurchase program, dividends declared and paid, treasury stock activity, and debt extinguishment.
APA has several legal and environmental matters ongoing, which includes pending lawsuits and claims from operations, acquisitions, and divestitures. These include matters related to environmental claims, breach of agreements, and asset divestiture disputes. APA estimates its potential liability and has recorded a contingency liability and decommissioning security assets in connection with these matters.
APA's equity position increased to a net of $1,078 million in shareholder's equity compared to the previous year-end. Noncontrolling interests amounted to $1,029 million, bringing the total equity to $2,107 million as of September 30, 2023.
The company's comprehensive income attributable to common stock was reported at $1,085 million for the nine months ended September 30, 2023. APA's cash and cash equivalents at the end of the period were $95 million, after considering the cash flows from operating, investing, and financing activities. The company also maintains a valuation allowance against its U.S. deferred tax assets and continues to assess the impact of tax legislation changes, including the Inflation Reduction Act of 2022 and related corporate taxes.
On January 4, 2024, APA Corporation, an established energy company, experienced a significant decline in its stock prices following a major acquisition announcement. The company's shares saw a reduction of more than 7% after the news of its agreement to acquire the smaller peer, Callon Petroleum. This transaction is significant, with an estimated value of approximately $4.5 billion, and it depicts a strategic move by APA in consolidating its position in the energy sector.
The acquisition comes at a time when the energy sector is dynamically shifting, with companies looking to expand their asset bases, improve efficiencies, and enhance their market competitiveness in the face of fluctuating energy prices and regulatory changes. Although the report does not delve into the specific details of how APA plans to integrate Callon's operations, it indicates a move towards industry consolidation, which is a common trend in markets that are either maturing or responding to external pressures.
APA Corporation has entered into a definitive agreement to acquire Callon Petroleum Company in an all-stock transaction. The deal, including Callon's net debt, entails APA acquiring Callon at a share exchange ratio of 1.0425 APA common stock for each share of Callon common stock. This is set to enhance APA's presence in the Permian Basin, complementing its existing assets with Callon's strong portfolio, notably almost 120,000 acres in the Delaware Basin.
The transaction is anticipated to be accretive across all key financial metrics, thus benefiting shareholders of both companies. The merger is expected to bring about efficiencies, with estimated annual synergies exceeding $150 million, which includes overhead, operational, and cost-of-capital savings.
APA's CEO and president, John J. Christmann IV, and Joe Gatto, Callon's president and CEO, have echoed positive sentiments regarding the acquisition, anticipating a boost in APA's market competitiveness. Post-closing, APA shareholders will own approximately 81% of the combined entity, with Callon shareholders owning the remaining 19%.
The transaction has received unanimous approval from both APA's and Callon's Boards of Directors. It is projected to close in the second quarter of 2024, contingent upon approval from both sets of shareholders and regulatory clearance.
APA Corporation (NASDAQ:APA), maintaining its commitment to shareholder returns, announced on January 5, 2024, that it would continue rewarding its shareholders with a dividend payout. The company plans a distribution of $0.25 per share on February 22, with the dividend yield standing at 2.9%. APA's dividends are well-covered by earnings with a payout ratio estimated at around 16%.
The company has a track record of managing dividends, with a history of consistent payments and a modest growth rate that is appealing to investors looking for reliable income. APA has experienced robust earnings growth and retains the majority of its earnings for investment into future growth, which suggests the potential for further dividend increases.
In a recent announcement regarding APA Corporation's stock movements, Yahoo Finance's Julie Hyman and Josh Lipton noted the market activity surrounding APA's acquisition of Callon Petroleum, especially the decline in APA's share prices and the anticipated strategic benefits the merger is expected to bring, with enhanced capital returns to shareholders as a prime focus.
APA Corporation further expanded on its financial position by announcing that Stephen J. Riney, the then-executive vice president and CFO, has been appointed as president and CFO, effective January 9, 2024. Riney's expanded role is anticipated to leverage his expertise and experience for the continued growth and strategic direction of the company.
To provide a comprehensive financial update, on January 23, 2024, APA Corporation offered preliminary financial results for the fourth quarter of 2023. This included key operational figures, such as average realized prices for oil, natural gas, and NGL, a net gain on oil and gas purchases and sales before tax, which included gains on natural gas sold to Cheniere, and the company's share repurchase activities for that quarter.
The company also highlighted a reduction in its general and administrative expenses and its net debt position, demonstrating prudent financial management. Furthermore, APA scheduled a conference call to discuss its fourth-quarter results on February 22, offering additional insight into the company's performance and outlook.
APA's operations continue to span the exploration and production of oil and natural gas in the United States and internationally. For further details and financial analysis, interested parties are directed to access the original content of the articles, press releases, and the comprehensive information available on the APA Corporation website.
The volatility of APA Corporation from January 2019 to January 2024 can be summarized by noting the following key features from the Zero Mean - ARCH model results: Firstly, the model used is a Zero Mean model, implying that it does not predict the returns themselves but focuses solely on the volatility of returns. Secondly, the coefficient of 'omega' (often representing the long-term average volatility when mean is zero) is significantly large at 13.4092, indicating the potential for high levels of volatility. Lastly, the 'alpha[1]' coefficient (which measures the impact of past shocks on future volatility) is 0.3400, suggesting that past price movements have a substantial impact on the predicted volatility.
| Statistic Name | Statistic Value |
|---|---|
| R-squared | 0.000 |
| Log-Likelihood | -3,571.81 |
| AIC | 7,147.62 |
| BIC | 7,157.90 |
| No. Observations | 1,257 |
| omega | 13.4092 |
| alpha[1] | 0.3400 |
To assess the financial risk of a $10,000 investment in APA Corporation (APA) over a one-year period, a two-pronged analytical approach is employed. The assessment begins by applying a volatility modeling technique, traditionally used for capturing the temporal clustering of volatility, an important feature of financial time series data. This entails using past returns to model the variance of future returns, which varies over time and responds asymmetrically to shocks in financial markets.
By fitting the volatility model to APA Corporation's historical stock price data, we estimate the conditional variance for future periods. This estimated conditional variance is a crucial component in forecasting the volatility of the stock, which directly influences the risk profile of an investment in APA Corporation. High volatility indicates a wider range of potential stock price movements, both positive and negative.
On the other hand, machine learning predictions incorporate a broad set of input features that may include, but are not limited to, historical price data, financial indicators, and other relevant market data to anticipate future stock returns. The machine learning model in question, which operates akin to a forest consisting of many decision trees, is adept at capturing complex, non-linear relationships within the data that could impact APA Corporation's future stock price performance.
When these two methodologies are synergistically applied, the predicted returns from machine learning predictions can be adjusted for the estimated volatility derived from the volatility model. This integrated view provides a more nuanced perspective on the expected performance of the investment.
This approach leads to the calculation of the annual Value at Risk (VaR) at a 95% confidence interval, which quantifies the maximum expected loss over a set time frame, under normal market conditions. For APA Corporation, the calculated annual Value at Risk (VaR) for a $10,000 investment stands at $406.61. This figure suggests that there is a 5% chance that the investment could depreciate by more than $406.61 over the next year due to normal market fluctuations.
Such a metric is valuable for investors as it provides a quantifiable risk measure, enabling a better understanding of potential losses in the context of market uncertainty. This calculated VaR is instrumental in guiding risk management and investment decisions, as it allows investors to gauge their exposure and potential risk thresholds aligned with their individual risk appetites.
Similar Companies in Oil & Gas E&P:
Devon Energy Corporation (DVN), ConocoPhillips (COP), Diamondback Energy, Inc. (FANG), Occidental Petroleum Corporation (OXY), Pioneer Natural Resources Company (PXD), Hess Corporation (HES), Permian Resources Corporation (PR), EOG Resources, Inc. (EOG), Coterra Energy Inc. (CTRA), Range Resources Corporation (RRC), Murphy Oil Corporation (MUR), Exxon Mobil Corporation (XOM), Chevron Corporation (CVX), Report: Marathon Oil Corporation (MRO), Marathon Oil Corporation (MRO)
https://finance.yahoo.com/news/apa-corporation-acquire-callon-petroleum-110300689.html
https://finance.yahoo.com/m/300b4510-1e31-3354-83b6-07aa27a91360/apa-to-buy-callon-petroleum.html
https://finance.yahoo.com/video/peloton-quantumscape-apa-trending-tickers-212317087.html
https://finance.yahoo.com/news/apa-nasdaq-apa-affirmed-dividend-190444991.html
https://finance.yahoo.com/news/apa-promotes-stephen-j-riney-220300400.html
https://finance.yahoo.com/news/apa-corps-dividend-analysis-160611854.html
https://finance.yahoo.com/news/apa-corporation-provides-fourth-quarter-211500547.html
https://www.sec.gov/Archives/edgar/data/1841666/000178403123000025/apa-20230930.htm
Copyright © 2024 Tiny Computers (email@tinycomputers.io)
Report ID: E1hZLxX
Cost: $0.60145
https://reports.tinycomputers.io/APA/APA-2024-01-28.html Home