Baker Hughes Company (ticker: BKR)
2024-02-17
 Baker Hughes Company, traded under the ticker symbol BKR, stands as a pivotal player in the energy technology sector, offering a wide array of products and services that span across the entire value chain of oil and gas operations. With its origins dating back to the early 20th century, Baker Hughes has grown into a global powerhouse, providing innovative solutions for drilling, formation evaluation, completion, production, and reservoir consulting. The company operates in over 120 countries, leveraging its extensive expertise to enhance efficiency, reliability, and sustainability in the energy industry. Amidst the industry's transition towards renewable energy sources and the increasing demand for more environmentally friendly practices, Baker Hughes has also been adapting its offerings to align with these trends, integrating digital solutions and services aimed at reducing carbon footprint and enhancing operational efficiency. This evolution underscores Baker Hughes' commitment to leading the energy sector towards a more sustainable future, all while maintaining its dedication to delivering exceptional value to its customers, shareholders, and the broader communities it serves.
| Full Time Employees | 58,000 | Chairman, President & CEO Pay | $4,035,326 | Chief Financial Officer Pay | $2,141,784 |
| Executive VP of Oilfield Services & Equipment Pay | $1,870,609 | Dividend Rate | $0.84 | Dividend Yield | 2.88% |
| Payout Ratio | 40.84% | Five Year Avg Dividend Yield | 3.15% | Beta | 1.42 |
| Trailing PE | 15.26 | Forward PE | 11.57 | Volume | 7,397,960 |
| Average Volume | 8,608,950 | Average Volume 10 days | 10,239,960 | Market Cap | $29,379,700,736 |
| FiftyTwo Week Low | $26.12 | FiftyTwo Week High | $37.58 | Price to Sales Trailing 12 Months | 1.15 |
| Enterprise Value | $33,469,693,952 | Profit Margins | 7.62% | Shares Outstanding | 1,000,880,000 |
| Price to Book | 1.89 | Enterprise To Revenue | 1.31 | Enterprise To Ebitda | 8.97 |
| Earnings Quarterly Growth | 141.8% | Net Income To Common | $1,943,000,064 | Trailing Eps | 1.91 |
| Forward Eps | 2.52 | Peg Ratio | 0.48 | Total Cash | $2,646,000,128 |
| Total Debt | $6,789,000,192 | Total Revenue | $25,506,000,896 | Free Cashflow | $2,389,250,048 |
| Operating Cashflow | $3,062,000,128 | Earnings Growth | 136.6% | Revenue Growth | 15.7% |
| Gross Margins | 20.72% | Ebitda Margins | 14.64% | Operating Margins | 11.53% |
| Sharpe Ratio | -0.11911436548846362 | Sortino Ratio | -1.7475524370461581 |
| Treynor Ratio | -0.03671806288655735 | Calmar Ratio | -0.09862975489542854 |
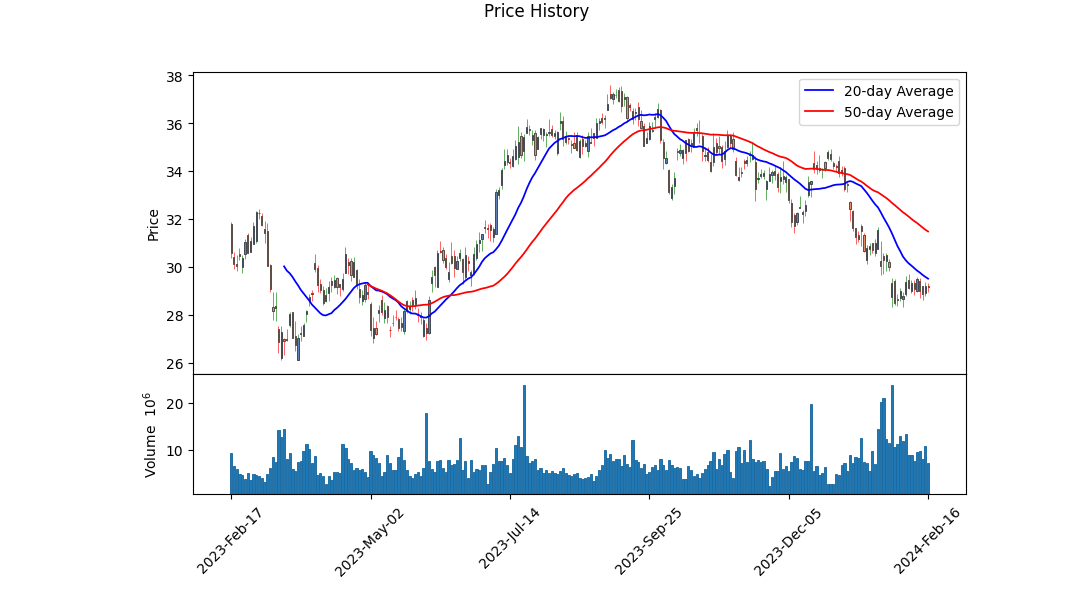
Analyzing the provided Technical Analysis data, alongside the fundamentals and ratios for BKR reveals a complex but insightful trajectory for the stock's future movements. While a detailed examination of the last trading days shows a fluctuating OBV (On-Balance Volume) indicator and the presence of a MACD (Moving Average Convergence Divergence) histogram indicating potential shifts in momentum, these tools must be interpreted within a broader context.
The companys address to fundamentals is pivotal in guiding sentiment. The outlined growth margins, alongside the EBITDA margins and operating margins, showcase a company that, despite challenges, maintains a level of operational efficiency. The company's strategic location and involvement in a key industry are underscored by solid gross margins at 0.20725 and an operating margin of 0.11529.
Furthermore, the negative Sharpe, Sortino, Treynor, and Calmar ratios indicate concerns regarding the risk-adjusted returns of BKR. Specifically, the negative Sharpe ratio (-0.11911436548846362) illustrates that the risk taken on by investors has not been rewarded comparably with the returns seen, highlighting a period of volatility and underperformance against a risk-free benchmark. The Sortino ratio at -1.7475524370461581 further emphasizes this underperformance, specifically in the context of negative returns, suggesting that the downside risk has been significant.
The financial health, as depicted through the balance sheets and cash flows, alongside the analyst expectations, forms the core of our outlook. The balance sheets reveal a comprehensive picture of the companys financial standing. Despite a notable level of net debt at $3,375,000,000, the company's ability to maintain operational revenue reflects resilience. The cash flow statements further strengthen this perspective, with a notable free cash flow, indicating healthy liquidity.
The analysts expectations depict an optimistic future with an average earnings estimate increase for the next year (2025) and projected sales growth. Specifically, the growth estimates suggest a bullish view on BKR's performance in the coming quarters, with a current year growth estimate at 26.20% and a next-year estimate at 24.80%. This optimistic outlook, bolstered by recent upward revisions in EPS estimates, sets a positive tone for BKRs stock price movement in the next few months.
Considering these factors, the next few months could witness a gradual improvement in BKRs stock price, supported by strengthening fundamentals and analyst optimism. However, the negative risk-adjusted return ratios remind us of the need for vigilance against underlying volatility and potential market uncertainties. The trajectory of the OBV and MACD indicators, alongside an improving fundamental backdrop, suggests potential for recovery and growth, albeit with cautious optimism given the broader market context and inherent risk factors documented in the ratios. Investors and stakeholders would do well to monitor these developments closely, as they could significantly influence the stock's performance heading into the subsequent quarters.
In our analysis of Baker Hughes Company (BKR), we utilized key financial metrics to assess its investment attractiveness. A pivotal metric, the Return on Capital (ROC), came in at 13.33%. This figure signifies how effective the company has been in deploying its capital to generate profits, standing as an indicator of the firm's efficiency in yielding returns from its investments. An ROC of this magnitude suggests that Baker Hughes is managing its capital well, generating a commendable level of profit relative to the capital invested. On the other hand, the earnings yield, another essential metric, was calculated to be 6.62%. This ratio, obtained by inverting the price-to-earnings ratio, offers insight into the relationship between the company's earnings and its stock price, serving as a measure of profitability from the investor's standpoint. An earnings yield of over 6% implies that Baker Hughes is generating a reasonable amount of earnings compared to its share price, which could be attractive to investors looking for returns in the form of earnings relative to their investment in the stock. Collectively, these metrics provide a snapshot of Baker Hughes' financial performance and potential attractiveness as an investment, suggesting a solid performance in terms of capital efficiency and earnings generation.
Given the metrics calculated for Baker Hughes Company (BKR) and applying Benjamin Graham's principles from "The Intelligent Investor," we can evaluate the company's attractiveness as a potential investment. Let's assess each of the key metrics in relation to Graham's criteria:
- Price-to-Earnings (P/E) Ratio:
- BKR's P/E Ratio: 93.03
- Graham's Criteria: Prefers stocks with low P/E ratios compared to their industry peers.
-
Analysis: BKR's P/E ratio of 93.03 is considerably high, indicating that the stock is likely overvalued based on its current earnings. This would typically not meet Graham's criteria for a value investment unless the industry average P/E ratio (which has not been provided) is significantly higher. However, without the industry P/E ratio for comparison, we cannot make a conclusive judgment, but on the surface, this metric suggests caution.
-
Price-to-Book (P/B) Ratio:
- BKR's P/B Ratio: 0.79
- Graham's Criteria: Often looked for stocks trading below their book value.
-
Analysis: With a P/B ratio under 1, BKR is trading below its book value, which aligns with Graham's preference for finding undervalued stocks. This could indicate a potential margin of safety for investors, making it potentially attractive from a value investing standpoint.
-
Debt-to-Equity Ratio:
- BKR's Debt-to-Equity Ratio: 0.39
- Graham's Criteria: Preferred companies with a low debt-to-equity ratio.
-
Analysis: BKR's debt-to-equity ratio of 0.39 is relatively low, suggesting that the company is not overly reliant on debt to finance its operations. This aligns with Graham's principle of lower financial risk, potentially making BKR an attractive investment option from a financial stability perspective.
-
Current and Quick Ratios:
- BKR's Current Ratio: 1.25
- BKR's Quick Ratio: 1.25
- Graham's Criteria: Looked at these ratios to assess a company's ability to pay off its short-term liabilities with its short-term assets.
-
Analysis: Both the current and quick ratios for BKR are above 1, indicating that the company has more than enough current assets to cover its short-term liabilities. This suggests financial stability and meets Graham's criteria for liquidity.
-
Earnings Growth:
- While we do not have the specific figures for BKR's earnings growth over a period of years, Graham would look for consistent earnings growth as a sign of a company's long-term prospects.
Based on the above analysis, Baker Hughes Company (BKR) demonstrates some desirable attributes according to Benjamin Graham's investment principles, such as a low P/B ratio and favorable liquidity ratios, indicating financial stability and potential undervaluation. However, the high P/E ratio is a significant point of concern, suggesting the stock may be overvalued on an earnings basis, unless justified by a comparably high industry average. Investors using Graham's approach would need to weigh these factors carefully, potentially considering the stock's earnings growth history and industry P/E comparisons for a more comprehensive assessment.Analyzing the financial statements of Baker Hughes Company involves a thorough examination of the firm's overall health, performance, and strategic direction using reported financial data. The following analysis reflects an interpretation of provided financial information for the period ending December 31, 2023, and earlier periods.
Revenue and Operating Income
Baker Hughes Company has reported significant figures concerning revenue and operating income. The detailed information from different periods shows fluctuations in revenue and operating income, reflecting the company's performance across various fiscal years. It's important to note the substantial revenue from contracts with customers, which forms a significant part of the companys income.
Costs and Expenses
The costs of goods and services sold, along with selling, general, and administrative expenses, play critical roles in determining the company's profitability. For instance, the cost of goods and services sold has a direct impact on the gross margin. Restructuring, impairment, and other costs, as indicated in the data, also influence the net income by adding variability to the operating expenses.
Net Income and Comprehensive Income
The net income or loss provides insight into the company's overall profitability after subtracting all expenses from revenues. The fluctuation in net income across various quarters and fiscal years suggests varying profitability. Other comprehensive income adjustments reflect external adjustments not directly related to the business operations, such as foreign currency translation adjustments and pension-related adjustments, which affect the equity section of the balance sheet.
Assets, Liabilities, and Equity
The company's assets, including receivables, inventory, property, plant, and equipment, and intangible assets, represent the resources controlled by Baker Hughes, which are expected to produce future economic benefits. Liabilities, encompassing accounts payable, debt, and other liabilities, represent obligations. The equity section, including retained earnings and accumulated other comprehensive income (or loss), indicates the residual interest in the assets of the company after deducting liabilities. The balance between assets, liabilities, and equity is crucial for assessing the financial health of the company.
Cash Flow Activities
Net cash provided by operating activities is a critical indicator of the company's ability to generate cash from its core business operations. Investing activities, including payments to acquire productive assets and proceeds from the sale of assets, reflect the company's growth and capital expenditure strategy. Financing activities, such as proceeds from debt and repayment of borrowings, dividends paid, and stock repurchases, indicate how the company finances its operations and growth through capital markets.
Key Observations and Strategic Insights
- Baker Hughes Company has navigated through various financial conditions, as reflected in its revenue, operating income, and net income across different periods.
- The companys strategy in managing its cost of goods sold and operating expenses directly influences its profitability.
- Assets management, particularly in receivables, inventory, and property acquisition, demonstrates the companys operational efficiency and investment in growth.
- The fluctuating net income underlines the impact of both internal operational factors and external economic conditions on the company's performance.
- Baker Hughes Companys strategy concerning cash flow from operating activities, investment in assets, and financing decisions reveals its approach to sustaining operations, funding expansion, and managing capital structure for shareholder value maximization.
Overall, the financial statements of Baker Hughes Company outline its financial performance, asset management efficiency, profitability measures, and strategic financing decisions, providing stakeholders with a comprehensive view of the company's financial health and operational success over the analyzed periods.Given the detailed history of dividend payments, it is clear that this company, represented by the symbol 'BKR', has consistently declared and paid dividends to its shareholders over an extended period.
Key Observations:
-
Consistent Payments: The company has a long history of regularly paying dividends, which speaks to its financial stability and commitment to returning value to shareholders. This aligns with Benjamin Graham's criterion emphasizing the importance of a company's dividend record as part of its investment attractiveness.
-
Incremental Increases: On several occasions, the dividend amount has been increased, indicating the company's growing profitability and its ability to share this growth with its shareholders. For instance, the dividend has gradually increased from $0.115 in 1987 to $0.21 in 2024. This gradual increase can be viewed positively by investors looking for growth in addition to stability.
-
Exceptional Adjustment: An anomaly in the data shows a dramatic increase in the adjusted dividend to 17.5 for a single payment on July 5, 2017. Without more context, this might be seen as an extraordinary dividend or possibly a special distribution, which could indicate a one-time event or adjustment rather than typical operational dividend growth.
-
Steady Growth: The general trend of dividend growth, with few exceptions, suggests a steady operational performance. Despite the economic cycles, the company has maintained a policy of sharing profits with shareholders, which can be reassuring from an investment perspective.
Investment Consideration: For a follower of Benjamin Graham's investment philosophies, such a consistent and growing dividend record could make BKR an attractive investment. The company's ability to maintain and gradually increase dividends over time demonstrates financial health and stable growth, important factors for conservative investors focused on long-term value investing. However, it is also crucial to consider other financial metrics and company fundamentals, beyond just the dividend record, to make a well-informed investment decision.
| Statistic Name | Statistic Value |
| R-squared | 0.299 |
| Adj. R-squared | 0.299 |
| F-statistic | 536.3 |
| Prob (F-statistic) | 4.36e-99 |
| Log-Likelihood | -2873.4 |
| AIC | 5751 |
| BIC | 5761 |
| coef (const) | -0.0109 |
| coef | 1.1787 |
| std err (const) | 0.067 |
| t (const) | -0.163 |
| P>|t| (const) | 0.871 |
| [0.025 0.975] (const) | -0.143 0.121 |
| Omnibus | 88.689 |
| Prob(Omnibus) | 0.000 |
| Jarque-Bera (JB) | 419.064 |
| Skew | 0.028 |
| Kurtosis | 5.827 |
| Cond. No. | 1.32 |
The regression analysis between BKR and SPY indicates a positive but relatively moderate relationship, with an R-squared value of 0.299. This suggests that approximately 29.9% of the variation in BKR can be explained by movements in SPY. The adjusted R-squared corroborates this interpretation, maintaining the same value, which indicates the model's explanatory power is adequately represented even after the adjustment for the number of predictors in the model. The F-statistic of 536.3 with a very small Prob (F-statistic) evidences statistical significance, implying the model fits are significantly better than a model without independent variables.
The coefficients provide direct insight into the nature of the relationship between BKR and SPY. The beta coefficient of 1.1787 suggests that for each one-unit change in SPY, BKR is expected to change by approximately 1.1787 units in the same direction, holding all else constant. However, the alpha or intercept value of -0.0109, while ostensibly indicating a slight negative offset, is not statistically significant, as evidenced by its t-value and P-value (t = -0.163, P > |t| = 0.871). This insignificance of alpha suggests that when SPY is zero, the expected value of BKR's movement does not significantly deviate from zero, after accounting for the model's parameters.
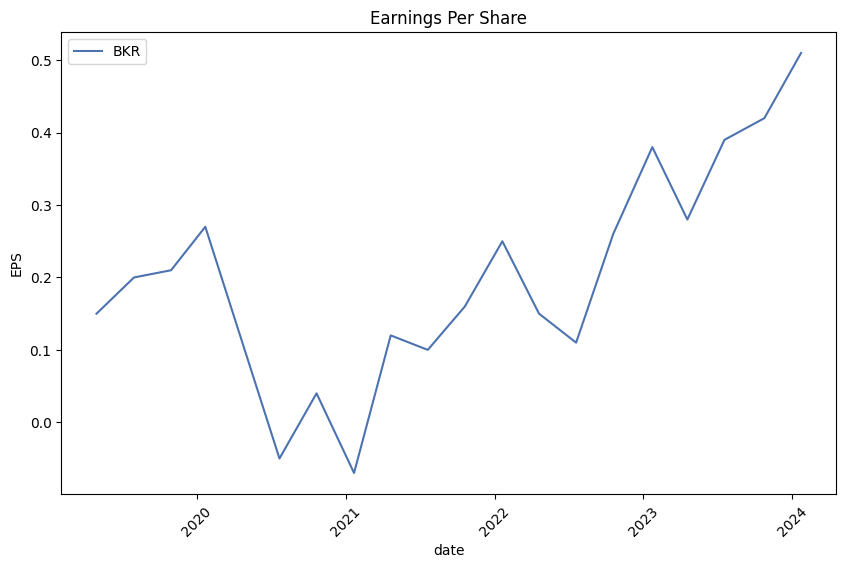
The Baker Hughes Company's fourth quarter and full-year 2023 earnings call highlighted the company's successful year and optimistic outlook. Lorenzo Simonelli, Chairman and CEO, summarized 2023 as pivotal, witnessing a strategic transformation with a $150 million cost reduction, a realignment of the IET business, and further streamlining of the OFSE business. The company reported record financial metrics across orders, revenue, EBITDA, EPS, free cash flow, and returns. Adjusted EBITDA rose 26% year-over-year with a consecutive third year of double-digit increases. The total company orders increased by 14% year-over-year, with significant growth in New Energy orders and SSPS orders. These results underscore the company's strong market position and operational improvements since 2022.
Discussing the fourth quarter specifically, Simonelli highlighted the $1.09 billion adjusted EBITDA exceeding expectations, a testament to the company's continued operational improvement and cost-saving measures. Free cash flow for the quarter stood out at $633 million, leading to a full-year free cash flow conversion of 54%. Orders in the IET segment remained strong, along with over $1 billion in CSA commitments. The OFSE segment evidenced notable margin improvement, with segment EBITDA margins reaching record levels. The discussion also touched on macroeconomic conditions, including weakened oil demand and geopolitical risks. However, Baker Hughes still forecasts growth in OFSE markets and maintains a healthy international development plan despite potential risks.
In terms of long-term market prospects, Simonelli expressed confidence in the LNG market's outlook despite recent price weaknesses, pointing to strong LNG demand and tight market utilization rates. He highlighted the global move towards cleaner energy sources potentially benefiting LNG as natural gas replaces coal in many Asian regions. Baker Hughes was awarded contracts, including the electric liquefaction systems for the Ruwais LNG project in the UAE, reflecting the companys competitive edge in providing advanced LNG solutions. The forecast for increasing LNG demand and nameplate capacity signals ongoing opportunities for Baker Hughes to grow its Gas Tech equipment and services.
Looking forward, Baker Hughes aims to capitalize on new energy developments and digital innovations within the OFSE and IET segments. Simonelli emphasized the company's strategy for peer-leading growth, leveraging a diverse technology portfolio spanning various energy and industrial markets. The approach centers on an all-of-the-above energy strategy, preparing the company to thrive regardless of the pace of the energy transition. As Baker Hughes continues to drive operational excellence and market penetration, it sets a robust foundation for sustained growth and margin improvements in the years to come.
ctivity in OFSE and IET. OFSE increased $1,755 million and IET increased $1,665 million. Total segment operating income increased $608 million, driven by growth in both OFSE and IET segments.
Oilfield Services & Equipment (OFSE) revenue of $11,405 million increased $1,755 million, or 18%, primarily due to increased international activity. North America revenue was $3,097 million, an increase of $364 million, and international revenue was $8,308 million, an increase of $1,392 million, driven by volume growth in all regions, particularly the Middle East/Asia and Latin America regions. OFSE segment operating income was $1,253 million, up from $785 million, driven by higher volume, improved cost productivity, cost-out initiatives, and price improvements, partially offset by cost inflation.
Industrial & Energy Technology (IET) revenue of $7,267 million increased $1,665 million, or 30%, with significant contributions from Gas Technology Equipment and Industrial Technology. IET segment operating income was $898 million, up from $758 million, driven by higher volume, price improvements, and cost-out initiatives, partially offset by unfavorable business mix, decreased cost productivity, inflationary pressures, and higher research and development costs associated with new energy investments.
Corporate expenses decreased by $24 million to $292 million, primarily due to savings related to corporate optimization.
Restructuring, impairment, and other charges were $161 million, compared to $676 million in the previous year, with the decrease primarily due to the charges related to the discontinuation of our Russia operations that occurred in 2022 and the impairment of certain long-lived assets in 2022.
Other non-operating income was $638 million, significantly higher compared to the previous year's $657 million loss, largely driven by gains from the change in fair value for certain equity investments.
Interest expense, net of interest income, decreased by $17 million to $171 million, primarily driven by higher interest income.
The provision for income taxes was $614 million. The effective tax rate diverged from the U.S. statutory tax rate primarily due to income in jurisdictions with higher tax rates and losses with no tax benefit due to valuation allowances, partially offset by income subject to U.S. tax at an effective rate below 21% due to valuation allowances.
Overall, the company's performance in both revenue growth and operational efficiency improvements reflect its strategic realignments and focus on cost management, despite challenging market conditions. The positive outcomes in OFSE and IET segments, along with significant gains from equity investments and effective cost control measures, contributed to the substantial increase in net income for the first nine months of 2023.
Baker Hughes Company, a leading force within the oilfield services sector, has been drawing considerable attention for its strategic positioning and potential for significant investor returns. As of October 6, 2023, the company was spotlighted by Seeking Alpha for its noteworthy dividend yields, a recognition stemming from its robust presence across the global energy markets. This focus on Baker Hughes underscores the investor search for stable dividends amidst variable market conditions, highlighting the companys resilience and adaptability in an industry marked by fluctuating oil prices and shifting energy demands.
Amid these variances, Baker Hughes has maintained a commitment to operational excellence and innovation, particularly in sustainability and efficient energy solutions. Its investments in technology and research are not just fortifying its current standing but are also paving the way for future growth and profitability. This forward-thinking approach is crucial as the energy sector evolves, with an increasing push towards sustainable energy practices.
In 2023, the company maintained strong performance despite global geopolitical tensions, promising significant growth for 2024. The discussion around geopolitical happenings, OPEC cuts, and the North American market consolidation sets the stage for understanding Baker Hughes' strategic moves. International markets promise growth, reflecting the company's extensive global footprint and the strategic importance of its operations outside the United States.
Further solidifying its future growth strategy is Baker Hughes' focus on the liquefied natural gas (LNG) sector, expected to see substantial order growth. Despite regulatory hurdles, the company remains optimistic about its LNG capabilities, emphasizing U.S. LNG's role in enhancing global energy security. This outlook is complemented by Baker Hughes' active role in advancing hydrogen technology and other clean energy initiatives, marking a significant stride towards diversifying the energy mix and promoting sustainability.
However, the start of 2024 saw a notable challenge, with Baker Hughes experiencing a significant decline in stock value, attributed to weaker-than-expected demand for oil and related services. This decrease emphasized the volatile nature of the energy sector and the impact of global economic and geopolitical tensions on the company. Despite these hurdles, Baker Hughes remains confident in its long-term growth trajectory, supported by its continuous expansion into new energy business segments.
The company's decision to increase its quarterly cash dividends in February 2024 reflects a strong financial position and confidence in its operational capabilities. This move aligns with current economic incentives for increased exploration and production activities, benefiting Baker Hughes' standing within the energy sector. Such strategic financial decisions not only benefit shareholders directly but also underscore Baker Hughes' operational strength and favorable industry dynamics.
In light of its extensive portfolio, technological leadership, and strategic focus on sustainability, Baker Hughes faces a landscape filled with opportunities and challenges. Its commitment to both traditional and renewable energy sources positions the company as a key player in the global energy transition. As the energy sector evolves, Baker Hughes ability to leverage its strengths and navigate market volatilities will be crucial for sustaining growth and delivering value to its stakeholders.
This narrative encapsulates Baker Hughes' journey and strategy within the shift towards a more sustainable and efficient energy future. The company's proactive steps toward embracing clean energy technologies, alongside maintaining its core oilfield services, highlight a balanced approach to growth and innovation. As a beacon in the energy sector, Baker Hughes paves the way forward, demonstrating the integral role of technology and strategic foresight in shaping the future of energy.
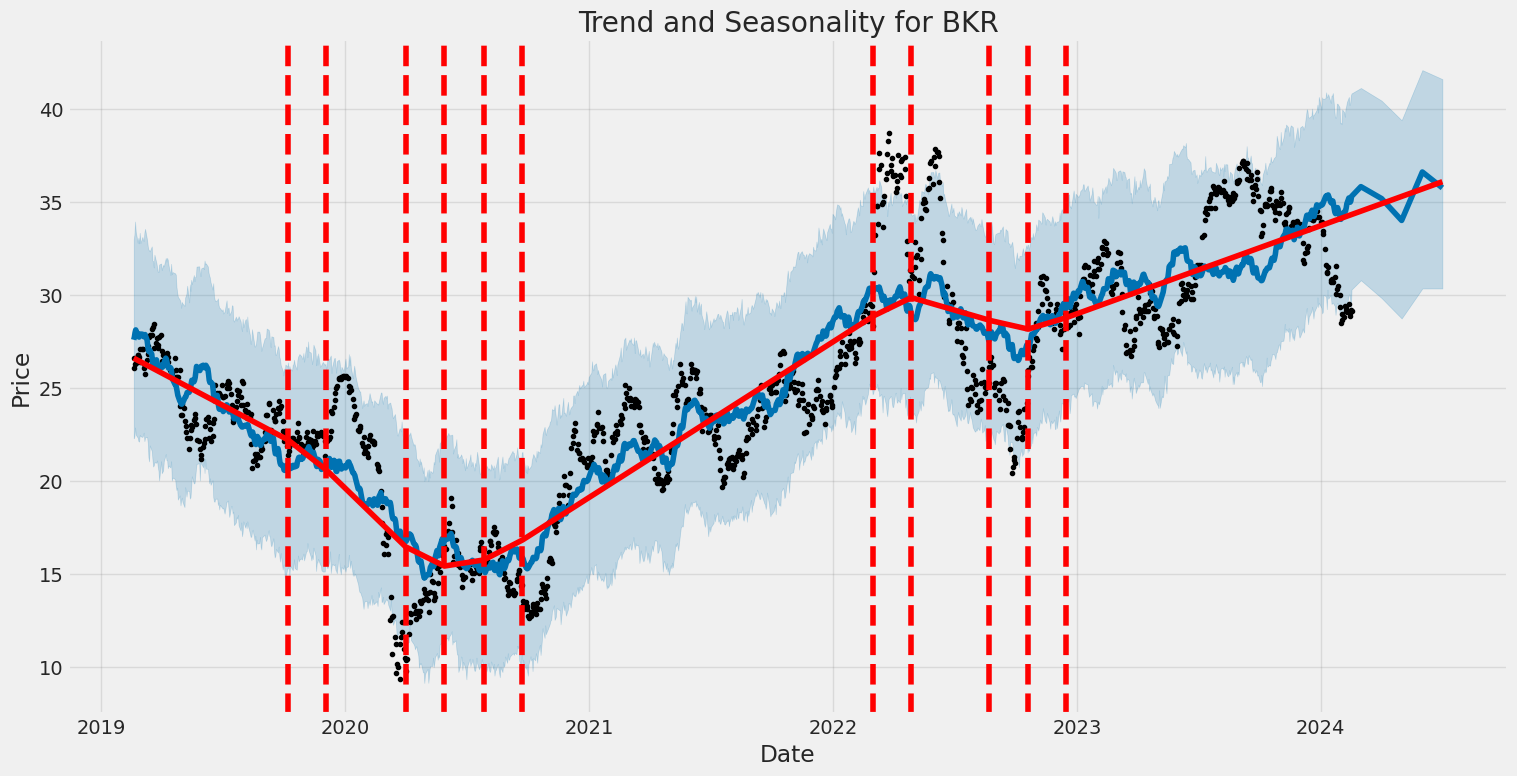
The Baker Hughes Company (BKR) has demonstrated significant volatility from February 19, 2019, to February 16, 2024, as indicated by an ARCH model analysis. Key features of this volatility include a considerable omega value of 5.3605, pointing to a high base level of volatility independent of past returns. Additionally, the alpha[1] parameter is 0.3295, suggesting that past returns significantly impact current volatility, highlighting the responsive nature of volatility to recent market movements.
| Statistic Name | Statistic Value |
|---|---|
| Log-Likelihood | -3014.71 |
| AIC | 6033.42 |
| BIC | 6043.69 |
| No. Observations | 1258 |
| omega | 5.3605 |
| alpha[1] | 0.3295 |
When analyzing the financial risk of investing $10,000 in Baker Hughes Company (BKR) over a one-year period, a combination of volatility modeling and machine learning predictions is employed to offer a nuanced perspective on potential investment outcomes. This multi-faceted approach allows for a thorough examination of both the underlying stock's volatility and the forecasting of its future returns, culminating in the computation of the Value at Risk (VaR) at a 95% confidence interval.
Volatility modeling is an essential tool in understanding the fluctuations in Baker Hughes Company's stock price. It is adept at capturing the persistent, time-varying nature of financial market volatility. Through this method, the historical price data of BKR stock is analyzed to estimate the level of variability one might expect moving forward. This process helps in identifying periods of higher risk, when the price movements are expected to be large, against those of lower risk, characterized by relatively stable prices.
In parallel, machine learning predictions provide a forward-looking perspective by analyzing trends and patterns within the historical price data of BKR stock. Utilizing advanced machine learning techniques, specifically a model based on decision trees that are capable of handling non-linear relationships and interactions in the data, future returns of the stock are predicted. This method adds a layer of prediction that complements the understanding gained from volatility modeling, offering insights into the potential future performance of the stock based on historical trends.
Combining these two approaches yields a comprehensive view of the risk associated with investing in Baker Hughes Company. The calculated Annual Value at Risk (VaR) at a 95% confidence level, amounting to $275.79, encapsulates this risk quantitatively. This figure represents the maximum expected loss over a one-year period, with a 95% confidence, for a $10,000 investment in BKR. It underscores the potential financial impact of the inherent volatility and predicted returns of the investment, highlighting the level of risk that an investor would be exposed to under normal market conditions.
Through this intricate blend of volatility modeling and machine learning predictions, investors gain a robust tool for assessing the risk of equity investments, specifically within the context of Baker Hughes Company. The calculated VaR at the 95% confidence interval serves as a critical metric, providing a dollar value estimation of the risk involved, thereby aiding investors in making informed decisions about their investment portfolios.
Analyzing the options chain for Baker Hughes Company (BKR) presents a fascinating scenario on identifying the most profitable call options based on their Greeks for an investor targeting a 5% increase over the current stock price. While each Greek provides valuable insight on different aspects of an option's behavior, a combination of these values can guide to potentially lucrative decisions.
Starting with the Delta measure, which indicates the sensitivity of an option's price to a $1 change in the underlying stock price, options with a higher delta such as 0.904 for the strike price of $24 expiring on 2024-03-15, or 0.894 for the strike at $13 expiring on 2025-01-17, imply a stronger price correlation with the stock, making them attractive to investors betting on stock price increases. However, considering our target of a 5% stock price increase, it's crucial to balance the delta with the option's cost, or premium, and its expiration date to ensure profitability within the desired timeframe.
Gamma shows the rate of change in delta for a $1 change in the stock price and is particularly important for options closer to the money (where the strike price is near the stock's current price). High gamma values such as 0.176 for the strike at $29 expiring on 2024-03-15 suggest greater sensitivity to stock price movements, potentially increasing profitability for short-term trades.
Vega measures sensitivity to volatility. Options with higher vega, such as 7.523 for the strike at $23 expiring on 2025-01-17, might be more profitable in volatile markets since their value tends to increase with volatility. Thus, for investors anticipating increased volatility, focusing on options with higher vega might be advantageous.
Theta, representing time decay, impacts all options, but those with a farther expiration date, such as the strike at $13 expiring on 2025-01-17 with a theta of -0.004, are less affected by the passage of time, making them more desirable for long-term strategies.
Rho, which measures sensitivity to interest rate changes, has a higher impact on options with longer times to expiration. For example, the strike at $13 expiring on 2025-01-17 has a rho of 8.13, indicating it could gain more value if interest rates rise, a secondary consideration for most retail investors but still worth noting.
Considering a balance of these Greeks, the call option for the strike price of $23 expiring on 2025-01-17 stands out due to its high delta of 0.872, indicating strong price movement sensitivity, and relatively high vega of 4.918, suggesting it could benefit from increased volatility. Additionally, its extended expiration offers strategic flexibility, allowing for a longer window to achieve or exceed the targeted 5% stock price increase. Despite its higher premium, this option's balance of Greeks suggests a solid potential for profitability under the right market conditions, especially for investors with a longer-term outlook or those expecting volatility to rise.
In conclusion, the most profitable options depend not only on their individual Greek values but also on the investor's strategy, market expectations, and the overall balance between risk and potential return. The identified call option represents a cautious yet optimistic approach, targeting a significant but attainable increase in the underlying stock price over an extended period.
Similar Companies in Oil & Gas Equipment & Services:
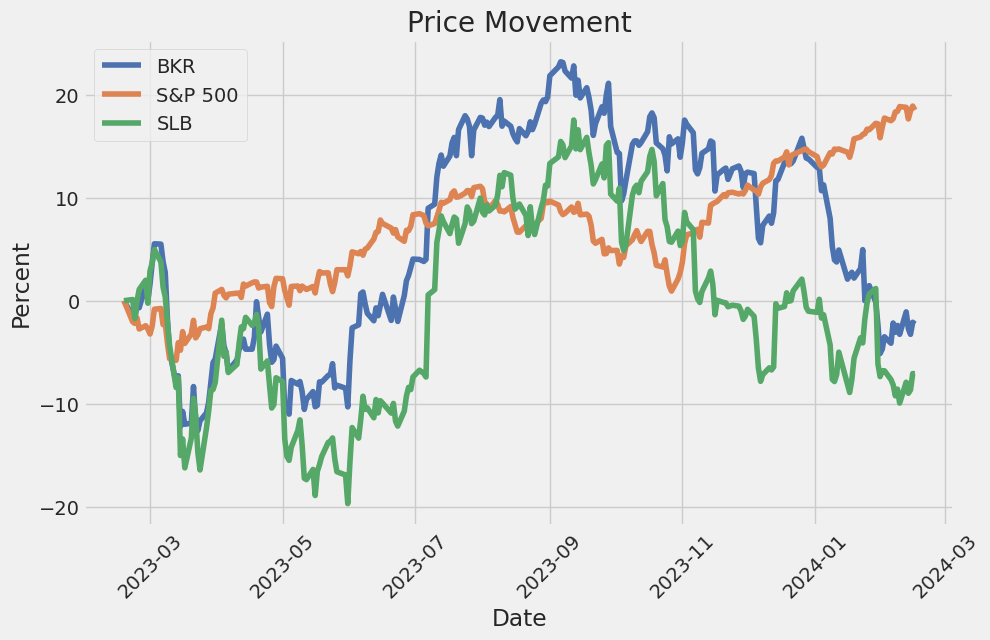
Report: Schlumberger Limited (SLB), Schlumberger Limited (SLB), NOV Inc. (NOV), Weatherford International plc (WFRD), Tenaris S.A. (TS), Halliburton Company (HAL), TechnipFMC plc (FTI), NOW Inc. (DNOW), ChampionX Corporation (CHX), Oceaneering International, Inc. (OII), Bristow Group Inc. (VTOL), RPC, Inc. (RES), Cactus, Inc. (WHD), Tidewater Inc. (TDW), Valaris Limited (VAL), Expro Group Holdings N.V. (XPRO)
https://www.youtube.com/watch?v=wo1NFC5EJ7k
https://www.youtube.com/watch?v=OD2P-7wval0
https://www.fool.com/investing/2024/02/05/heres-why-shares-of-baker-hughes-slumped-in-januar/
https://finance.yahoo.com/m/e93364eb-d8a7-3631-84ba-3a4118d76c6d/here%27s-why-shares-of-baker.html
https://finance.yahoo.com/news/beyond-balance-sheet-swot-reveals-051624724.html
https://finance.yahoo.com/news/baker-hughes-bkr-rewards-shareholders-145200162.html
https://finance.yahoo.com/news/baker-hughes-cos-dividend-analysis-100532587.html
https://finance.yahoo.com/news/permian-oil-drilling-rig-count-132300436.html
https://finance.yahoo.com/news/20-fastest-growing-energy-companies-075119638.html
https://finance.yahoo.com/news/zacks-analyst-blog-highlights-baker-110000926.html
https://finance.yahoo.com/news/heres-why-baker-hughes-bkr-144007168.html
https://www.sec.gov/Archives/edgar/data/1701605/000170160523000078/bkr-20230930.htm
Copyright © 2024 Tiny Computers (email@tinycomputers.io)
Report ID: URLPWL
Cost: $0.92633
https://reports.tinycomputers.io/BKR/BKR-2024-02-17.html Home