Chord Energy Corporation (ticker: CHRD)
2024-01-28
 Chord Energy Corporation (ticker: CHRD) is an independent oil and natural gas company with a strategic focus on exploration, development, and production within the energy sector. The company operates primarily within the United States, concentrating its efforts on acquiring high-quality assets and leveraging advanced technologies to enhance its operational efficiencies and resource recovery. As of the latest data available, CHRD possesses a robust portfolio of hydrocarbon resources, positioning it well within the competitive landscape of the energy industry. Its financial performance, market capitalization, and share price reflect investors' confidence in its business strategies and future growth potential. Chord Energy Corporation remains committed to adhering to environmental regulations and striving for sustainability in its operations as part of a broader industry trend towards responsible energy production. The company's adaptability to market conditions, dedication to safety, and operational excellence are key drivers of its ongoing success and appeal to both shareholders and partners.
| Address 1 | 1001 Fannin Street | Address 2 | Suite 1500 | City | Houston |
| State | TX | ZIP Code | 77002 | Country | United States |
| Phone | 281 404 9500 | Fax | 281 404 9501 | Website | https://www.chordenergy.com |
| Industry | Oil & Gas E&P | Sector | Energy | Full Time Employees | 531 |
| Previous Close | 154.60 | Open | 155.06 | Day Low | 152.32 |
| Day High | 155.06 | Dividend Rate | 11.88 | Dividend Yield | 7.68% |
| Payout Ratio | 54.67% | Beta | 0.938 | Trailing PE | 6.48 |
| Forward PE | 7.57 | Volume | 374,287 | Average Volume | 458,955 |
| Average Volume (10 days) | 488,880 | Bid | 148.77 | Ask | 154.84 |
| Bid Size | 900 | Ask Size | 1,000 | Market Cap | 6,387,419,648 |
| 52 Week Low | 117.05 | 52 Week High | 175.20 | Price to Sales (TTM) | 1.73 |
| 50 Day Average | 160.53 | 200 Day Average | 155.80 | Trailing Annual Dividend Rate | 11.88 |
| Trailing Annual Dividend Yield | 7.68% | Enterprise Value | 6,553,616,896 | Profit Margins | 29.83% |
| Float Shares | 39,402,324 | Shares Outstanding | 41,278,400 | Shares Short | 1,776,479 |
| Shares Percent Shares Out | 4.3% | Held Percent Insiders | 1.321% | Held Percent Institutions | 102.572% |
| Short Ratio | 3.87 | Short Percent of Float | 4.33% | Book Value | 119.43 |
| Price to Book | 1.30 | Last Fiscal Year End | 1672444800 | Next Fiscal Year End | 1703980800 |
| Most Recent Quarter | 1696032000 | Earnings Quarterly Growth | -76.3% | Net Income to Common | 1,097,478,016 |
| Trailing EPS | 23.88 | Forward EPS | 20.45 | PEG Ratio | 1.05 |
| Enterprise to Revenue | 1.78 | Enterprise to EBITDA | 3.30 | 52 Week Change | 10.29% |
| S&P 52 Week Change | 21.73% | Last Dividend Value | 2.50 | Current Price | 154.74 |
| Target High Price | 224.00 | Target Low Price | 160.00 | Target Mean Price | 184.25 |
| Target Median Price | 180.00 | Recommendation Mean | 2.00 (Buy) | Number of Analyst Opinions | 12 |
| Total Cash | 264,966,000 | Total Cash Per Share | 6.42 | EBITDA | 1,987,756,032 |
| Total Debt | 431,159,008 | Quick Ratio | 0.93 | Current Ratio | 1.02 |
| Total Revenue | 3,685,969,920 | Debt to Equity | 8.73 | Revenue Per Share | 88.51 |
| Return on Assets | 13.13% | Return on Equity | 23.37% | Free Cash Flow | 192,070,128 |
| Operating Cash Flow | 1,754,909,056 | Earnings Growth | -76.7% | Revenue Growth | -4.9% |
| Gross Margins | 57.31% | EBITDA Margins | 53.93% | Operating Margins | 25.37% |
| Sharpe Ratio | -13.161010548821393 | Sortino Ratio | -207.45386559405972 |
| Treynor Ratio | 0.22921470353763806 | Calmar Ratio | 1.2969011231921899 |
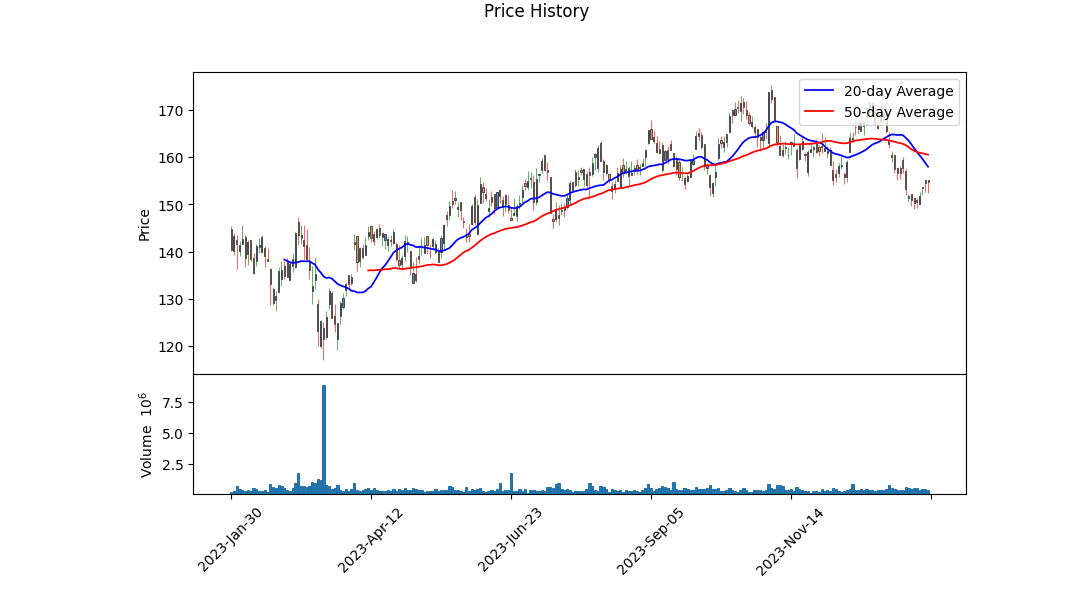
Technical Analysis when effectively applied is an art form that lets us anticipate future price movements by interpreting past market data. After examining the provided technical indicators, fundamental data, and balance sheet information for CHRD, I have identified trends and signals that offer a glimpse into potential future price movements.
The technical indicators revealed closing prices trending downwards over a span of several months, stabilizing near the end of the observed period. A negative On-Balance Volume (OBV) indicates that selling pressure has prevailed, as volume on down days has outpaced up days. The Moving Average Convergence Divergence (MACD) histogram presents a rise in values towards the end of the period but remains negative, suggesting a possible slowdown in the bearish momentum.
Fundamentals act as a backbone for long-term price trends. CHRD exhibits robust gross and EBITDA margins, indicating that the company is efficient at generating revenue. High margins often contribute to a bullish sentiment. However, the heavy negative risk-adjusted return ratios, such as Sharpe and Sortino, imply that the stock has underperformed relative to the level of risk taken by investors. This could deter risk-averse investors until the ratios improve. On a brighter note, a positive Treynor ratio indicates some level of excess returns when adjusted for systematic risk, and the Calmar ratio points to good performance relative to the maximum drawdown.
The balance sheet and cash flow statements of CHRD display mixed signals. While the company has seen free cash flow growth, debt repayment obligations also appear substantial. Despite this, the increasing End Cash Position is a testament to effective capital management that may reassure investors.
Analyst expectations, although being a lagging indicator, can't be ignored. The recent downward revision of EPS estimates for the next year likely reflects an adaptation to changing market conditions or company prospects. Moreover, significant negative growth estimates for the current and next quarters can impact sentiment.
Given all these observations, the most probable scenario is a potential reversal from the downtrend due to the slowing bearish momentum indicated by technical indicators, and the strong fundamentals in terms of profit margins. However, the risk-adjusted performance ratios and negative short-term growth estimates could continue to create headwinds, potentially limiting gains or contributing to price volatility over the next few months. Investors might anticipate some stabilization or slight corrective movements upwards, but the outlook appears to be weighed down by caution due to recent performance ratios and growth revisions, hinting at a conservative approach to the CHRD stock in the immediate term.
| Statistic Name | Statistic Value |
| R-squared | 0.000 |
| Adj. R-squared | -0.001 |
| F-statistic | 0.1718 |
| Prob (F-statistic) | 0.679 |
| Log-Likelihood | -10,063 |
| AIC | 20,130 |
| BIC | 20,140 |
| const (alpha) | 21.0450 |
| coef (beta) | -6.4492 |
The alpha () value in a linear regression model represents the intercept of the regression line, which is the expected value of the dependent variable when all the independent variables are zero. In the regression between CHRD and SPY, alpha is 21.0450, indicating that when SPY is at zero, the expected value of CHRD is approximately 21.0450. However, it is important to consider that such an interpretation might not be meaningful in a financial context, as the value of an index like SPY does not go to zero. The positive value of alpha suggests that CHRD has a baseline level that it may tend to achieve independently of the movement in SPY.
The overall fit of the regression model, as indicated by R-squared, is 0.000, which implies that the independent variable (SPY) does not explain any of the variability in the dependent variable (CHRD). This is further emphasized by the adjusted R-squared value being slightly negative (-0.001), taking into account the number of predictors in the model. The F-statistic of 0.1718 with a probability of 0.679 suggests that the model is not statistically significant, implying that the independent variable (SPY) is not a good predictor of CHRD's movements. The coefficient for SPY is -6.4492, indicating that for each unit increase in SPY, CHRD is expected to decrease by 6.4492 units, although this relationship is not statistically significant, given the high p-value.
In the Chord Energy's Q3 2023 Earnings Results Conference Call, the company's Chief Financial Officer, Michael Lou, opened by highlighting the forward-looking nature of their comments and the use of non-GAAP measures, before handing over to CEO Daniel Brown. Brown briefed listeners on the exceptional quarterly performance, with significantly exceeded volume expectations, resulting from accelerated schedules and strong well performance. The company brought 45 wells online, surpassing the number completed in the first half of the year and generating $207 million of adjusted free cash flow. Consistent with the capital return program, Chord returned 75% of this cash flow to shareholders through dividends and share repurchases. Brown also mentioned a new $750 million share repurchase authorization and discussed operational advancements, particularly the success with three-mile lateral wells, as well as the company's ESG efforts and the publication of its first sustainability report.
CFO Michael Lou provided detailed financial insights, noting strong oil volumes and pricing, with an increase in oil production guidance. Lou praised the Chord team for their efforts in the third quarter and gave details on operating costs such as lease operating expenses (LOE) and gathering and transportation costs (GPT). He also referred to reductions in cash G&A expenses, the completion of merger integrations, and the rise in DD&A per BOE due to acquisitions and reserve changes. Lou affirmed Chord had no cash taxes in the third quarter and expects taxes to be a small percentage of Q4 EBITDA. Discussions highlighted capital expectations for the full year and how share repurchases were bolstered by warrant exercises. Lou added that liquidity remained strong with a borrowing base of $2.5 billion and ended with projections for 2024, forecasting a maintenance capital program with flattish volumes relative to 2023.
The Q&A session with RBC Capital Markets' Scott Hanold touched upon the potential for positive contributions from the third mile in Chord's three-mile lateral wells, with confidence growing but understanding that it takes time to fully realize this outcome. The conversation extended to M&A strategy, with CEO Daniel Brown expressing openness to both in-basin and out-of-basin consolidation opportunities but emphasizing a higher bar for out-of-basin due to increased risks. Brown conveyed the company's flexibility in being either a consolidator or a consolidatee, focusing on the potential benefits of consolidation.
John Abbott of Bank of America inquired about the potential of four-mile laterals, and the response from the Chord team was affirmative, but the appropriate timing was not certain as they await more data from three-mile laterals. Abbott also questioned the implications of a changing decline rate for future capital expenditures. Danny Brown noted that a lower decline rate spurred by the three-mile lateral contribution would likely lead to increased capital efficiency. He projected that CapEx for maintaining production may trend downwards from 2024 levels, moving towards what was observed in the current year.
In his closing remarks, CEO Brown expressed gratitude to Chord employees for their commitment and performance, praising the strong execution in the third quarter and maintaining optimism for the rest of the year and into 2024. The call concluded with the operator's sign-off.
Operating and Financial Review of Chord Energy Corporation (CHRD)
Chord Energy Corporation (referred to herein as "the Company," "Chord," "we," "us," or "our") continues to be a major player in the independent exploration and production sector, focused on the Williston Basin. The Merger with Whiting, a historical oil and gas company specializing in development, production, and acquisition in the Rocky Mountain region, has expanded Chord's operational footprint. It's important to note that since the Merger on July 1, 2022, analysis and comparison of financial statements will consider Chord's operations and Whiting's consolidated financials.
In the third quarter of 2023, Chord's average daily production was notably oil-heavy at 176,003 barrels of oil equivalent per day (58% oil), achieving 101,356 barrels of oil per day. The company's exploration and production expenses amounted to $254.2 million, while Lease Operating Expenses (LOE) stood at $10.94 per barrel of oil equivalent in the same quarter. Net cash from operation was robust at $399.5 million for Q3 2023, accompanied by a notable net income of $209.1 million.
Chord emphasizes shareholder return, having implemented numerous initiatives throughout 2023. Specifically, they paid a cash dividend of $1.36 per share in Q3 2023 and instituted a substantial share repurchase program, totaling $112.3 million in buybacks for the quarter, with an additional authorization of a $750 million repurchase program.
Revenues have grown year-over-year for the nine months ended September 30, 2023, with the increase stemming largely from the expansion due to the Merger. The company reported a significant boost in crude oil revenues by $445.7 million to $2,074.7 million for the said period in comparison to the previous year. NGL and natural gas revenues saw an overall decrease primarily due to lower prices despite higher production volumes from operations. Purchased oil and gas sales also rose by $87.1 million to $629.7 million compared to the same period last year.
Operating expenses for Q3 2023 scaled up across most categories, including Lease Operating Expenses (LOE), Gathering, Processing and Transportation (GPT) expenses, Purchased Oil and Gas expenses, Production taxes, and General and Administrative expenses. Depreciation, depletion, and amortization reached $160.3 million in Q3 2023, and there was an exploration and impairment charge, reflective of activities surrounding well development and strategic divestitures of non-core assets.
Furthermore, Chord's attrition of its non-core assets, outside the Williston Basin resulted in an estimated net proceed of $38.7 million. The subsequent sale of these assets in Q3 2023 was confirmed at net proceeds of $33.1 million. Also noteworthy is the sale of certain non-core properties that were classified as held for sale during the end of September 2023 amounting to $4.1 million in net proceeds.
In terms of operational strategy, Chord prioritizes efficiency, performance, and environmental stewardship. This commitment is evidenced not only by its operational decisions and the active management of assets but also by its approach to generating shareholder returns, maintaining liquidity, and adherence to fiscal prudence.
This analysis is based on the 10-Q filing dated for the period ending September 30, 2023, and does not provide an overview of all aspects of the report such as details related to risks or investment analysis. It excludes comparative analysis with other companies. For comprehensive insight, the full document should be reviewed.
Chord Energy Corporation (NASDAQ: CHRD), a leading enterprise specializing in oil and gas exploration and production, has recently been highlighted as a promising investment option according to a report by Soumya Eswaran from Yahoo Finance on January 17, 2024. This recognition was echoed in the Madison Small Cap Fund's fourth-quarter 2023 investor letter, in which they outlined several compelling reasons to consider Chord Energy for investment.
The company, headquartered in Houston, Texas, is the outcome of a merger between Oasis and Whiting Petroleum. It was trading at $153.22 per share as of January 16, 2024, which despite a one-month decline of 7.94%, marked a substantial 14.10% appreciation over the previous 52 weeks, leading to a market capitalization of approximately $6.325 billion.
The Madison Small Cap Fund has praised Chord Energy's business model, particularly its focus on operating within a single basin, the Bakken region, where the company can effectively leverage its size and scale to maximize returns. They anticipate a significant generation of free cash flow over the next few years, which is expected to support an attractive dividend yield of over 3%. The company's ability to deliver positive economic returns with oil prices above $55 per barrel further cushions it against fluctuations in commodity prices.
Additionally, Chord Energy's strategic positioning within the Bakken makes it an enticing candidate for acquisition by larger integrated energy companies. Despite not being listed among the 30 Most Popular Stocks Among Hedge Funds, the company gained interest from 38 hedge fund portfolios at the end of the third quarter, an increase from the previous quarter.
In the backdrop of general market performance, Chord Energy aligns with the positive trajectory of small-cap stocks, as indicated by the 14% rise in the Russell 2000 Index following favorable inflation reports. It should be noted that despite the small cap fund's return of 11.2%, slightly underperforming the index's 14.0% return, the year-to-date figures show a close alignment with market benchmarks.
Significant leadership changes have recently taken place within Chord Energy Corp., aiming to strengthen the company's direction and reinforce its industry position. Susan Cunningham succeeded Lynn A. Peterson as the Independent Chair of the Board of Directors on January 1, 2024. Cunningham's extensive experience in the oil and gas sector, particularly in environmental sustainability and progressive business strategies, brings a valuable perspective to Chord's Board, reflecting the company's commitment to responsible operations.
Moreover, Darrin Henke, as the new Executive Vice President and Chief Operating Officer from January 2, 2024, brings three decades of industry experience to the table, further solidifying Chord Energy's leadership structure. These strategic shifts are aligned with the company's focus on maintaining rigorous capital discipline and driving sustainable free cash flow, as disclosed in the announcement on PR Newswire.
Investigating the companys financial performance through Simply Wall St's analysis on January 9, 2024, reveals a robust financial foundation at Chord Energy. With an ROE of 22%, the company demonstrates an effective use of reinvested capital compared to its net income growth, which exceeds industry averages. A prudent profit reinvestment strategy is evident, enabling Chord Energy to grow while maintaining a balance between dividends and investment.
The recent trading activity by company insiders serves as an additional marker for potential investors. Michael Lou, the Executive Vice President and CFO, parted with 6,000 shares on January 4, 2024, underscoring a persistent insider selling trend. The reasoning behind these sales remains speculative, yet they inform the market's perception of the company's valuation, with the current P/E ratio suggesting Chord Energy's stock was valued on the lower end relative to the industry.
Lastly, another insider sale by Director Paul Korus on December 14, 2023, further indicates insider perspectives on the company's valuation. Korus's extensive experience in the energy sector suggests that such a decision is well-informed, even as the sale contributes to an established pattern of insider selling over the past year.
While these financial metrics and insider trading activities provide substantial information on Chord Energy's current standing and future outlook, they are just part of a larger set of factors that potential investors should consider before adjusting their investment strategy. It remains important to approach these data points cautiously and to supplement them with a broad, comprehensive analysis to make informed decisions about investing in Chord Energy Corporation.
The volatility of Chord Energy Corporation (CHRD) from January 29, 2019, to January 26, 2024, can be summarized as follows: The ARCH model indicates that there was little to no relationship between past returns and future volatility since the R-squared value is effectively zero. The volatility was not stable over time as suggested by the ARCH effect, with a significant estimated coefficient for the omega parameter. However, the model itself does not seem to fit very well, given the large standard errors and the p-values indicating that the volatility parameters are not statistically significant.
Several key features of the volatility can be inferred from the results:
-
Lack of Fit: The R-squared values being near zero suggests that this model does not explain much of the variability in the returns, which implies the data might exhibit random volatility that is not captured by past returns.
-
High Volatility: The parameter "omega," although not statistically significant, points to a potentially high level of baseline volatility in the CHRD stock.
-
Ineffectiveness of ARCH Terms: The alpha parameter, which measures the impact of past squared returns on current volatility, is effectively zero (with a highly insignificant p-value), suggesting that the ARCH model may not be well-suited for capturing the volatility dynamics of CHRD.
Here is the HTML table summarizing the model results:
| Statistic | Value |
|---|---|
| Mean Model | Zero Mean |
| R-squared | 0.000 |
| Adj. R-squared | 0.001 |
| Log-Likelihood | -10,256.8 |
| AIC | 20,517.6 |
| BIC | 20,527.9 |
| No. Observations | 1,257 |
| Df Residuals | 1,257 |
| Df Model | 0 |
| omega | 263,450 |
| alpha[1] | 2.7092e-12 |
Please insert this table into an HTML document to view it correctly.
To assess the financial risk of investing $10,000 in Chord Energy Corporation (CHRD) over a span of one year, an approach that integrates volatility modeling and machine learning predictions is applied.
Volatility modeling, in this context, serves as a tool for understanding and forecasting the stock's fluctuating price movements. This method captures the clustering of high and low volatilities over time, allowing for dynamic adjustments based on the stock's historical performance data. Through this model, one can estimate the level of risk associated with the investment by analyzing how the price volatility of CHRD stock has behaved in the past and projecting it into the future.
Machine learning predictions come into play by leveraging a data-driven algorithm to predict the future returns of CHRD. The model is trained on a host of features including historical stock data and possibly other financial indicators that could influence the returns. After training, the model aims to forecast future stock price movements, providing a potential outlook on the investments performance.
When combining these two methods, investors are equipped with a more nuanced understanding of the risks involved. By utilizing the volatility model, we can estimate the distribution of potential returns, and the machine learning algorithm aides in gauging the directional trends. Together, they offer a comprehensive view of how the stock could behave in the forthcoming year.
Focusing on the results yielded by these analytical methods, a significant figure to consider would be the Value at Risk (VaR) at a 95% confidence interval, which is determined to be $308.29 for the $10,000 investment in CHRD. This implies that there is a 95% chance that the investor would not lose more than $308.29 on their investment over a one-year period, under normal market conditions. This loss threshold provides a quantifiable risk measure that can inform the investor's decision-making process.
By interpreting this Value at Risk, the potential investor gains insight into the maximum expected loss and can compare this risk level against their personal risk tolerance and investment goals. The application of volatility modeling and machine learning predictions gives depth to this analysis, capturing both the historical volatility of the stock and leveraging advanced algorithms to forecast future stock returns. The integration of these methods provides a substantial framework for understanding and evaluating the risks associated with an investment in Chord Energy Corporation.
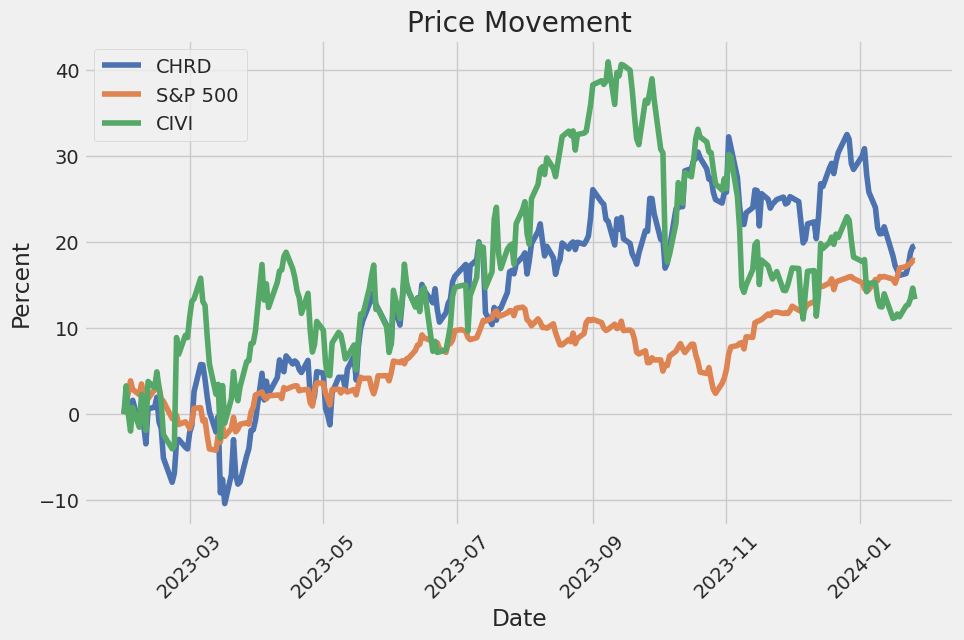
Similar Companies in Oil & Gas E&P:
Civitas Resources, Inc. (CIVI), Coterra Energy Inc. (CTRA), HF Sinclair Corporation (DINO), Magnolia Oil & Gas Corporation (MGY), ConocoPhillips (COP), EOG Resources, Inc. (EOG), Occidental Petroleum Corporation (OXY), Pioneer Natural Resources Company (PXD), Devon Energy Corporation (DVN), Report: Marathon Oil Corporation (MRO), Marathon Oil Corporation (MRO), Diamondback Energy, Inc. (FANG), Hess Corporation (HES), Cimarex Energy Co. (XEC), Continental Resources, Inc. (CLR)
https://finance.yahoo.com/news/insider-sell-alert-director-paul-140114130.html
https://finance.yahoo.com/news/chord-energy-appoints-susan-cunningham-213000868.html
https://finance.yahoo.com/news/evp-cfo-michael-lou-sells-070309156.html
https://finance.yahoo.com/news/weakness-chord-energy-corporation-nasdaq-104046572.html
https://finance.yahoo.com/news/reasons-invest-chord-energy-chrd-063851033.html
https://www.sec.gov/Archives/edgar/data/1486159/000148615923000039/chrd-20230930.htm
Copyright © 2024 Tiny Computers (email@tinycomputers.io)
Report ID: cXuKah
Cost: $0.51415
https://reports.tinycomputers.io/CHRD/CHRD-2024-01-28.html Home