Canadian Premium Sand Inc. (ticker: CLMPF)
2024-03-13
 Canadian Premium Sand Inc. (ticker: CLMPF) is a publicly traded company on the Canadian stock exchange that has carved a niche for itself in the resource sector, particularly focusing on the exploration, mining, and processing of silica sand. This natural resource is a critical component in various industrial applications, including glass manufacturing, foundry operations, water filtration, and as a proppant in hydraulic fracturing for oil and gas extraction. The company's operations are strategically located, leveraging the high-quality silica deposits in Canada to serve both domestic and international markets. Canadian Premium Sand Inc. has made significant strides in enhancing its mining capabilities and expanding its market reach, emphasizing sustainable practices to minimize environmental impact. With a commitment to innovation and quality, the company aims to capitalize on the growing demand for premium silica sand, positioning itself as a key player in the industry.

| City | Calgary | Country | Canada | Phone | 587-355-3714 |
|---|---|---|---|---|---|
| Website | https://cpsglass.com | Industry | Other Industrial Metals & Mining | Sector | Basic Materials |
| CEO Total Pay | 181,464 | CFO Total Pay | 167,831 | VP Corporate Development Total Pay | 139,544 |
| Previous Close | 0.2403 | Day Low | 0.2403 | Day High | 0.2403 |
| Market Cap | 21,620,224 | Volume | 500 | 52 Week Low | 0.2403 |
| 52 Week High | 0.32 | Shares Outstanding | 83,420,800 | Held Percent Insiders | 0.26449 |
| Held Percent Institutions | 0.21305001 | Total Cash | 2,467,535 | Total Debt | 3,120,671 |
| Book Value | -0.021 | Net Income to Common | -6,049,145 | Trailing EPS | -0.08 |
| Last Split Factor | 1:15 | Current Price | 0.2403 | Total Cash Per Share | 0.03 |
| EBITDA | -5,817,900 | Quick Ratio | 1.932 | Current Ratio | 2.077 |
| Return on Assets | -0.83823997 | Free Cash Flow | -3,707,304 | Operating Cash Flow | -5,443,331 |

| Sharpe Ratio | -1.1684909463343094 | Sortino Ratio | -1.170825595907397 |
| Treynor Ratio | 6.242299723461955 | Calmar Ratio | -1.0029642398235505 |
Analyzing the provided data for CLMPF, including technical indicators, fundamentals, balance sheet information, and risk-adjusted performance ratios, enables a comprehensive assessment of its future stock price movement.
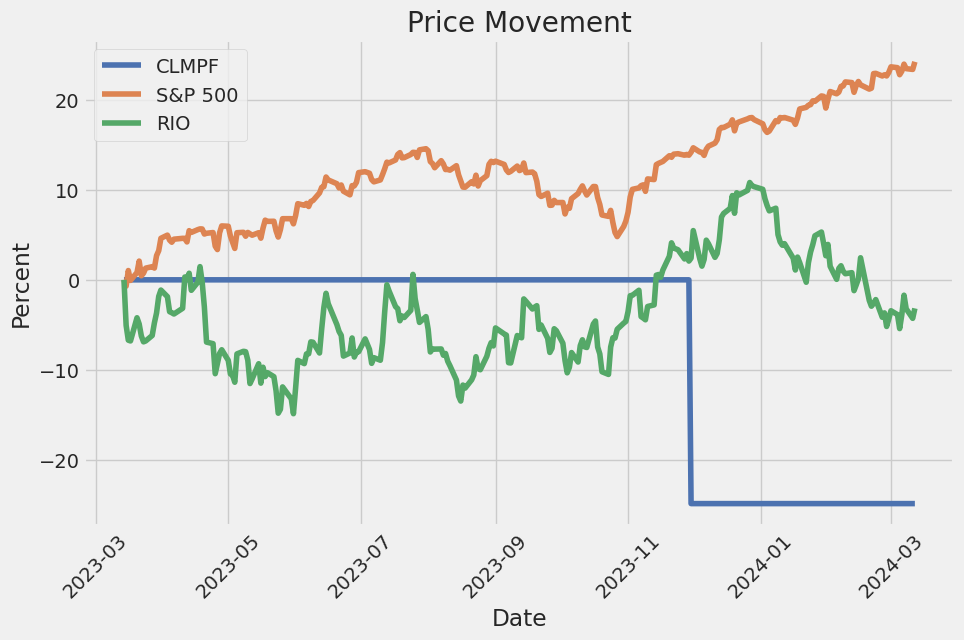
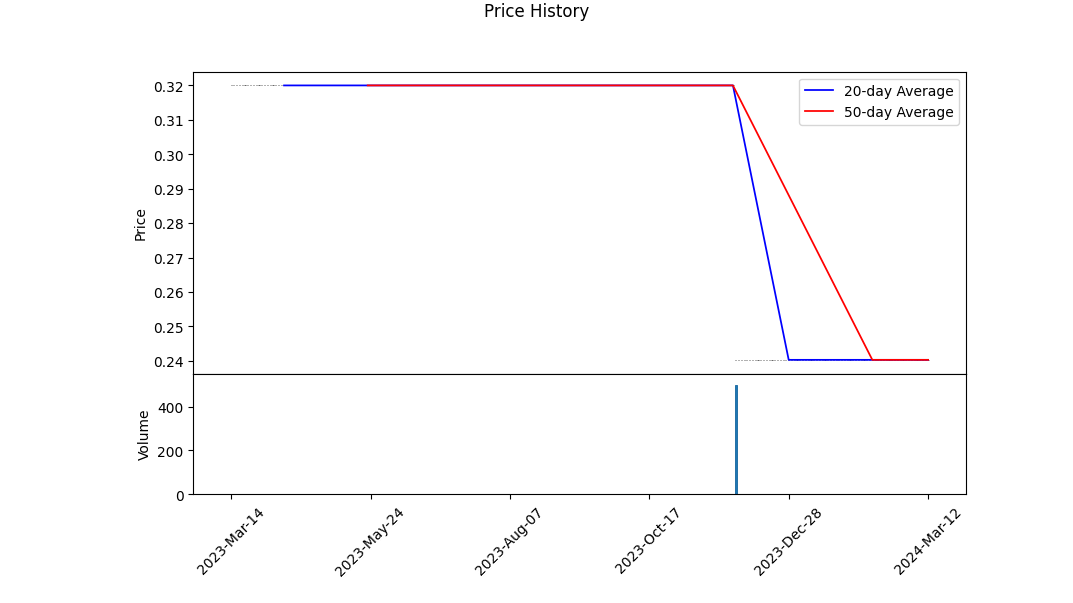
The technical analysis reveals a decrease in the stock price over recent months, with the opening and closing values showing a downward trend from 0.3200 to 0.2403. The consistent decrease and the negative On-Balance Volume (OBV) trend indicate selling pressure outweighing buying interest, reflecting a bearish sentiment among investors. Despite a slight positive trajectory in the Moving Average Convergence Divergence (MACD) histogram near the end, the overall technical outlook suggests a cautious approach towards the stock in the immediate future.
Fundamentally, the company's situation appears challenging. A significant negative return on assets and operating cash flow suggests operational inefficiencies and a potentially unsustainable business model in its current form. Additionally, the considerable negative free cash flow raises concerns about the company's ability to fund operations without resorting to external financing, which can be dilutive to current shareholders or increase the company's debt burden.
The balance sheet data presents a company with substantial liabilities and concerns regarding solvency and liquidity. The negative tangible book value and working capital, alongside retained earnings deeply in the negative, paint a picture of a company in financial distress. These factors combined may limit the company's ability to capitalize on growth opportunities or weather economic downturns without additional capital infusion, which could impact the stock value negatively.
The risk-adjusted performance ratios, including the Sharpe, Sortino, Treynor, and Calmar ratios, all point towards a high-risk investment profile. The negative Sharpe and Sortino Ratios indicate poor risk-adjusted returns, with volatility of returns not compensated adequately by higher performance. The Treynor Ratio, although positive, must be viewed cautiously due to the overall negative sentiment surrounding the stock. The negative Calmar Ratio further underscores the investment's risk, showing poor historical return performance relative to the maximum drawdown risk.
Given these analyses, the investment sentiment surrounding CLMPF is bearish for the coming months. Potential investors should be highly cautious, considering both the technical and fundamental challenges the company faces. The stock may experience limited upside potential with considerable downside risk, influenced negatively by operational inefficiencies, liquidity concerns, and an overall unfavorable financial health snapshot. Investors looking at CLMPF should closely monitor the company's efforts to improve its fundamental metrics and manage liabilities effectively, which could provide early signals for a change in the stock's trajectory. However, until substantial improvements are evident, the cautious stance appears warranted.
In our analysis of Canadian Premium Sand Inc. (CLMPF), we have calculated key financial metrics that are central to understanding its performance and potential investment value, specifically through the lenses of Return on Capital (ROC) and Earnings Yield, as prescribed by the investment principles outlined in "The Little Book That Still Beats the Market". Remarkably, Canadian Premium Sand Inc. showcases an exceptionally high Return on Capital (ROC) of 300.74%. This figure indicates that for every dollar invested in the capital of the company, it generates a return of $3.00, a metric that significantly denotes its efficiency in utilizing its capital to generate profits. However, it is critical to juxtapose this with the company's Earnings Yield, which currently stands at -25.16%. This negative earnings yield suggests that the company is not generating positive earnings relative to its share price, a factor that investors must weigh carefully. In summary, while the high ROC of Canadian Premium Sand Inc. presents an attractive facet of its operational efficiency, the negative Earnings Yield underlines existing challenges in profitability and potentially signals caution for investors. These figures form a nuanced picture of Canadian Premium Sand Inc., underscoring the importance of a balanced and comprehensive approach to evaluating its investment potential.
| Statistic Name | Statistic Value |
| Alpha | 0.0312 |
| Beta | -0.1964 |
| R-squared | 0.002 |
| Adj. R-squared | 0.002 |
| F-statistic | 3.115 |
| Prob (F-statistic) | 0.0778 |
| Log-Likelihood | -3852.5 |
| AIC | 7709 |
| BIC | 7719 |
| No. Observations | 1,256 |
In analyzing the linear regression model between CLMPF and SPY, which represents the entire market, a focal point is the model's intercept, often referred to as alpha. In this case, alpha is valued at 0.0312, suggesting that, on average, CLMPF has a slight positive baseline performance against the SPY independent of the market's movements. Even when the market remains static, CLMPF is expected to increase slightly in value, which can be an indicator of inherent strength within CLMPFs fundamentals or sector that allows it outperform the broader market under normal conditions.
However, the overall relationship between CLMPF and SPY during the observed period, as indicated by the R-squared value of merely 0.002, shows that SPY's movements account for very little of the variability in CLMPFs returns. This low R-squared value, along with a negative beta of -0.1964, suggests that CLMPF does not closely follow the markets movements and may even move inversely to the market to some extent. Despite this potential for non-correlation or slight negative correlation with the market, the small positive alpha implies some level of inherent value or performance capability in CLMPF that is not reliant on market trends.

As industries evolve and navigate through both triumphs and challenges, the dynamics within certain sectors notably reflect broader economic, cultural, and technological shifts. A distinct example of such evolution can be found in the analysis of Canadian Premium Sand Inc., a company characterized by its involvement in the extraction and processing of high-quality sand. This analysis, albeit in a broader context, draws upon various sources and recent developments across different industries to provide a comprehensive understanding of the market environment and strategic positioning.
Canadian Premium Sand Inc. operates within a niche yet fundamentally important sector, providing premium sand for industrial, commercial, and recreational uses. The significance of such a commodity extends beyond its immediate applications, touching upon sectors like construction, manufacturing, and even technology, where high-quality sand is crucial for producing silicon chips. Given this backdrop, insights into market trends, consumer behavior, and economic indicators become vital for comprehensively understanding the company's positioning and potential growth trajectory.
For instance, a recent investigation into the cinematic careers of Oscar winners, as detailed by Gabbi Shaw in a piece published on March 12, 2024, highlights the unpredictable nature of success and the importance of resilience and adaptability in ones career. This narrative, while focused on the film industry, parallels the business journey of companies like Canadian Premium Sand Inc., which may face unpredictable market conditions yet strive for excellence in their offerings. The dichotomy of high achievements and potential lows underscores the need for strategic flexibility and innovation, qualities that are indispensable for Canadian Premium Sand Inc. as it navigates its market landscape.
Moreover, a recent incident involving Japan's first private-sector rocket launch attempt by Space One, which ended in failure on March 13, 2024, further emphasizes the inherent risks involved in pioneering endeavors. For Canadian Premium Sand Inc., venturing into new markets or technologies might carry similar risks. However, just as the backing from major Japanese entities for Space One reflects optimism and ambition, Canadian Premium Sand Inc. is likely poised to leverage its unique value proposition and strategic insights to make influential strides in its sector.
The strategic expansion of Odoo into Hong Kong with its comprehensive payroll solution, as reported on March 13, 2024, sheds light on the importance of diversification and meeting specific market needs. Odoos initiative to cater to the complexities of payroll management in compliance with local regulations mirrors the necessity for Canadian Premium Sand Inc. to continually adapt and innovate its offerings to meet the requirements of its diverse clientele effectively.
Furthermore, the broader economic indicators and market dynamics outlined in financial reports, such as those discussed in a Yahoo Finance article dated March 12, 2024, provide essential context for analyzing Canadian Premium Sand Inc.'s operational environment. These indicators, from commodity pricing to currency movements, play a critical role in shaping the companys strategic decisions, highlighting the importance of a nuanced understanding of both global and domestic market conditions.
Lastly, the workforce reduction by PwC Australia, as a response to a major scandal and as part of its strategic realignment, underscores the critical importance of governance, ethical conduct, and strategic resilience. For Canadian Premium Sand Inc., maintaining high ethical standards and a robust strategic framework is imperative for sustainable growth and to navigate potential challenges.
In essence, Canadian Premium Sand Inc., much like actors in the film industry, companies in the space sector, innovative software providers, and global consultancy firms, operates within a tapestry of challenges and opportunities. Drawing insights from these varied narratives and industry dynamics offers a richer understanding of the strategic considerations and resilience required to thrive in todays complex market landscape.
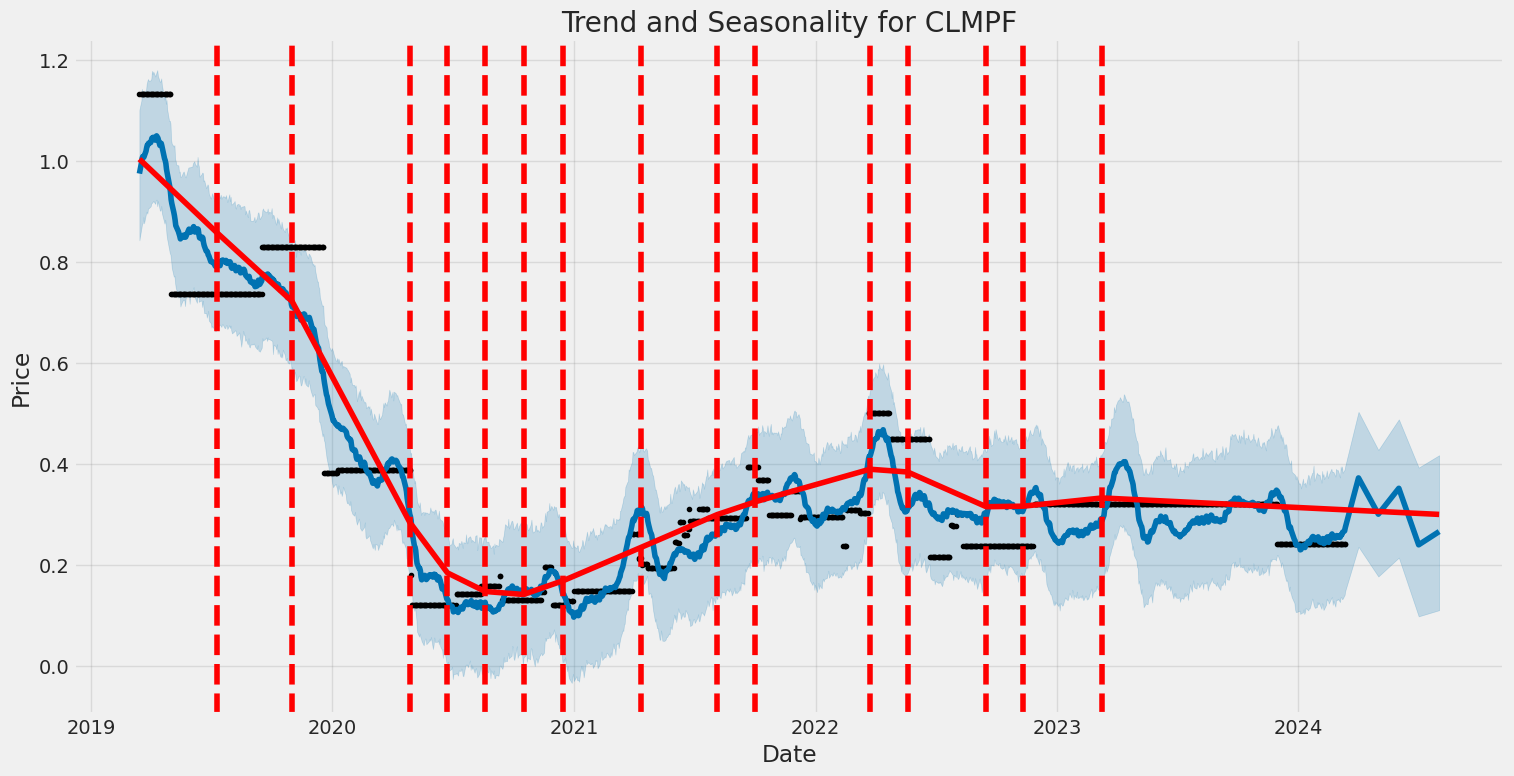
Canadian Premium Sand Inc. (CLMPF) has experienced notable volatility over the observed period from March 15, 2019, to March 12, 2024. The volatility of the company's stock, represented by the ARCH model, indicates a considerable level of unpredictability in its returns. This unpredictability is reflected in the statistical model's parameters, where both a significant omega value and a positive but not highly significant alpha[1] suggest fluctuations in the stock's returns that may concern investors looking for stability.
| Statistic Name | Statistic Value |
|---|---|
| Mean Model | Zero Mean |
| Vol Model | ARCH |
| Log-Likelihood | -3847.96 |
| AIC | 7699.91 |
| BIC | 7710.18 |
| No. Observations | 1,256 |
| omega | 26.5472 |
| alpha[1] | 0.0157 |
In assessing the financial risk of a $10,000 investment in Canadian Premium Sand Inc. (CLMPF) over a one-year period, a comprehensive analysis was undertaken utilizing a blend of volatility modeling and machine learning predictions. This multimodal approach allowed for a nuanced understanding of potential investment risk by evaluating historical stock volatility and predicting future returns.
The volatility modeling technique, central to understanding the fluctuating nature of Canadian Premium Sand Inc.'s stock, is adept at analyzing time-series data to estimate future volatility. This method relies on historical stock price movements to forecast the level of fluctuation that can be expected in the future. By applying this model, we gain insight into the inherent volatility of CLMPF, capturing the frequency and magnitude of price changes. This is crucial for risk assessment, as high volatility often implies greater risk, with the potential for both higher gains and more significant losses.
In concert with volatility modeling, machine learning predictions play a pivotal role in forecasting future returns. By leveraging a machine learning algorithm designed to recognize patterns within complex datasets, this approach can predict future stock price movements based on historical data. The predictive power of machine learning adds a forward-looking component to the risk analysis, providing an estimated trajectory of CLMPF's stock performance over the upcoming year.
The integration of these two methods culminates in the calculation of the Value at Risk (VaR) at a 95% confidence interval, which amounts to $271.53 for a $10,000 investment in CLMPF. VaR is a widely used risk measure that estimates the maximum potential loss over a specific timeframe with a given confidence level. In this context, the calculated VaR indicates that, under normal market conditions, there is a 95% likelihood that the investment will not lose more than $271.53 over the next year. Its a pivotal metric for investors, offering a quantifiable means to assess the risk of potential financial loss.
This multifaceted analysis, which integrates volatility modeling and machine learning predictions, provides an expansive view of the potential financial risks associated with investing in Canadian Premium Sand Inc. Evaluating stock volatility and utilizing predictive analytics to forecast returns lays a solid foundation for understanding the dynamics of investment risk. The calculated VaR offers a clear, quantifiable risk metric, demonstrating the effectiveness and utility of combining these analytical techniques to guide investment decisions in volatile equity markets.
Similar Companies in Other Industrial Metals & Mining:
Rio Tinto Group (RIO), BHP Group Limited (BHP), Report: Teck Resources Limited (TECK), Teck Resources Limited (TECK), MP Materials Corp. (MP), Lithium Americas Corp. (LAC), U.S. Silica Holdings, Inc. (SLCA), Covia Holdings Corporation (CVIAQ), Smart Sand, Inc. (SND), Hi-Crush Inc. (HCRSQ)
https://finance.yahoo.com/m/9900f650-f4eb-39c0-9f15-8f7ddea18ebc/the-worst-movies-that-83.html
https://finance.yahoo.com/news/q4-2023-chicago-atlantic-real-025635197.html
https://finance.yahoo.com/news/japans-first-private-sector-rocket-025644383.html
https://finance.yahoo.com/news/keds-taps-fashion-icon-classic-025900647.html
https://finance.yahoo.com/news/global-irritable-bowel-disease-ibd-030000358.html
https://finance.yahoo.com/news/odoo-launches-payroll-solution-hong-030000050.html
https://finance.yahoo.com/news/india-morning-newsletter-march-13-030005657.html
https://finance.yahoo.com/news/pwc-australia-cuts-another-300-030019968.html
Copyright © 2024 Tiny Computers (email@tinycomputers.io)
Report ID: fk9cWW
Cost: $0.37731
https://reports.tinycomputers.io/CLMPF/CLMPF-2024-03-13.html Home