Costco Wholesale Corp (ticker: COST)
2023-12-17
 Costco Wholesale Corp (ticker: COST) operates as an international chain of membership warehouses that provide a wide selection of merchandise at significantly reduced prices for members who pay an annual fee. The company is known for its bulk items, limited selection of nationally branded products, and private-label Kirkland Signature products across a diverse array of categories, including groceries, appliances, electronics, health and beauty aids, automotive supplies, and apparel. Costco's business model is based on high sales volumes and rapid inventory turnover, complemented by the sale of membership fees which contribute to its profitability. As of 2023, Costco has established a substantial presence both domestically within the United States and internationally, with hundreds of warehouses globally. The company also offers ancillary services such as pharmacy, optical, and travel services. Costco's commitment to low prices and high-quality products has fostered a loyal customer base and allowed the company to maintain steady growth in a competitive retail landscape. Its cost-effective operations and robust business model have made it one of the largest retailers in the world by sales volume.
| As of Date: 12/17/2023Current | 8/31/2023 | 5/31/2023 | 2/28/2023 | 1/31/2023 | 11/30/2022 | |
|---|---|---|---|---|---|---|
| Market Cap (intraday) | 292.32B | 243.41B | 226.70B | 214.76B | 226.81B | 239.34B |
| Enterprise Value | 283.80B | 238.71B | 221.99B | 212.13B | 224.18B | 237.33B |
| Trailing P/E | 44.90 | 40.69 | 37.89 | 36.60 | 38.63 | 41.04 |
| Forward P/E | 42.37 | 35.84 | 34.01 | 33.67 | 35.59 | 37.45 |
| PEG Ratio (5 yr expected) | 4.92 | 3.96 | 3.75 | 3.52 | 3.71 | 3.83 |
| Price/Sales (ttm) | 1.19 | 1.04 | 0.97 | 0.93 | 0.98 | 1.06 |
| Price/Book (mrq) | 11.18 | 10.33 | 9.62 | 10.00 | 10.56 | 11.59 |
| Enterprise Value/Revenue | 1.17 | 3.02 | 4.14 | 3.84 | 4.06 | 4.36 |
| Enterprise Value/EBITDA | 26.46 | 64.39 | 122.85 | 105.17 | 111.15 | 131.56 |
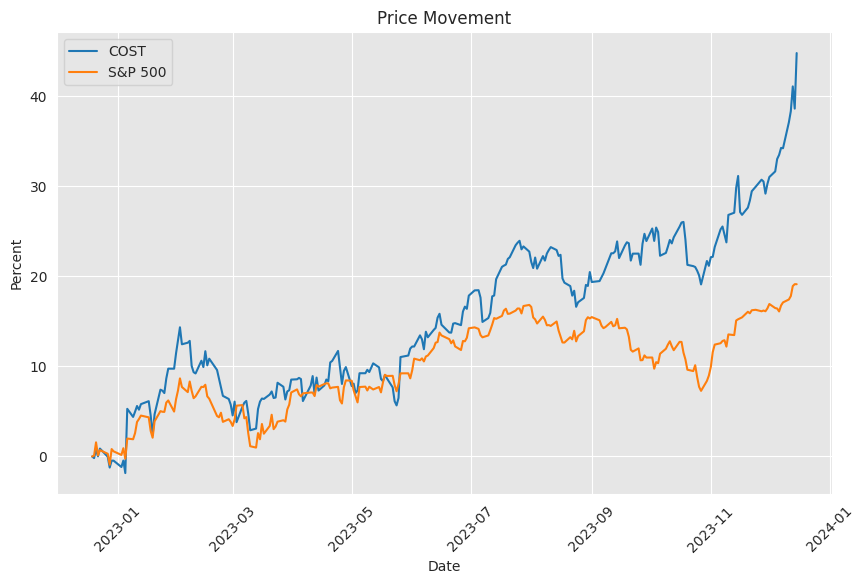
 Based on the provided technical analysis data and company fundamentals, we can offer insights into the possible stock price movements for Costco Wholesale Corporation (COST) in the upcoming months.
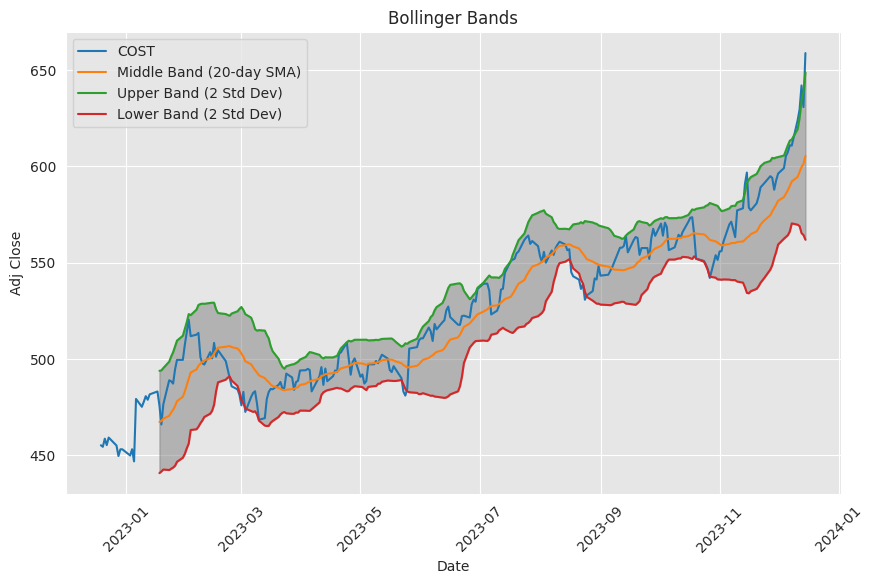
Technical Indicators: - The Adjusted Close price indicates a strong closing on the last trading day. - A high MACD (Moving Average Convergence Divergence) value above zero suggests a bullish trend, with the signal line well below the MACD line, confirming strong positive momentum. - A high RSI (Relative Strength Index) nearing 80 is indicative of an overbought condition, signaling caution for a potential price pullback or consolidation period. - Bollinger Bands show the price is touching the upper band, implying high volatility; the stock may revert to the mean, which is indicated by the Bollinger Band middle line (BBM). - SMA (Simple Moving Average) and EMA (Exponential Moving Average) values show the stock is trading well above these averages, with the EMA offering a longer-term bullish outlook. - OBV (On-Balance Volume) has a high value, implying strong volume backing the current trend. - STOCH (Stochastic Oscillator) readings are high, mirroring the RSI's overbought indication. - The ADX (Average Directional Index) portrays a strong trending market. - WILLR (Williams %R) near its extreme negative level also suggests overbought conditions. - A positive CMF (Chaikin Money Flow) indicates strong buying pressure and inflow of money into the stock. - The PSAR (Parabolic SAR) is below the price, further supporting its uptrend.
When applying these technical indicators, COST has been performing strongly, with a solid uptrend signal from most indicators. However, given the overbought levels per RSI, WILLR, and STOCH, there is the possibility of short-term pullbacks or consolidation as traders could take profits, and new investors might await better entry points.
Fundamentals: - The Market Cap shows a significant increase over the last three reports, indicating positive investor sentiment towards COST. - The P/E ratios, both trailing and forward, suggest the stock is valued at a premium vs. historical averages but has seen some leveling from higher past values, potentially indicating improved earnings or growth expectations. - The Price/Sales ratio is relatively low, potentially implying undervaluation against the companys sales. - The Enterprise Value/Revenue and Enterprise Value/EBITDA have stabilized at lower levels, which could point to increasing operational efficiency or a market correction to the company's enterprise valuation.
Financials: - COST has a solid growth in normal EBITDA and Net Income, which reinforces the company's operational strength. - The revenue and operating income have also shown steady growth, reflective of robust business performance. - The increase in normalized net interest income suggests a better financial position concerning debt management and interest earnings.
Considering the technicals in conjunction with the fundamentals, COST displays characteristics of a strong, growing company that is currently well-regarded by the market, shown by its high market cap and investors' willingness to pay premium P/E ratios. The company's solid financial performance with growing revenue and net income supports a positive outlook.
While the uptrend may continue due to strong fundamentals and positive momentum, investors should be prepared for potential short-term volatility or price pullbacks due to overbought technical conditions. However, these should be considered consolidation periods within a broader bullish trend. Given the strong market position and financial growth, COST could maintain its positive trajectory over the next few months, barring any significant market or economic disruptions. Any pullbacks may offer additional entry points for long-term investors who believe in the underlying strength of the company. The main risks to this outlook would be changes in market sentiment or unexpected negative developments in economic conditions or company performance.
Costco Wholesale Corp (COST), recognized for its membership-based warehouse retail model, has built a reputation as a strong and loyal brand in the retail landscape, renowned for delivering high-quality products at decidedly competitive prices. A large fraction of the retailer's success can be attributed to its unique business strategy, which leverages a blend of cost-effectiveness and customer satisfaction. This has not only allowed it to weather the storm against e-commerce giants like Amazon but has also enabled it to embrace digital platforms, resulting in a consistent expansion of its consumer base both domestically and internationally.
The company operates on a membership-based model, generating a significant chunk of its profitability from annual subscription fees. This model of recurring revenue underpins the reliability of Costco's income streama feature that has earned the company plaudits from both customers and investors. The consistent and reliable growth stemming from this strategy positions the retailer as a compelling investment for those inclined towards long-term dividend income.
Costco's commitment to returning profits to shareholders solidifies its reputation within investment circles. Despite a relatively modest dividend yield, the company often sweetens the deal with the issuance of special dividends. These payouts, occurring every few years, have become a hallmark of Costco's prudent capital management and robust cash flows. These payments acknowledge the importance of shareholder value and enhance the overall attractiveness of the stock as an income-providing asset.
Such a dynamic is reflected in the most recent special cash dividend announced by Costco, a substantial $15 per share to be distributed in early 2024. This reflects a generous increase over past special dividends declared in 2012, 2015, 2017, and 2020, magnifying the retailer's solid financial footing and ability to lavish its investors with occasional yet significant returns. The decision to issue this latest special dividend arrived on the heels of robust quarterly financial results, with total revenue surpassing forecasts and earnings per share experiencing a year-over-year climb.
Costco's sound financial posture is further accentuated by its net cash position. With an enviable stockpile of cash, cash equivalents, and short-term investments, outstripping its modest debt levels, Costco showcases the capacity for considerable financial expenditure without undermining its low-cost operational structure. This fiscal muscle affords the company a strategic advantage not only to manage periodic special dividends effectively but also to invest sustainably in infrastructure growth and technological advances.
While the special dividends are noteworthy, Costco's regular dividends remain a pillar of its investment appeal. The company has steadily increased its regular quarterly dividend to $1.02 per share, with recent hikes emphasizing its solid financial track record. Springer, Costco's resilient performance has also translated into appreciable stock price growth. Investors weighing the long-term growth potential of their portfolio can find solace in Costco's ability to maintain pace with, if not outperform, market indices.
One cannot overlook the potential for revenue enhancement via the avenue of membership fee hikes. This speculation is rooted in Costcos past practice of fee adjustments approximately every five to six years. A hike in membership fees could serve as a catalyst, propelling further revenue growth, thereby bolstering shareholder value against a backdrop of economic challenges.
The overall retail environment is a complicated tapestry of economic indicators, corporate events, and competitor strategies, and Costco is not insulated from these dynamics. The company faces the task of reporting earnings amidst varied market sentiments, influenced by factors such as the Federal Reserve's rate decisions, inflationary trends, and other economic reports providing insights into the health of consumer spending. Costco's quarterly earnings are therefore a significant indicator of not just the company's performance but also the consumer economy itself.
Even as the retail giant navigates these macroeconomic pressures, strong membership sales in the U.S. and abroad, and particularly the growth in executive memberships, signal a deepening loyalty to the Costco brand. This loyalty, evidenced by increasing renewal rates, foreshadows a sustained appetite for the retailers value proposition and is an auspicious sign of ongoing revenue growth.
Furthermore, Costcos unyielding approach to inventory management, consistently achieving higher turnover rates relative to competitors, minimizes wasted shelf space and optimizes capital use. This effectiveness is a vital component of the retailer's ability to keep prices down and move volume, solidifying its competitive pricing advantage.
Investors recognize the stability offered by Costcos model, which seems impervious to obsolescence even as technology reshapes consumer behavior. This durability is mirrored in the stock's premium valuation, implying faith in the company's resilience. Costco's reputation as a "no-brainer" investment hinges on this consistent performance, underscored by its ability to cultivate and maintain a robust customer base within the uniquely competitive retail sector.
As Costco progresses into 2024 under new executive leadership, its ability to hold firm against economic headwinds while eyeing an increase in membership fees will be critical. The recent earnings report and revenue trajectory instill confidence, but it is the retailers strategic actions, such as the anticipated membership fee rise and its unyielding commitment to delivering customer value, that will continue to underpin investor trust.
Lastly, the special dividend declaration by Costco following a strong quarterly report exemplifies the company's operational vigor and financial health. This financial adeptness in conjunction with aggressive expansion plans, particularly in the international sphere, including an ambitious expansion in the Chinese market, positions Costco as a formidable entity. These facets combine to suggest a retail titan not only primed for sustained growth but also molded to deliver shareholder value over the long run, making it an undeniably prominent feature in the investment landscape.
Similar Companies in Retail - Defensive:
Walmart Inc. (WMT), Target Corporation (TGT), BJ's Wholesale Club Holdings, Inc. (BJ), Report: Amazon.com, Inc. (AMZN), Amazon.com, Inc. (AMZN), The Kroger Co. (KR), Sam's Club (Subsidiary of Walmart Inc.) (WMT), Dollar General Corporation (DG), The Home Depot, Inc. (HD), Lowe's Companies, Inc. (LOW), Best Buy Co., Inc. (BBY)
News Links:
https://www.fool.com/investing/2023/12/16/3-no-brainer-dividend-stocks-buy-hold-20-years/
https://www.fool.com/investing/2023/12/14/costco-to-pay-special-dividend-of-15-per-share-wha/
https://seekingalpha.com/article/4657027-wall-street-breakfast-week-ahead
https://www.fool.com/investing/2023/12/15/investors-this-stock-just-became-your-best-friend/
https://www.fool.com/investing/2023/12/08/10-top-stocks-to-buy-in-2024/
https://www.fool.com/investing/2023/12/14/3-resilient-growth-stocks-to-buy-in-december/
https://www.fool.com/investing/2023/12/11/costco-stock-has-a-lot-to-prove-this-week/
https://www.fool.com/investing/2023/12/15/why-costco-stock-was-climbing-today/
https://www.fool.com/investing/2023/12/10/4-magnificent-stocks-that-im-never-selling/
Copyright © 2023 Tiny Computers (email@tinycomputers.io)
Report ID: 1S7XLA
https://reports.tinycomputers.io/COST/COST-2023-12-17.html Home