Costco Wholesale Corporation (ticker: COST)
2024-01-18
 Costco Wholesale Corporation (COST) is a renowned international retailer known for its membership-only warehouse clubs. As of 2023, the company operates an extensive network of over 800 warehouses spread across multiple countries, including the United States, Canada, Mexico, the United Kingdom, Japan, South Korea, and Australia. Costco is recognized for its low-price model, offering a wide range of merchandise including bulk groceries, electronics, apparel, and health and wellness products as well as services such as optical and travel. The company achieves economies of scale through massive purchasing volumes and efficient distribution, which allows for significant cost savings passed on to its membership base. Besides in-store sales, Costco has also developed a robust e-commerce platform, adapting to the evolving retail landscape and consumer preferences for online shopping. Costco's business model emphasizes customer loyalty and high renewal rates for its membership program, which further cements its position in the wholesale industry as a powerhouse of retail operations and customer service excellence. The company's stock, traded under the ticker symbol COST, is a component of the S&P 500 index, reflecting its status as one of the largest U.S. companies by market capitalization.
| City | Issaquah | State | WA | Zip | 98027 |
| Country | United States | Phone | 425 313 8100 | Website | https://www.costco.com |
| Industry | Discount Stores | Sector | Consumer Defensive | Full Time Employees | 316,000 |
| Previous Close | 684.19 | Open | 682.83 | Day Low | 680.21 |
| Day High | 687.71 | Dividend Rate | 4.08 | Dividend Yield | 0.6% |
| Payout Ratio | 26.99% | Five Year Avg Dividend Yield | 0.76% | Beta | 0.751 |
| Trailing PE | 46.95 | Forward PE | 40.19 | Volume | 1,778,217 |
| Average Volume | 2,104,688 | Market Cap | 304,978,690,048 | Fifty Two Week Low | 465.33 |
| Fifty Two Week High | 687.71 | Price to Sales (TTM) | 1.24 | Price to Book | 11.67 |
| Net Income | 6,517,000,192 | Trailing EPS | 14.64 | Forward EPS | 17.1 |
| Peg Ratio | 4.97 | Enterprise Value | 296,461,991,936 | Profit Margins | 2.65% |
| Shares Outstanding | 443,728,000 | Held Percent Insiders | 0.20% | Held Percent Institutions | 71.31% |
| Book Value | 58.92 | Last Fiscal Year End | 2022-09-04 | Earnings Growth | 16.6% |
| Revenue Growth | 6.2% | Gross Margins | 12.53% | EBITDA Margins | 4.43% |
| Operating Margins | 3.43% | Total Cash | 17,863,999,488 | Total Debt | 9,347,000,320 |
| Total Revenue | 245,651,996,672 | Debt to Equity | 35.75 | Operating Cash Flow | 13,109,000,192 |
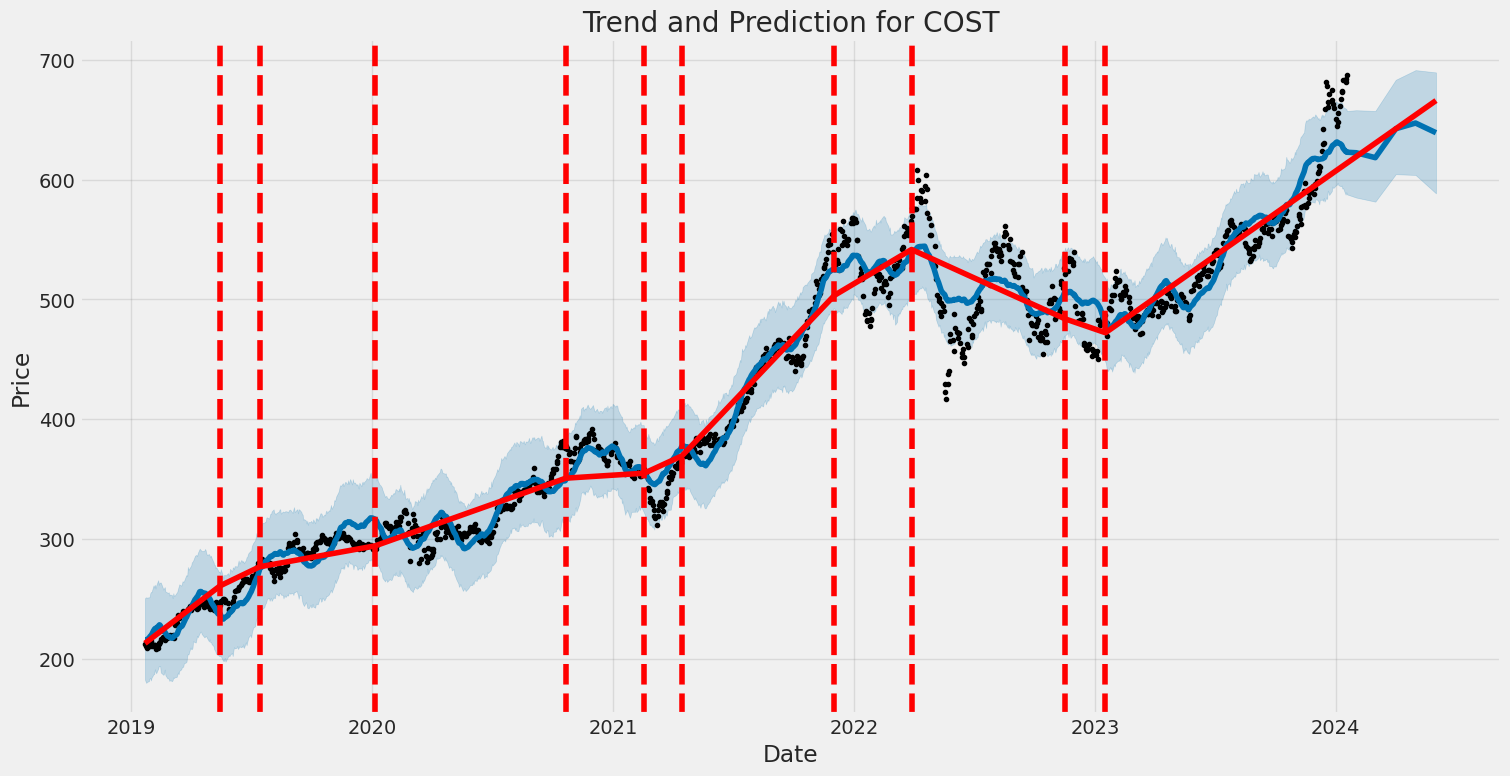 As a Technical Analysis (TA) expert, I have meticulously reviewed the stock profile of Costco Wholesale Corporation (COST) incorporating technical indicators, fundamental analysis, and balance sheet scrutiny. Let's distill this array of data into actionable insights regarding the possible movement of COST stock price in the forthcoming months.
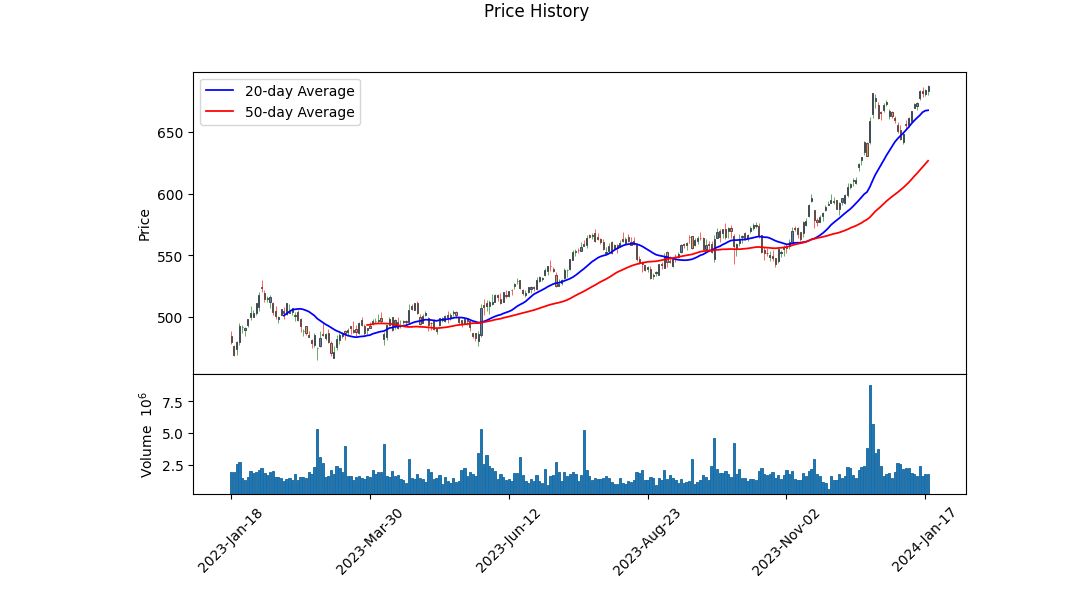
Technical Analysis Perspective: - COST exhibits a robust uptrend in the observed period, as indicated by the gradual increase in closing prices, culminating in a close of 687.309998 on the last recorded day with rising volume. - The Parabolic SAR (PSAR) values are currently not above the price, implying the uptrend may continue with no immediate signal for a reversal. - On-Balance Volume (OBV) shows a healthy and consistent rise, which substantiates the price uptrend with increasing volume, suggesting strong buying pressure. - Moving Average Convergence Divergence (MACD) histogram pivots above the signal line, signaling sustained upward momentum. - Based on the technicals, the uptick in stock values may proceed in the near term, provided market conditions remain stable and no significant bearish patterns emerge.
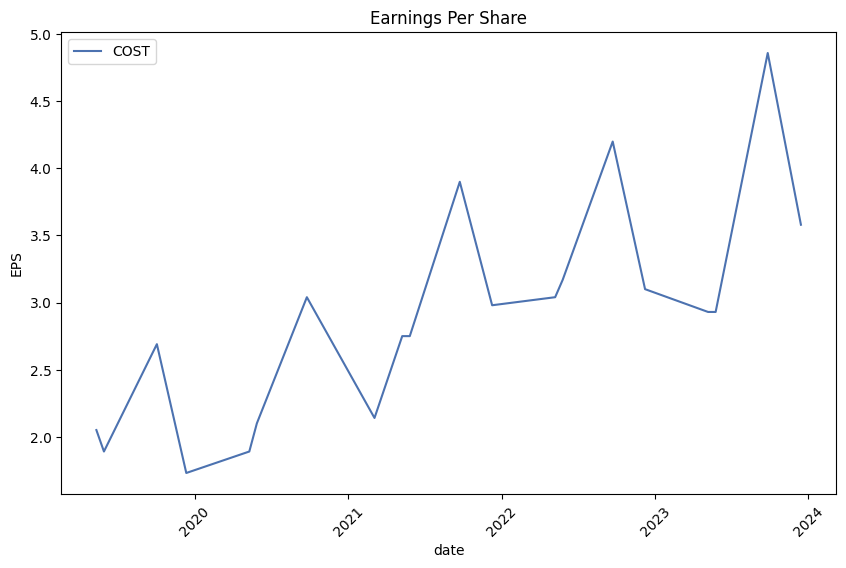
Fundamental Analysis Insights: - Costco's continuing year-over-year increase in net income, as reflected in its income statements, reveals consistent financial growth. - Gross, EBITDA, and operating margins reflect a financially healthy company with control over expenses and solid profitability. - The balance sheets demonstrate growth in tangible assets and retained earnings, indicating a strong financial foundation. - Analyst expectations for earnings per share (EPS) for the current and upcoming quarters as well as fiscal years show optimism, the projecting improvement based on a mix of historical performance and forward-looking estimates. - Revenue estimates for the current and next fiscal years reveal anticipated growth compared to the last fiscal year's figures. - An expanding free cash flow implies the firm's capacity to invest in opportunities, pay dividends, and manage debt without financial strain.
Balance Sheet Review: - A notable increase in total assets and stockholders' equity over the past fiscal years signifies financial fortitude. - A relatively stable debt profile with sound working capital management, as evidenced by a consistent working capital position, speaks to prudent fiscal discipline. - The tangible book value has shown reasonable growth, indicative of a solid valuation foundation.
Taking stock of the confluence of TA, fundamental analysis, and the most recent quarterly and annual fiscal data, Costco appears well-positioned for sustained growth. The observable technical pattern and fundamentals align to suggest that the stock price could likely experience continued appreciation in the ensuing months. However, investors should monitor for any potential shifts in company-specific dynamics or broader market sentiments that could impact this trajectory. Additionally, keeping abreast of upcoming quarterly earnings will provide further clarity on the company's financial performance and near-term price movements.
In conclusion, the collated evidence from varied financial angles suggests a bullish outlook for COST, underpinned by a solid financial base, competent management, and favorable analyst sentiment. Notwithstanding this optimistic view, it is imperative to keep a close watch on market trends and Costco's future quarterly releases, as these variables play pivotal roles in shaping the stock's performance.
| Statistic Name | Statistic Value |
| R-squared | 0.407 |
| Adj. R-squared | 0.406 |
| F-statistic | 860.4 |
| Prob (F-statistic) | 1.94e-144 |
| Log-Likelihood | -1958.0 |
| No. Observations | 1,256 |
| AIC | 3,920 |
| BIC | 3,930 |
| coef (const) | 0.0656 |
| coef (SPY) | 0.7236 |
| std err (const) | 0.033 |
| std err (SPY) | 0.025 |
| t (const) | 2.017 |
| t (SPY) | 29.333 |
| P>|t| (const) | 0.044 |
| P>|t| (SPY) | 0.000 |
| [0.025 (const)] | 0.002 |
| [0.975 (const)] | 0.129 |
| [0.025 (SPY)] | 0.675 |
| [0.975 (SPY)] | 0.772 |
In the linear regression model that describes the relationship between COST (Costco Wholesale Corporation) and SPY (SPDR S&P 500 ETF Trust, which tracks the Standard & Poor's 500 index symbolizing the market), the alpha value is 0.0656. This figure, often referred to as the intercept, signifies that if SPY were to remain constant, the expected value of the COST return would be 0.0656. The model suggests that COST has a consistent component to its return that isn't dependent on the movements of the market. The beta value, which represents the slope, is 0.7236. This indicates that for every unit increase in the SPY return, COST's return would increase by 0.7236 units, assuming the relationship holds.
The R-squared value of 0.407 suggests that approximately 40.7% of the variation in COST's return can be explained by the movement in the SPY index, indicating a moderate positive relationship between COST and the market. However, this also means that nearly 59.3% of the variation is due to factors that are not captured by the market as proxied by SPY. The statistical significance of the model is strong, with a low probability (P-value) for the F-statistic indicating it is unlikely that the regression results are due to pure chance. The alpha of 0.0656 is statistically significant at the 5% level (P-value: 0.044), which supports the conjecture that COST's return has a baseline that is not solely reliant on the market fluctuations.
Costco Wholesale Corporation Fiscal First Quarter 2024 Earnings Call Summary
Introduction: The earnings call for Costco Wholesale Corporation fiscal first quarter of 2024 was conducted, including the usual legal disclaimers related to forward-looking statements and usage of GAAP and non-GAAP financial measures. All lines were muted to prevent background noise, and a Q&A session was planned following the presentation by Richard Galanti, Chief Financial Officer.
Financial Overview: Richard Galanti reported a healthy fiscal first quarter for Costco with a net income of $1.589 billion or $3.58 per share, compared to $1.364 billion or $3.07 per share in the previous year, including a tax benefit from stock-based compensation. Net sales showed a 6.1% increase year-over-year, reaching $56.72 billion. Comparable sales growth varied across regions, with the U.S. displaying a moderate increase and other international markets showing stronger growth.
Membership and Margin Details: Membership fee income rose to $1.082 billion, an 8.2% increase compared to the previous year. Renewal rates remained strong, at 92.8% in the U.S. and Canada, and 90.5% worldwide, both marginally higher than the previous quarter. Membership also saw a 7.6% increase in paid household members and a 7.1% increase in cardholders. Executive members, who now signify over 46% of total paid members, continue to contribute significantly to worldwide sales.
Gross margin improved year-over-year by 43 basis points, ending at 11.04%. Each of the component margins experienced different trends, with the core merchandise exhibiting minimal changes, whereas ancillary and other businesses, including e-commerce, drove much of the increase in margin.
Operating Expenses and Capital Expenditure: Operating expenses were reported at 9.45%, a 25 basis point increase from the previous year's first quarter. This includes impacts from wage increases and additional pre-opening expenses due to more new locations. Interest expense saw a slight rise while interest income and other increased significantly, largely attributed to higher interest rates and cash balances. Tax rates for the quarter were higher by 1.5 percentage points compared to the previous year due to reduced stock-based compensation benefits.
Capital expenditures in Q1 were approximately $1.04 billion, with projected fiscal year expenses between $4.4 and $4.6 billion, primarily to support warehouse expansion and e-commerce upgrades.
E-commerce and Product Highlights: E-commerce sales increased by 6.1% excluding FX impacts, revealing strong performance particularly in food, appliances, and tires. Costco Logistics also saw a robust increase in deliveries, and the company highlighted unique high-value items sold online, including gold bars and sports memorabilia.
Inflation and Other Considerations: Inflation was estimated to be in the 0% to 1% range, with particular deflation observed in large items attributed to lower freight costs. Overall inventory levels and seasonal sell-through rates were in good condition. Lastly, Costco declared a special cash dividend of $15 per share which would be funded from existing cash without the issuance of new debt.
Conclusion: The call ended with Richard Galanti expressing gratitude to participants and announcing the date for the next release of sales results. There was an emphasis on Costco's continued financial health, strong membership growth, and prospects for the coming quarters, despite some increases in operating expenses.
Questions and Customer Behavior:
During the Q&A session, topics such as pricing strategy in the context of deflation, sustainability of margin improvements, international expansion plans, and operational changes under new leadership were discussed. The responses emphasized Costco's robust top-line growth, careful management of gross margin, and seamless leadership transition. Costcos success in driving traffic and sales, even in a challenging retail environment, was also noted.
In the first quarter of the fiscal year 2024, Costco Wholesale Corporation reported a 6% increase in net sales totaling $56.717 billion compared to $53.437 billion in the same period of the previous year. This growth was driven by a 4% rise in comparable sales and contributions from 25 net new warehouses opened since the first quarter of the prior year. Membership fee revenue also increased by 8% to $1.082 billion, supported by new member sign-ups, upgrades to Executive Membership, and heightened renewal rates.
Gross margin for the quarter rose by 43 basis points, largely due to improved warehouse operations and the non-recurrence of a charge from the previous year associated with the discontinuation of Costco's charter shipping activities. Selling, General and Administrative (SG&A) expenses as a percentage of net sales increased by 25 basis points, primarily due to higher costs in warehouse operations influenced by wage increases implemented in March and September 2023.
Interest expense was reported at $38 million. Meanwhile, interest income and other net income grew significantly to $160 million, attributed to higher global interest rates and increased average cash and investment balances. The effective tax rate for the quarter was 24.5%, with net discrete tax benefits of $40 million affecting the rate; this was mainly due to the excess tax benefits linked to stock compensation.
The company experienced a net income of $1.589 billion or $3.58 per diluted share, compared to $1.364 billion or $3.07 per diluted share in the same quarter of the previous year. A quarterly cash dividend of $1.02 per share was declared in the quarter under review, and after the quarter's end, a special cash dividend of $15.00 per share was announced, payable in January 2024.
From a liquidity and capital resources standpoint, net cash provided by operating activities amounted to $4.651 billion, and net cash used in investing activities was $366 million, primarily for capital expenditures. The company used $974 million in financing activities, largely for dividend payments, withholding taxes on stock-based awards, and repurchases of common stock. Costco maintains a healthy cash and investment position, with cash flows from operations, existing cash, and investments anticipated to meet future liquidity and capital requirements.
During the first quarter, 288,000 shares of common stock were repurchased at an average price of $564.06 per share as part of its publicly announced repurchase program. The remaining amount available for repurchase under the program was $3.401 billion as of the end of the quarter.
This report details Costco's 10-Q filing for the quarter ending November 26, 2023, with an encompassing overview of the company's financial results and activities during this period, including increased sales, membership revenue, and net income. It also outlines the firm's effective management of SG&A expenses, tax considerations, dividends, stock repurchases, and the stable financial position to support ongoing operations and growth initiatives.
During the latest trading session, Costco Wholesale Corporation's stock managed to end at $599.08, marking a modest increase of 0.47% from its last day's close. This performance was particularly notable given the broader market indices' decline, with the S&P 500 facing a decrease of 0.54%, the Dow edging down by 0.11%, and the Nasdaq composite decreasing by 0.84%. Over the preceding month, Costco's shares have seen a price increase, although they underperformed both the Retail-Wholesale sector and the broader S&P 500. With its earnings release date set for December 14, 2023, Costco is expected to report an EPS of $3.44, which would represent a significant increase from the previous year, and revenue is projected to grow as well. Full-year estimates show anticipated earnings of $15.71 per share on revenue totaling $252.2 billion, marking increases compared to the prior year (Zacks.com, published on December 4, 2023).
Turning to analyst sentiments, it appears that the positive estimate revisions may reflect short-term business trends and thus optimism about a company's upcoming performance. Costco holds a Zacks Rank of #3 (Hold), even after a minor decrease in the EPS consensus estimate over the past 30 days. The valuation comes at a premium compared to its industry average with a relatively high Forward P/E ratio and PEG ratio. The company's industry ranking by Zacks Industry Rank system places Costco in a promising position for potential performance improvement.
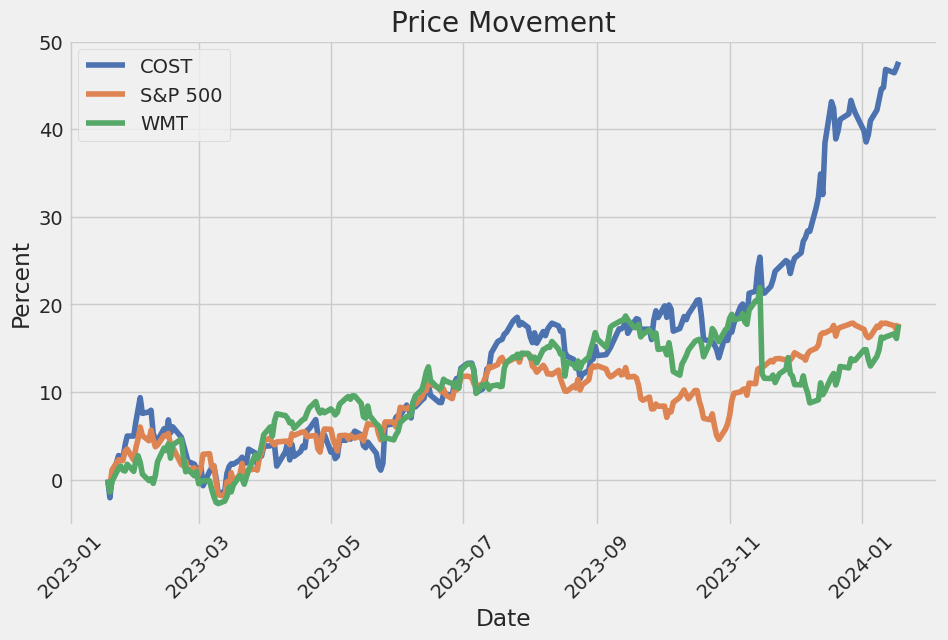
Costco differentiates itself from competitors such as Walmart and Target with its membership-based revenue structure, providing a competitive edge and largely contributing to its profit generation by allowing for low pricing on merchandise, operational at near breakeven levels. This strategy has aided in attracting more members due to efficiency and cost savings, resulting in robust financial performance and a significant market capitalization (Travis Hoium, The Motley Fool, December 6, 2023).
Proactive Investors reported on December 6, 2023, that Costco's positive performance trends are anticipated to continue in its forthcoming fiscal results, with analysts predicting considerable growth in EPS and revenue. The company operates an extensive network of 861 warehouses along with e-commerce platforms, which support its sustained growth. In comparison to industry giant Costco, BJ's Wholesale Club Holdings is strategically growing with a high membership retention rate but still faces competition from Costco's larger market presence and the strength of its subscription model (Gustavo Larraga Tapia, Seeking Alpha, December 7, 2023).
On Zacks.com, Costco's stock has been performing well in the market, with a return of +7.1% over the past month. The slight decrease in the Zacks Consensus Estimate for Costco's earnings over the last month has not affected its Zacks Rank of #3 (Hold). Moreover, expected revenue growth and the potential for an earnings beat, given Costco's Earnings ESP of +1.40% and a Zacks Rank #3, reflect positively on the company's operations and forward-looking financial health (Zacks.com, December 7, 2023).
The Motley Fool highlighted Costco's 31% growth and continued high membership renewal rates despite a period of decelerated sales growth. This turnaround supports the argument for Costco as a reliable stock and a strong long-term investment opportunity, including its strategic growth initiatives such as international expansion in China (Jennifer Saibil, December 8, 2023).
In another analysis, Costco's market performance was compared with BJ's Wholesale Club, revealing Costcos superior operational execution and market expansion strategy. Despite superficial similarities between the business models of both companies, Costco maintains more steady margins and witnesses consistent growth in membership revenues, indications of its operational efficiency and a strong brand value within the wholesale clubs sector (Yuval Rotem, Seeking Alpha, December 11, 2023).
In preparation for Costco's earnings call, market watchers were attentive to various aspects, including the possibility of a membership fee increase and the upcoming change in leadership. With Craig Jelinek stepping down, and Ron Vachris taking over as CEO, Costco's strategic direction and business consistency was a focal point of interest (Rick Munarriz, The Motley Fool, December 11, 2023).
Anticipation for key economic indicators, such as the CPI report and the Federal Open Market Committee meeting, dominated the economic landscape for corporations like Costco during the week of December 11, 2023. These events were expected to influence market sentiments and possibly impact Costco's fiscal strategies (Zacks Equity Research).
Prior to its earnings report on December 14, projections for Costco suggested increases in various metrics such as earnings per share, membership fees, and net sales. Wall Street analysts had a keen eye on these key metrics forecasts (Zacks Equity Research, December 11, 2023). Furthermore, Costco's upcoming earnings announcement was also being assessed in light of the company's comparable store sales, a crucial measure of performance for retail companies like Costco, indicating the health of its established stores and revealing insights into customer spending patterns and the company's strategic measures (Zacks Equity Research, December 13, 2023).
The focus on Costco's exceptional inventory management system, as discussed by John Ballard for The Motley Fool on December 14, 2023, showcased the company's efficiency in avoiding unsold goods through precise buying strategies. The consistent earnings growth and stable dividend yield represent the financial fortitude of Costco, making it an appealing long-term investment.
In pre-market trading on December 15, 2023, Costco's shares went up following the company's reported financial results for the first quarter, which surpassed expectations with a 6.2% year-over-year revenue increase, and an 8.2% rise in membership fee revenue, demonstrating operational success and strong market appeal (Proactive Investors).
Costco announced a significant move by distributing a special cash dividend of $15 per share, the largest to date, confirming its robust cash position and commitment to shareholder value. The company's overall results bore witness to strong earnings growth and resilience against macroeconomic challenges, reinforcing investor confidence and the robustness of Costco's business model (Daniel Sparks, The Motley Fool, December 14, 2023).
Finally, the Zacks Consensus Estimate for Costco beat both earnings and revenues for four consecutive quarters. This performance, along with the positive anticipation of future guidance, highlighted the strength of Costco's shares and suggested a favorable trajectory for the stock. The retailer's performance within the broader industry context and its exceptional market performance, indicated by a strong rise in share value, solidified its market dominance (Zacks Equity Research, December 14, 2023).
The volatility of Costco Wholesale Corporation (COST) from January 22, 2019, to January 18, 2024, can be summarized as follows: The volatility model used to assess the fluctuations in the company's asset returns, specifically an ARCH model, indicates that returns do not have a persistent mean trend. The statistical significance of the model parameters suggests that current and past returns significantly influence future volatility. The parameter known as 'omega' is estimated to be 1.5426, suggesting a baseline level of volatility, while 'alpha[1]', which measures the extent to which past squared returns impact current volatility, has a value of 0.3587, indicating a moderate effect from recent return shocks.
| Statistic Name | Statistic Value |
|---|---|
| Dep. Variable | asset_returns |
| R-squared | 0.000 |
| Mean Model | Zero Mean |
| Adj. R-squared | 0.001 |
| Vol Model | ARCH |
| Log-Likelihood | -2227.50 |
| AIC | 4459.00 |
| BIC | 4469.27 |
| No. Observations | 1,256 |
| Df Residuals | 1256 |
| Df Model | 0 |
| omega | 1.5426 |
| alpha[1] | 0.3587 |
Analyzing the financial risk of a $10,000 investment in Costco Wholesale Corporation (COST) over one year requires a deep dive into the dynamic nature of stock market variations. An initial step involves utilizing advanced volatility modeling techniques to assess how the price fluctuations of Costco's stocks might behave in the near future. This volatility modeling serves as a statistical approach to measure the dispersion of returns for a given security, incorporating the time-varying nature of market conditions and inherent volatilities.
To complement the insights derived from volatility modeling, machine learning predictions can provide a tool for forecasting future stock returns. The ensemble method involved uses numerous decision trees to aggregate predictions which typically yields robust outcomes less prone to overfitting compared to some other predictive models. In this context, this machine learning model digests various features, potentially including historical stock prices, trading volumes, financial ratios, and macroeconomic indicators to estimate what returns might look like moving forward.
Given that the volatility modeling helps understand how erratic Costco's stock might be, and the predictive algorithm forecasts the direction and magnitude of potential returns, these two methods combine to inform the overall risk profile of the investment. The synthesis of these models allows for the calculation of the Value at Risk (VaR), which is a statistical technique used to measure and quantify the level of financial risk within a firm or investment portfolio over a specific time frame.
With a calculated annual VaR at a 95% confidence interval of $167.21 for a $10,000 investment, this suggests that there is a 5% chance that an investor could experience a loss greater than $167.21 over the course of a year. This means that under normal market conditions, an investor should be 95% confident that they would not lose more than $167.21 in the ensuing year based on the models' outputs.
The integration of volatility modeling with predictive analytics affords a comprehensive evaluation of potential risks involved in investing in Costcos equity. Volatility modeling captures the essence of the stocks unpredictable movements, while the prediction mechanism harnesses past patterns and other relevant data points to forecast future performance, consolidating an informed risk assessment. This integrated approach provides a nuanced understanding of what an investor might face when considering a substantial allocation of capital into Costcos shares.
Similar Companies in Discount Stores:
Walmart Inc. (WMT), Dollar Tree, Inc. (DLTR), BJ's Wholesale Club Holdings, Inc. (BJ), Big Lots, Inc. (BIG), Target Corporation (TGT), Dollar General Corporation (DG), Walmart Inc. (WMT), Target Corporation (TGT), BJ's Wholesale Club Holdings, Inc. (BJ), Dollar General Corporation (DG), Dollar Tree, Inc. (DLTR), The Kroger Co. (KR), Report: Amazon.com, Inc. (AMZN), Amazon.com, Inc. (AMZN)
https://www.zacks.com/stock/news/2193244/why-the-market-dipped-but-costco-cost-gained-today
https://www.fool.com/investing/2023/12/06/how-costco-crushes-competitors-like-target-and-wal/
https://www.proactiveinvestors.com/companies/news/1035434?SNAPI
https://seekingalpha.com/article/4656487-bjs-wholesale-club-the-next-costco-on-the-way
https://www.fool.com/investing/2023/12/08/10-top-stocks-to-buy-in-2024/
https://seekingalpha.com/article/4657153-bjs-wholesale-club-investors-note-there-only-one-costco
https://www.fool.com/investing/2023/12/11/costco-stock-has-a-lot-to-prove-this-week/
https://www.zacks.com/stock/news/2196251/big-week-for-fed-fomc-and-key-inflation-data
https://www.zacks.com/stock/news/2197506/costco-cost-to-post-q1-earnings-a-look-at-comps-dynamics
https://www.fool.com/investing/2023/12/14/3-resilient-growth-stocks-to-buy-in-december/
https://www.proactiveinvestors.com/companies/news/1036269?SNAPI
https://www.fool.com/investing/2023/12/14/costco-to-pay-special-dividend-of-15-per-share-wha/
https://www.zacks.com/stock/news/2198286/costco-cost-q1-earnings-and-revenues-beat-estimates
https://www.sec.gov/Archives/edgar/data/0000909832/000090983223000065/cost-20231126.htm
Copyright © 2024 Tiny Computers (email@tinycomputers.io)
Report ID: MFnRyU
https://reports.tinycomputers.io/COST/COST-2024-01-18.html Home