Elastic N.V. (ticker: ESTC)
2024-03-06
 Elastic N.V. (ticker: ESTC), based in Amsterdam, the Netherlands, is a prominent player in the search and data analysis sector, offering a suite of software products designed to search, analyze, and visualize data in real time. The company's Elastic Stack, which includes Elasticsearch, Kibana, Beats, and Logstash, is widely used for application search, security analytics, and operational intelligence applications. Elastic has successfully expanded its offerings to include Elastic Cloud, a hosted and managed service, along with machine learning capabilities, enhancing its product portfolio. This diversification allows the company to cater to a broad spectrum of use cases, from traditional enterprise search applications to advanced data science operations. Since its founding in 2012, Elastic has experienced significant growth and has become a key technology provider for businesses seeking scalable and efficient data management solutions. The company's commitment to open source, combined with its commercial products, positions it well within the rapidly evolving data analytics and search engine markets.
| Full Time Employees | 3,161 | CEO Total Pay | $1,140,872 | COO Total Pay | $779,539 |
| Market Cap | $10,925,852,672 | Volume | 2,094,326 | Average Volume | 1,450,971 |
| Previous Close | $108.40 | 52 Week Low | $50.21 | 52 Week High | $136.06 |
| Beta | 0.969 | Trailing PE | 225.83 | Forward PE | 77.43 |
| Price to Sales Trailing 12 Months | 9.01 | Enterprise Value | $10,508,935,168 | Profit Margins | 4.63% |
| Shares Outstanding | 100,792,000 | Market Cap | $10,925,852,672 | Total Cash | $1,015,025,984 |
| Total Revenue | $1,212,263,040 | Debt to Equity | 84.26 | Revenue Per Share | 12.3 |
| Return on Assets | -4.03% | Return on Equity | 10.27% | Operating Cashflow | $115,369,000 |
| Revenue Growth | 19.4% | Gross Margins | 74.01% | Operating Margins | -7.84% |
| Statistic Name | Statistic Value | Statistic Name | Statistic Value |
| Sharpe Ratio | 1.159317198098139 | Sortino Ratio | 25.22222504754726 |
| Treynor Ratio | 0.45357415779573934 | Calmar Ratio | 3.7604513947560356 |
The analysis of Elastic NV (ESTC) commences with a comprehensive review of its latest technical indicators, fundamental data, and an evaluation of its financial health, alongside risk-adjusted performance metrics to infer the prospective price movement over the forthcoming months.
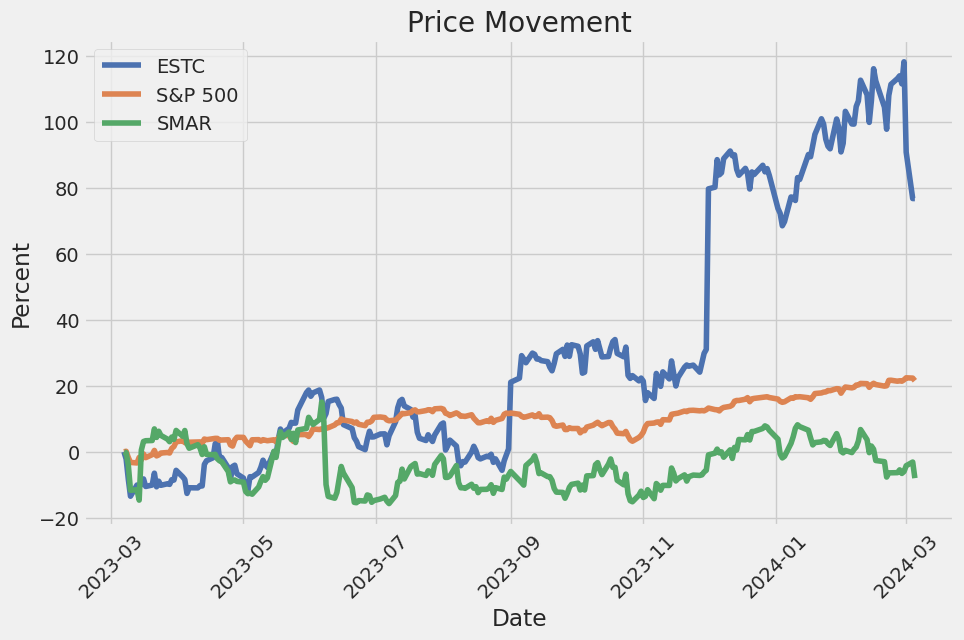
The closing days of trading for ESTC exhibit notable volatility with the stock opening at $75.14 and experiencing a tumultuous journey, concluding at a significantly higher point. This volatility paired with the escalating On Balance Volume (OBV) from 0.25071 to 2.14291 million underscores rising investor interest, potentially indicating accumulation. Despite the evident downtrend in the Moving Average Convergence Divergence (MACD), reflecting short-term bearishness towards the end, such movements are characteristic of corrections within broader bullish trends.
Fundamental analysis illuminates ESTCs robust gross margins at 74.012%, although operational inefficiencies yield negative EBITDA and operating margins. The substantial research and development, alongside sales and marketing expenses, articulate a strategic emphasis on growth through innovation and market penetration. The balance sheet denotes a healthy cash and cash equivalents position, enhancing liquidity and investment potential. Nevertheless, the increasing total debt warrants scrutiny, juxtaposed against a substantial increment in total assets.
Risk-adjusted performance metrics such as the Sharpe, Sortino, Treynor, and Calmar ratios provide an illustrious picture of ESTC's investment profile. A Sharpe ratio of 1.1593 reveals that the company has offered returns that comparatively surpass the risk-free rate, considering the volatility inherent in those returns. The Sortino ratio of 25.2222 further accentuates the upside, displaying a high level of returns on the downside volatility. The Treynor and Calmar ratios corroborate that ESTC has adeptly rewarded investors per unit of systematic risk and has demonstrated commendable resilience amidst adverse market conditions, respectively.
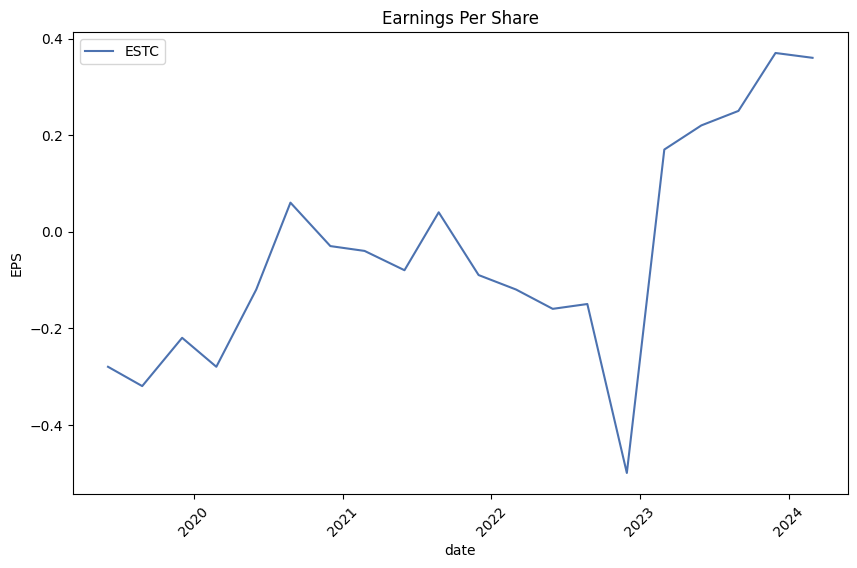
Complementing this analysis are the growth prospects gauged through analyst expectations. Anticipated earnings momentum into 2025, with a notable ascent in earnings estimates and a projected 17.5% sales growth, underscores a positive outlook bolstered by the industry's ongoing innovation and expansion.
Considering the above insights gleaned from a synthesis of technical, fundamental, and performance metrics analysis, ESTC is poised for probable growth over the next few months. While the MACD histogram suggests caution, the broader indicators, coupled with sound fundamentals and optimistic future earnings projections, support a bullish sentiment. This outlook, however, remains contingent on the company's continued innovation leadership, effective capitalization of growing market opportunities, and adept financial management amid volatile market conditions. Investors are encouraged to monitor forthcoming financial disclosures and market trends closely, as these could further inform the stock's trajectory.
In evaluating the financial performance and attractiveness of Elastic N.V. (ESTC) using the methodologies outlined in "The Little Book That Still Beats the Market," we have calculated two key metrics: the return on capital (ROC) and the earnings yield. The return on capital (ROC) for Elastic N.V. is calculated at -18.29601417131594%. This negative figure suggests that the company is currently generating a loss on the capital it has employed. Such a scenario often indicates that the company might be facing operational challenges, investing heavily in future growth, or experiencing other factors that are temporarily affecting its profitability. On the other hand, the earnings yield for Elastic N.V. is determined to be -2.2785977859778597%. Just like the ROC, a negative earnings yield signifies that the company is currently unprofitable. The earnings yield is a crucial metric as it helps investors gauge the potential return on an investment in comparison to alternatives like bonds or other stocks, with a higher earnings yield typically indicating a potentially undervalued stock. However, in this case, the negative yield points to a lack of earnings relative to the company's share price. In summary, both the negative ROC and earnings yield for Elastic N.V. suggest that investors should proceed with caution, taking into account the potential for future growth against the current lack of profitability.
| Statistic Name | Statistic Value |
| R-squared | 0.241 |
| Adj. R-squared | 0.240 |
| F-statistic | 398.0 |
| Prob (F-statistic) | 4.05e-77 |
| Log-Likelihood | -3264.1 |
| No. Observations | 1,256 |
| AIC | 6532. |
| BIC | 6542. |
| Const | 0.0007 |
| Beta | 1.3896 |
| Std Err | 0.070 |
| t | 19.949 |
| P>|t| | 0.000 |
| [0.025 | 1.253 |
| 0.975] | 1.526 |
| Omnibus | 504.602 |
| Prob(Omnibus) | 0.000 |
| Skew | 1.253 |
| Kurtosis | 19.270 |
| Cond. No. | 1.33 |
The linear regression analysis of ESTC relative to SPY, which represents the broader market, demonstrates a relationship where ESTC exhibits a noticeable sensitivity to market changes, encapsulated by a beta value of 1.3896. High beta indicates that ESTC's movements are more volatile than the market. This suggests that if SPY moves by 1%, we'd expect ESTC to, on average, move by approximately 1.39%. The analysis also generated an alpha () of 0.0007088245519211462, indicating that ESTC has a slight positive average return over the benchmark after accounting for its inherent risk, albeit extremely small and statistically insignificant given the p-value (P>|t|) associated with the constant term (0.994), questioning alpha's relevance in this model.
The statistical model's overall explanatory power, reflected by an R-squared of 0.241, suggests that about 24.1% of ESTC's movements can be explained by the movements in SPY. This leaves a substantial portion, nearly three-quarters, of ESTC's variability unaccounted for by this model, hinting at other factors or specific company circumstances influencing ESTC's price action independently of market movements. The large F-statistic (398.0) with an extremely low probability indicates that the regression model is statistically significant. Despite the model showing statistical significance, the practical significance is subject to interpretation due to the small alpha and the incomplete explanation of ESTC's variability by SPY alone.
Elastic N.V. (ESTC) reported its financial results for the third quarter of Fiscal Year 2024, highlighting robust growth and positive momentum across its product portfolio. CEO Ash Kulkarni emphasized the company's excellent performance attributed to continuous innovation, customer-centric focus, and disciplined business management. The company experienced significant interest in generative AI, with customers increasingly recognizing the advantages of Elastic's platform over competitive offerings. This interest, combined with ongoing platform consolidation efforts where customers migrate to the Elasticsearch platform for multiple use cases like log analytics and SIEM, and stable cloud consumption patterns, underscored a strong quarter for the company.
Financially, Elastic showcased substantial growth with a 19% year-over-year increase in revenue, with Elastic Cloud revenue growing by 29% year-over-year. This growth was driven primarily by customer traction in the cloud and further consolidation onto the Elastic platform. Furthermore, the company exceeded its profitability guidance, reporting a non-GAAP operating margin of 13%. These results are a testament to Elastic's effective execution and the growing appreciation for its differentiated offerings in search analytics platforms, which are becoming integral to IT infrastructure stacks for log analytics, SIEM, and generative AI applications.
Kulkarni also delved into the trends shaping the company's business trajectory. He elaborated on the increasing utilization of Elastics platform for generative AI applications, driven by the adoption of retrieval-augmented generation (RAG) patterns and existing collaboration with language models like OpenAI's GPT-4. Customers such as Consensus and Stack Overflow were highlighted as success stories where Elastic's scalable, integrative, and innovative solutions have been pivotal. Furthermore, Elastic's strategic focus is not merely on generative AI; it also continues to capture market share in observability and security by dislodging incumbent solutions and facilitating platform consolidation. Elastic's observability and security solutions are built on the Elasticsearch foundation, enabling advanced search and analytics capabilities that are imperative for modern enterprises.
Chief Financial Officer Janesh Moorjani provided further insights into the company's financial health and future outlook. He detailed the third quarter's performance, with a total revenue of $328 million, marking a 19% increase year-over-year, and highlighted how subscription revenues, especially from Elastic Cloud, played a significant role in this growth. Elastic's strategic investments and discipline in managing expenses were underscored as crucial factors contributing to the strong performance and profitability. Moorjani also provided guidance for the fourth quarter of Fiscal Year 2024 and shared preliminary thoughts on Fiscal Year 2025, where Elastic plans to ramp up investments in generative AI to capture the burgeoning market opportunity while maintaining a balanced approach to investing for growth and profitability. Elastic's confidence in its business model, strategy, and the expanding market opportunity is evident as it gears up to sustain momentum and drive significant revenue growth in the coming years.
ion allowances. The release of the valuation allowance was a result of the Company's assessment that it is more likely than not that its U.S. federal and certain states deferred tax assets will be realized, reflecting the Company's continued profitability and anticipated future earnings. Net Income (Loss) The net income was $176.1 million for the three months ended January 31, 2024, compared to a net loss of $72.6 million for the same period of the prior year. The change was primarily due to a $202.8 million tax benefit recognized during the period as a result of the valuation allowance release, coupled with a 19% increase in revenue and a decrease in restructuring and other related charges.
The substantial tax benefit had a significant impact on net income for the three months ended January 31, 2024. Management continues to closely monitor the economic landscape, remaining responsive to changes in customer behavior and market conditions while investing strategically in growth opportunities, particularly in Elastic Cloud, which has been a key driver of revenue growth.
Throughout this period, the Company also continued to realize efficiencies in managing subscription costs relative to revenue growth, which contributed to an improvement in total gross margin. These factors combined led to a turn from a net loss to a net gain within the quarter under review, notwithstanding the ongoing investments in research and development, sales and marketing, and general administration aimed at supporting the Company's strategic growth initiatives and the expansion within its customer base.
Elastic N.V. (NYSE: ESTC) has positioned itself as a significant entity within the realm of search and data analytics, underlining its potential and adaptability in a rapidly evolving technological landscape. The company, renowned for its Elastic Search technology, has broadened its suite to include observability and security solutions, aligning with contemporary demands for comprehensive data management and cybersecurity measures. Its notable involvement with prestigious clients, including Walmart, and integration within over 50% of Fortune 500 companies, underscores the trust and reliance placed on its capabilities to navigate complex, unstructured data landscapes, thereby enhancing operational efficiencies across varied sectors.
Elastic's financial performance, as depicted in recent fiscal reports, illustrates a trajectory of sustained growth and operational excellence. With a 19% year-over-year increase in revenue during the fiscal third quarter of 2024, buoyed by a significant 29% growth in its Elastic Cloud offering, the company showcases both its market relevance and the adaptation of its business model towards cloud-centric solutions. This strategic emphasis is further evidenced by the cloud segment accounting for 44% of the company's total revenue, marking a decisive pivot towards leveraging cloud technology for scalable, efficient service delivery.
The fiscal third-quarter earnings call, enriched by insights from Elastic's leadership, highlighted not only the company's financial acumen but also its strategic foresight in navigating competitive landscapes. The introduction of generative artificial intelligence (AI) initiatives, particularly through collaborations that leverage the Elasticsearch Relevance Engine (ESRE), marks a decisive step toward embracing emergent technologies. Such initiatives reflect Elastic's commitment to innovation, ensuring its offerings remain at the forefront of search and data analytics solutions.
Moreover, Elastic's focus on expanding its customer base, as evidenced by an increasing number of clients with significant annual contract values, aligns with its goal of driving sustainable growth. This strategic customer acquisition and retention, coupled with a robust net expansion rate, underpin the company's resilient market positioning amid volatile economic climates. Elastic's operational strategies, underscored by judicious investments in AI and cloud technologies, signal a nuanced understanding of market dynamics and an unwavering commitment to innovation.
However, Elastic's journey is not devoid of challenges. The stock market's reaction to the company's quarterly earnings, particularly the notable price decline despite surpassing earnings and sales expectations, reflects the intricacies of investor sentiment and market dynamics. This volatility illuminates the broader challenges faced within the tech industry, where rapid advancements and shifting investor expectations can dramatically affect market valuations.
The diversified engagement across enterprise search, observability, and security solutions positions Elastic as a comprehensive data management and cybersecurity provider. This strategic positioning, supported by a profound understanding of market needs and technological advancements, underscores Elastic's potential to navigate the multifaceted landscapes of modern data management challenges. Elastic's remarkable achievement of turning a substantial net profit, from a previous year's loss, emphasizes its operational efficiency and strategic direction focusing on profitability and growth.
Elastic N.V.'s journey through fiscal 2024, marked by operational efficiencies, strategic investments, and an acute focus on future-ready technologies like generative AI, defines its approach towards ensuring long-term sustainability and market leadership. As the company looks towards leveraging opportunities presented by evolving technological paradigms, its strategic initiatives across cloud adoption, AI integration, and platform consolidation are poised to drive further growth. Elastic's fiscal and strategic narrative, thus far, outlines a vision of adaptive evolution, customer-centric innovation, and a steadfast approach towards navigating the complexities of the global tech landscape, positioning it as a key protagonist in the narrative of technological advancement and market leadership in the realm of search and data analytics.
Elastic N.V. (ESTC) experienced considerable volatility over the period analyzed, as indicated by an ARCH model focusing solely on volatility without considering the mean return of the asset. The model's omega value of 13.1206, with a significant p-value, suggests a high base level of variance in the asset's returns. Moreover, the alpha coefficient indicates how past volatility shocks influence future volatility, although in this case, the significance level suggests that the impact might not be as robust or predictable.
| Statistic Name | Statistic Value |
|---|---|
| Mean Model | Zero Mean |
| Vol Model | ARCH |
| Log-Likelihood | -3434.37 |
| AIC | 6872.74 |
| BIC | 6883.01 |
| No. Observations | 1256 |
| omega | 13.1206 |
| alpha[1] | 0.0650 |
When analyzing the financial risk of investing $10,000 in Elastic N.V. (ESTC) over a one-year period, a comprehensive approach employing both volatility modeling and machine learning predictions provides a deep understanding of potential risks and returns. The volatility modeling, specifically, is a crucial tool for understanding how the price of Elastic N.V. stock fluctuates over time. By constructing a model based on historical price data, it's possible to estimate the level of volatility in future periods. This analysis is essential because high volatility often translates to higher risk; thus, by accurately modeling and forecasting volatility, investors can get a sense of the risk associated with their investment.
On the other hand, machine learning predictions, particularly using an algorithm based on decision trees that can handle regression tasks, offer insights into the potential future returns of Elastic N.V. This method involves analyzing historical data, including stock prices and possibly other related financial metrics, to learn patterns that can predict future stock performance. By incorporating numerous variables and their interactions, this machine learning approach can provide a nuanced forecast that takes into account the complexities of the market.
Integrating the insights from volatility modeling with those from machine learning predictions allows for a comprehensive risk assessment. Specifically, the Value at Risk (VaR) calculation at a 95% confidence interval becomes a critical metric in this analysis. The calculated VaR of $600.49 on a $10,000 investment in Elastic N.V. provides a quantifiable measure of the maximum expected loss over a year, with 95% confidence. This means that, under normal market conditions, there's only a 5% chance that the investor would lose more than $600.49 on this investment over the specified period.
This integrated approach, combining the detailed volatility forecast with the predictive power of machine learning regarding returns, sheds light on the investment's risk profile in a nuanced way. The calculated VaR is especially valuable because it offers a concise, quantifiable risk measure, while the methodologies behind itcapturing both the volatility aspect and the expected returncover a broader spectrum of the factors that influence investment risk. This analysis not only illustrates the potential financial risks involved but also underscores the effectiveness of leveraging both volatility modeling and machine learning predictions in gaining a more accurate and comprehensive understanding of these risks.
In analyzing the options chain for Elastic N.V. (ESTC) call options, the aim is to identify the most profitable options considering a target stock price increase of 5% over the current price. To do this, we analyze the Greek parameters - Delta, Gamma, Vega, Theta, and Rho - alongside the strike price, days to expiration, premium, ROI, and profit of each option.
Options with a higher Delta value, approaching 1, indicate they are more likely to move in line with the stock price, making them potentially more profitable as the stock price approaches the target increase. However, a balance with other Greeks such as Theta and Vega, which represent the sensitivity of the option's price to time decay and volatility respectively, is crucial.
One notable option is the call with an expiration date on 2024-08-16 and a strike price of $90. It has a Delta of 0.7437819198, indicating a strong positive correlation with the stocks price movement. With a high ROI of 2.1342105263 and a significant profit of 16.22, this option presents a good balance between risk and potential reward. The Theta of -0.0607685215 suggests that time decay is relatively moderate, which is beneficial given the option's longer time to expiration.
Another compelling option expires on 2025-01-17 with a strike price of $35. It carries a Delta of 1.0, meaning it moves dollar for dollar with the stock price, which is highly advantageous for achieving the target price increase. It also has a notably low Theta (-0.0038274182), indicating minimal value loss over time due to time decay. With an ROI of 1.0472727273 and a profit of 40.32, this option stands out for its potential profitability over a longer term.
For a more short-term approach, the option expiring on 2024-03-15 with a strike price of $105 showcases a Delta of 0.6733696189, a high Vega of 5.7878144357, and a Thai of -0.2033649236. Though it has a relatively high sensitivity to price changes and volatility, which could imply higher risk, its ROI of 0.8 and a profit of 3.92 suggest it could be profitable if the stock moves towards the target price rapidly.
Lastly, the option with an expiration date of 2024-06-21 and a strike price of $65 carries a Delta of 0.869550233, indicating a strong likelihood to increase in value with the stock. Additionally, its high ROI of 1.2497695853 and a profit of 27.12 make it an attractive option for medium-term investment. The Vega of 12.3872986766 suggests a good level of responsiveness to volatility, which could be advantageous if market conditions are favorable.
In conclusion, while each of these options presents potential for profitability, investors should consider their risk tolerance, investment horizon, and expectations regarding market volatility and stock price movement. The options expiring on 2024-08-16 and 2025-01-17, in particular, demonstrate a compelling balance of high Delta, moderate to low Theta, and significant profits, making them prime candidates for investors aiming for the target stock price increase.
Similar Companies in SoftwareApplication:
Smartsheet Inc. (SMAR), Report: GitLab Inc. (GTLB), GitLab Inc. (GTLB), Amplitude, Inc. (AMPL), Sprinklr, Inc. (CXM), Fastly, Inc. (FSLY), Datadog, Inc. (DDOG), Bill.com Holdings, Inc. (BILL), RingCentral, Inc. (RNG), Dynatrace, Inc. (DT), PagerDuty, Inc. (PD), monday.com Ltd. (MNDY), Domo, Inc. (DOMO), Asana, Inc. (ASAN), Atlassian Corporation (TEAM), HubSpot, Inc. (HUBS), Cadence Design Systems, Inc. (CDNS), Splunk Inc. (SPLK), Sumo Logic, Inc. (SUMO), New Relic, Inc. (NEWR)
https://seekingalpha.com/article/4675087-elastic-n-v-estc-q3-2024-earnings-call-transcript
https://finance.yahoo.com/m/aedabf7f-fb46-3dde-80ed-3a354caae012/dow-jones-futures-fall%3B.html
https://finance.yahoo.com/news/q3-2024-elastic-nv-earnings-155958603.html
https://finance.yahoo.com/news/why-elastic-estc-stock-trading-164031346.html
https://finance.yahoo.com/m/1d868bd5-8f46-3fd8-b4f8-f265ae5d9e07/elastic-posts-earnings-beat.html
https://finance.yahoo.com/news/decoding-elastic-nv-estc-strategic-050113878.html
https://finance.yahoo.com/news/elastic-third-quarter-2024-earnings-125638524.html
https://finance.yahoo.com/news/elastic-n-v-nyse-estc-132631514.html
https://www.youtube.com/watch?v=AzZv-uPD2uw
https://finance.yahoo.com/m/e1c7835b-5097-3af3-86f5-edcb9fe8dea9/analyst-report%3A-elastic-n.v..html
https://www.sec.gov/Archives/edgar/data/1707753/000170775324000006/estc-20240131.htm
Copyright © 2024 Tiny Computers (email@tinycomputers.io)
Report ID: 2uY45b
Cost: $0.77758
https://reports.tinycomputers.io/ESTC/ESTC-2024-03-06.html Home