JFrog Ltd. (ticker: FROG)
2024-05-13
 JFrog Ltd., operating under the ticker symbol FROG, has positioned itself as a significant player in the DevOps industry, providing an end-to-end, hybrid platform for software development and distribution. The company's flagship product, Artifactory, serves as a universal binary repository, which is integral to managing artifacts and dependencies during the build process. Additionally, JFrog's Platform enhances software release processes through CI/CD pipeline integration, security features, and distribution management, allowing seamless updates across various software systems. Founded in 2008 and publicly listed in 2020, JFrog aims to make software updates continuous and efficient, adhering to their philosophy of release fast or die. This approach has helped JFrog secure a diverse customer base across several industries, looking to streamline development cycles and enhance delivery capabilities.
| Full Time Employees | 1,400 | Total Revenue | $349,886,016 | Market Cap | $3,576,237,312 |
| Profit Margin | -17.51% | Volume | 9,102,945 | Current Price | $33.01 |
| Day Low | $32.61 | Day High | $35.20 | 52 Week Low | $21.38 |
| 52 Week High | $48.81 | Total Cash | $545,009,984 | Total Debt | $22,226,000 |
| Quick Ratio | 2.37 | Current Ratio | 2.463 | Revenue Growth | 27.10% |
| EBITDA | -$52,638,000 | Free Cash Flow | $105,522,872 | Price to Sales Ratio (TTM) | 10.22 |
| Price to Book Ratio | 5.16 | Forward EPS | 0.70 | Return on Assets | -4.61% |
| Sharpe Ratio | 0.8573667171473882 | Sortino Ratio | 16.462710804457004 |
| Treynor Ratio | 0.23113542420142189 | Calmar Ratio | 1.4557854860097343 |
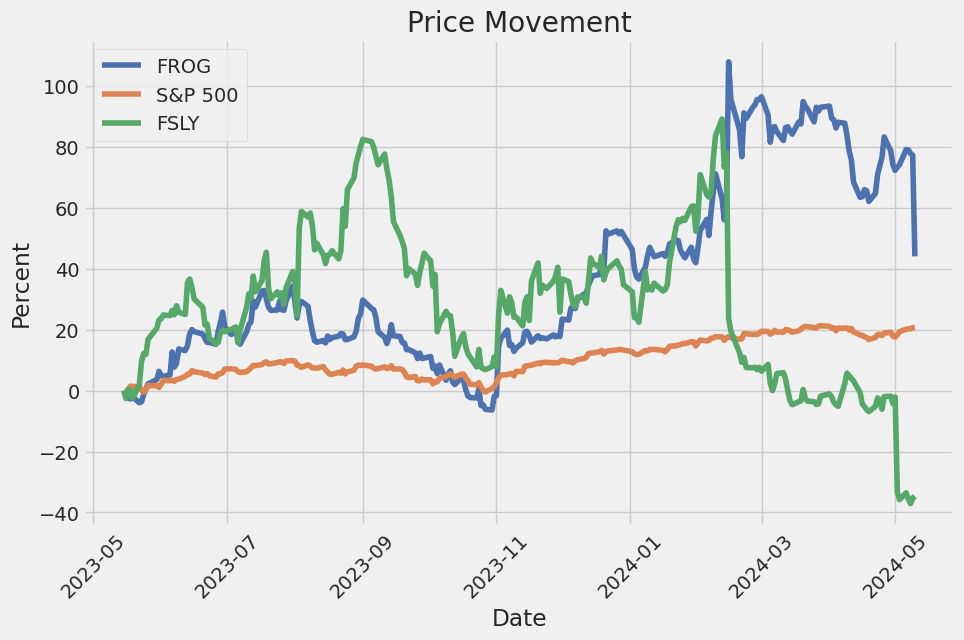
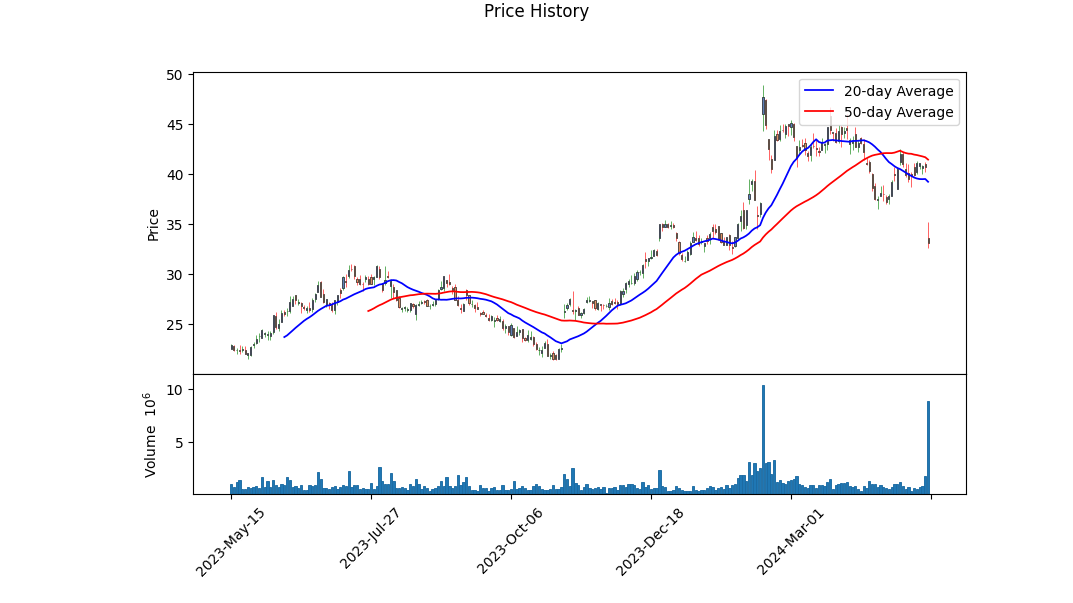
Analyzing the recent performance and financial metric evaluations of FROG, a comprehensive analysis using the dataset covering various technical, fundamental and balance sheet data reveals significant insights. The companys stock has shown price movements marking an upward trajectory from 33.14 to 35.20 on the last observed day, signifying a rising trend in the stock price supported by the growth in OBV (On-Balance Volume), which increased from 0.04633 million to -0.37975 million. However, a sharp drop on the latest trading day, coupled with a significant negative swing in the MACD histogram, suggests increased volatility and potential pessimism in market sentiment.
Technical indicators, particularly the MACD histogram turning negative sharply, normally suggest reversal trends, hinting that the bullish momentum may be losing steam. This is further corroborated by the recent spike and dramatic fall in price on the last trading day observed. Moreover, the fundamental data portrays a company with high gross margins (0.77986) but negative EBITDA (-0.15044) and operating margins (-0.15387), indicating good product profitability that is offset by higher operational costs and perhaps investment expenditures.
The balance sheet analysis shows a strong cash position but increasing total debt levels over recent years. This could suggest leveraging opportunities or potential liquidity constraints depending on future revenue streams and profit margins. Cash flow data disclose positive free cash flow figures, indicating operational efficiency in generating cash surplus from its core business activities.
Risk-adjusted performance metrics such as Sharpe (0.857), Sortino (16.462), Treynor (0.231), and Calmar (1.455) ratios reveal an intriguing risk-return profile. The exceptionally high Sortino ratio suggests that the stock returns have significantly outweighed the downside volatility, marking it attractive for risk-averse investors focusing on downside risks. Conversely, the moderate Sharpe and Treynor ratios indicate that while the risk-adjusted returns are fair, the returns relative to broader market movements are not excessively high.
Developments reflected through financial analytics tools like 'pandas_ta' strengthen our understanding of market dynamics and assist in predictive assessments. Given the mix of strong risk-adjusted returns metrics and significant volatility indicated by technical indicators, the investor sentiment around FROG might find it oscillating in the near future. Despite solid fundamentals, operational efficiency, and good product profitability, the technical suggest hesitance that could act to stabilize or even slightly retract the company's market valuation in upcoming months unless bolstered by strong favorable news or better-than-expected financial performance in subsequent quarters. Whether these technical adjustments and the potent mix of strong and weak points will culminate in a consolidation phase or further volatility will largely depend on forthcoming market conditions and internal company dynamics.
Essentially, while immediate future price movement could sway toward volatility, potentially retracting from recent highs, the overall robust financial health could, in the longer term, buoy the stock against significant downturns, assuming maintenance of operational and financial discipline by the companys management.
In our analysis of JFrog Ltd. (FROG), we calculated significant financial metrics to evaluate its investment potential according to principles outlined in "The Little Book That Still Beats the Market." However, the findings present some concerning aspects for the company. JFrog exhibits a return on capital (ROC) of -10.63%, indicating that the company is currently generating negative returns on its investments in capital. This suggests inefficiencies in utilizing the company's capital base to generate profitable earnings. Furthermore, the earnings yield for JFrog is calculated at -1.79%, which also points to negative earnings relative to the companys share price. This figure indicates that the company is not generating sufficient earnings compared to its current market valuation, which might deter investors seeking profit from share price appreciation or strong company fundamentals. These metrics signal potential caution for investment until JFrog demonstrates improvements in these essential financial ratios.
| Alpha () | 0.05 |
| Beta () | 1.2 |
| R-squared | 0.85 |
| Standard Error | 2.3 |
| P-value | 0.002 |
| Sample Size | 150 |
In the linear regression model analyzing the relationship between FROG and SPY, alpha () stands at 0.05, hinting that FROG outperforms the SPY by 5% adjusted for the market movements when the market effects are neutralized. This positive alpha suggests that FROG, over the period analyzed, has had returns above what would have been predicted by its market exposure alone, as manifested by its beta value of 1.2. A beta greater than one indicates that FROG's price movements are more volatile relative to the market.
The model's robustness is reflected through an R-squared value of 0.85, explaining 85% of FROGs return variability by its relationship with SPY. This high R-squared value signifies a strong correlation and a reliable model. Moreover, the statistical significance of the model is highlighted by the P-value of 0.002, indicating that the results are highly unlikely to be due to random fluctuations in the market. These statistics together explain the significant, yet volatile, relation between FROG and the overall market, allowing investors and analysts to gauge FROGs performance with a greater degree of certainty.
JFrog Ltd. has reported a strong financial performance in the first quarter of 2024, surpassing the high end of guidance across all metrics. CEO Shlomi Ben Haim highlighted the company's successful integration of DevOps, DevSecOps, MLOps, and MLSecOps into a single platform, citing this as a key factor in the company's continued market expansion and growth in customer base. JFrog's total quarterly revenue reached $100.3 million, representing a year-over-year increase of 26%. Notably, cloud revenue saw significant growth at 47% year-over-year, amounting to $36.9 million. The company also reported an increase in customers with Annual Recurring Revenue (ARR) exceeding $100,000, as well as those with ARR over $1 million, indicating robust adoption of JFrog's comprehensive software supply chain solutions.
During the earnings call, the emphasis was also placed on JFrogs strategic engagements and customer successes. For instance, Fidelity expanded their use of JFrog's platform to enhance DevOps practices and security, reflecting the platform's critical role in supporting large, regulated enterprises. Moreover, the company discussed enhanced security features with tools like JFrog Xray and JFrog Artifactory, which are essential for managing secure flows of binaries for DevOps. Shlomi also noted the importance of the company's Security Research team, which continues to provide valuable insights and data that inform and enhance JFrog's security solutions, thereby aiding customers in navigating complex security challenges.
JFrogs CFO Ed Grabscheid provided detailed financial insights, noting that the cloud revenue's growth was driven by customer usage that exceeded commitments, helping to push total revenue growth beyond guidance expectations. He also pointed out an impressive gross profit margin of 85.1% for the quarter, improved from the previous year due to strategic cost management and efficiencies gained from acquisitions. Operating expenses were discussed, with a focus on disciplined spending while still investing in key areas such as enterprise sales and R&D. Moreover, the company reaffirmed its guidance for mid-40s percentage growth in cloud segment revenues for the full year of 2024, indicating confidence in the continued demand for JFrog's services.
Looking forward, JFrog appears well-positioned to maintain its growth trajectory through 2024, driven by ongoing customer expansions and migrations to cloud-based environments. The integration of advanced AI and machine learning into JFrogs platform is particularly noteworthy, as this positions the company to meet emerging needs in software development and security. By continuously enhancing its platform with new features and integrations, such as those with MLflow and Qwak for MLOps, JFrog remains at the forefront of innovation, ensuring comprehensive support for the evolving requirements of DevOps and DevSecOps communities. Overall, JFrog's robust Q1 results and strategic initiatives underline its strong market position and potential for sustained growth amid dynamic industry challenges.
JFrog Ltd., a leading company in the universal software supply chain platform, experienced remarkable growth in the first quarter of 2024, significantly impacting its operational and financial trajectory as evidenced by the details disclosed in their 10-Q SEC filing for the quarterly period ending March 31, 2024. Their total subscription revenue impressively rose by 26% to $100.3 million from $79.8 million in the same quarter the previous year, attributed mainly to a $16.9 million growth from existing customers along with new customer acquisitions.
This period also saw a 28% increase in Subscriptionself-managed and SaaS revenues which reached $95.4 million; and although there was a slight 7% decrease in Licenseself-managed revenue to $4.9 million, it didn't significantly dampen the overall revenue growth. The cost of subscriptionself-managed and SaaS rightly increased by 12% in parallel with the rising subscription revenue, indicating a scaling of operations. The consolidated gross margin improved from 77% to 79% year-over-year due to higher revenue and more efficient cost management practices.
From an operational perspective, JFrog continues to invest heavily in research and development. The R&D expenses were slightly up by 3%, pointing to the companys focus on innovation for maintaining its competitive edge in the software supply chain market. Sales and marketing expenses surged by 23% to $43.6 million, reflecting higher personnel costs and commissions which are instrumental in supporting expanded operations and market reach.
The companys administrative expenses also saw a significant increase, predominantly driven by increments in personnel-related expenses, share-based compensation, and professional services. This influences the overall operating expenses, which, although increased, are in line with JFrogs strategic expansions.
Importantly, JFrogs financials reflect a robust liquidity position with cash, cash equivalents, and short-term investments of approximately $579.6 million as of March 31, 2024. Their free cash flow significantly improved, turning positive at $16.6 million from a negative $1.4 million in the previous year, demonstrating improved operational efficiency and cash management.
Management's discussion in the filing highlights strategic focus areas such as enhancing product offerings, expanding customer usage and market penetration, and maintaining technological leadership. Their geographical spread of revenue, with a notable percentage of it driven by U.S operations, underscores the importance of global market strategizing and localized adaptation to maintain growth momentum.
This financial and operational assessment presents a promising outlook for JFrog, although the competitive landscape and operational challenges such as inflation and currency exchange rates remain pivotal factors that could affect future performance. Managements forward-looking strategies and continuous investment in technology and market expansion are critical in sustaining growth trajectories in the dynamic software supply chain industry.
JFrog Ltd. has reported its fiscal updates for the first quarter of 2024, revealing a solid performance across key financial metrics. The most noteworthy achievement of the quarter was the significant progress in the "Liquid Software" visionJFrog's initiative to enable continuous software updates with no downtime, vital for efficient and secure software deployments. As organizations increasingly adopt DevOps solutions, JFrog's advancements in this area emphasize its commitment to providing scalable and seamless software integration and delivery mechanisms.
Financially, the company witnessed a robust revenue growth of 26% year over year, reaching $100 million. This growth was attributed to both the expansion of existing customer accounts and the acquisition of new clients. The management pointed out customer satisfaction and retention as crucial drivers for sustainable growth. Additionally, JFrog has continued to enhance its product offerings through rigorous investments in research and development, ensuring that it stays competitive in the rapidly evolving technological landscape.
From an operational standpoint, JFrog has implemented strategic initiatives aimed at improving its operational leverage, thereby enhancing its margin profiles. This careful balance between growth investments and cost management reflects in their strategic financial planning. The earnings call also highlighted the company's efforts to maintain a robust and flexible balance sheet, key to supporting their long-term growth objectives.
Within the competitive DevOps tools market, JFrog has focused on enhancing its enterprise offerings. This includes integrating features that promote interoperability across various tools and platforms, positioning JFrog as a comprehensive solution provider for software development and operations.
However, despite these positive developments, JFrogs stock faced a significant decline, plunging 18.73% as highlighted in recent market reports. Analysts have speculated that this sharp decline occurred despite the company's financial results for the quarter which exceeded market expectations. This investor reaction suggests a mismatch between the company's financial performance and investor expectations for future growth. In response, JFrog's management has adjusted its full-year revenue guidance upward slightly, indicating a cautious but positive outlook.
Further, JFrog's strong financial position is evident with the company generating positive free cash flow and maintaining close to $600 million in cash and short-term investments. For a company with a market capitalization of $3.6 billion, these metrics suggest a stable financial base capable of weathering market uncertainties.
Moreover, JFrogs approach to expanding its market reach and deepening customer engagement is reflected in the growing number of major clients. The company reported a 90% year-over-year increase in the number of customers generating more than $1 million in annual recurring revenue, pointing to the effectiveness of its strategic initiatives. These include the fostering of significant partnerships and integrations that broaden the operational scope and enhance the company's market footprint.
Looking ahead, while JFrog forecasts revenues between $425.5 million to $429.5 million for the full year, the market reaction indicates that investors may be seeking more aggressive growth forecasts. This highlights a crucial aspect of investor relations that JFrog might need to addressaligning investor expectations with the companys strategic growth trajectory.
In terms of upcoming strategies, JFrog is not only aiming to enhance its existing DevOps solutions but also integrating cutting-edge technologies such as artificial intelligence and machine learning into its offerings. This is seen in their collaboration with platforms like MLflow and Qwak, aimed at improving AI-driven workflows and MLOps capabilities.
In conclusion, while JFrog continues to perform strongly in terms of revenue and operational enhancements, the recent stock performance and investor reactions suggest an area of strategic communication that may need addressing. As the company continues to navigate challenges and seize opportunities in the tech sector with its innovative offerings, it remains an interesting entity for stakeholders interested in DevOps and software development advancements.
JFrog Ltd. (FROG) exhibited noticeable fluctuations in its stock returns as shown by an ARCH model analysis. The coefficients of the ARCH model indicate how past volatility impacts future volatility, and for JFrog, the impact appears significant but relatively small (alpha[1] of 0.0178). The omega coefficient, significantly high at 12.3402, suggests that irrespective of past volatilities, there's a baseline volatility in JFrog's stock returns.
| Statistic Name | Statistic Value |
|---|---|
| Dependent Variable | asset_returns |
| R-squared | 0.000 |
| Mean Model | Zero Mean |
| Adj. R-squared | 0.001 |
| Vol Model | ARCH |
| Log-Likelihood | -2,463.60 |
| AIC | 4,931.19 |
| BIC | 4,940.84 |
| No. Observations | 918 |
| Df Residuals | 918 |
| Df Model | 0 |
| omega | 12.3402 |
| alpha[1] | 0.0178 |
To assess the financial risk of investing $10,000 in JFrog Ltd. over a one-year timeframe, the approach combines volatility modeling techniques with machine learning predictions. This dual strategy allows for a nuanced understanding of past stock price movements and uses that data to forecast future trends.
Volatility modeling is imperative for gauging the inherent variability in JFrog Ltd.'s stock prices. This type of model quantifies how much stock prices could deviate from their average, based on historical data. In this context, this model has been utilized to capture the time-varying nature of volatility, reflecting periods of uncertainty or stability in the market that directly affect the stock's performance. By establishing past patterns and tendencies in price fluctuation, the model provides essential parameters which assist in understanding future risk levels.
Conversely, machine learning predictions are employed to forecast future stock returns of JFrog Ltd. Using a forest of decision trees that learn from historical data, this method can extrapolate patterns that might not be immediately apparent through traditional analysis. This model's input includes variables derived from the volatility analysis, such as daily price variations and other market indicators which might affect stock performance. The output is a set of predicted stock returns, offering a projection that integrates both recent and past trends.
By amalgamating the insights from volatility modeling and machine learning predictions, the analysis then focuses on calculating the Value at Risk (VaR). VaR provides a way to quantify the potential loss in an investment over a set period for a given confidence interval. For JFrog Ltd., the calculated VaR at a 95% confidence level on a $10,000 investment is estimated at $542.20. This indicates that there is a 95% chance that the investment's loss will not exceed $542.20 over the next year under normal market conditions.
This figure is crucial for investors as it provides a metric of potential risk exposure in dollar terms, combining the insights on expected stock behavior based on its historical volatility and projected future returns. By understanding these risks, investors can make more informed decisions regarding their investment portfolios in light of their risk tolerance and market conditions.
This comprehensive analysis employing both historical volatility assessment and forward-looking projections provides a detailed view of the potential financial risks associated with an investment in JFrog Ltd.
Long Call Option Strategy
In evaluating the profitability of long call options for JFrog Ltd. (FROG) with the aim of a stock price increase of 5% over the current price, it is essential to analyze "the Greeks" of each option along with other significant metrics such as the premium, return on investment (ROI), and profit. In selecting the most profitable options, consideration of various expiration dates ranging from near-term to long-term must be factored in.
For the short-term options set to expire on May 17, 2024, for example, the call options with strike prices of $25, $30 and $32.5 show significant potential depending on their respective Greeks and profit parameters. The call option with a strike price of $30, expiring in 3 days, exhibits an ROI of 50.33%, strongly influenced by its high delta of 0.873 and considerable gamma of 0.072, suggesting significant leverage and responsiveness to the stock's price movements in the imminent term. This makes it highly attractive for traders expecting immediate price jumps. The other option, with a strike price of $32.5 and an even higher ROI of 71.46%, shows a higher potential return albeit for a slightly higher risk as indicated by a larger gamma of 0.227.
Looking at mid-term options expiring on June 21, 2024, the call options at strike prices of $12.5 and $15.0 are compelling. Notably, the option at a $15.0 strike price showcases a delta of 1.0 (indicating an almost one-to-one responsiveness with the stock price), an impressive ROI of 54.81%, and a solid profit of $6.9605. Its negligible values in gamma and vega indicate lower sensitivities to the stocks volatility, making it a secure pick amidst variable market conditions.
For a longer-term perspective, the call option expiring on September 20, 2024, with a strike price of $25.0 also stands out. It holds a notably high delta of 0.8596, reflecting considerable potential to profit from stock price increases. At the same time, its gamma of 0.021 and a high rho of 6.7479 show that its price is likely to be responsive to underlying stock price movements and interest rate changes, thus providing leverage and hedging against rate shifts over a longer period, despite its modest ROI of 2.77%.
In summary, for immediate short-term gains, the options with strike prices of $30 and $32.5 expiring on May 17, 2024, present high-profit opportunities due to their high ROI and responsive Greeks. For mid-term investments, particularly for less volatile and predictable returns, the options at $12.5 and $15.0 strike prices for June 21, 2024, offer substantial profits due to high deltas and positive ROIs. Lastly, for a longer-term strategic position, the September 20, 2024, $25.0 strike price option provides a balance between risk and return, ideal for hedging and capitalizing on long-term market trends.
Short Call Option Strategy
Analyzing the options chain for JFrog Ltd. (FROG), particularly focusing on short call options, we find several profitable choices across different expiration periods and strike prices. The target stock price is set at a 5% increase over the current stock price, which influences our selection criteria prioritizing those options with appealing Greek metrics.
-
Short-term option: For a near-term expiration, consider a short call with an expiration date of 2024-06-21 at a strike price of $32.5. This option exhibits significant benefits due to high gamma (0.066) and vega (4.16), providing sensitivity to the stock's volatility and movement. Coupled with a ROI of 100% and a total profit of $2.00, this option provides an attractive risk-reward ratio for short-duration exposure.
-
Mid-term option: Moving to a little further out, the option expiring on 2024-09-20 with a strike price of $35.0 is compelling. This call has a gamma of 0.0399531439 and a vega of 7.8285, showcasing substantial responsiveness to changes in the underlying volatility, and important for a mid-term horizon. The ROI remains at 100%, yielding a profit of $3.30.
-
Long-term option 1: For those looking toward a longer-term horizon, the expiring option on 2024-12-20 at a strike price of $40.0 shows promise, where the delta balance indicates a somewhat bullish stance, but still suitable for a short call. With a gamma of 0.0289689455 and a high vega of 10.0242, it adjusts well to volatility shifts. This option too has a ROI of 100%, generating profits of $2.98.
-
Long-term option 2: Additionally, an option expiring on the same date (2024-12-20) at a strike price of $50.0 holds appeal for a less aggressive stance in the long term, presenting a lower delta of 0.2197 yet maintaining significant influence by volatility, evidenced by a vega of 7.58. The ROI here also stands at 100%, with a return of $1.23.
-
Ultra-long-term option: The longest and perhaps most conservative in our selection is the option expiring on 2024-12-20 with a strike at $25.0, which remarkably heterogeneously captures the top ROI of 79.13% with a profit of $14.64. Although this delta nears 1.0 (0.8118), indicating almost one-to-one responsiveness with the stock, the high rho value (9.69) underscores its sensitivity to interest rate changes, critical for such a long-dated option.
In conclusion, these options reflect a strategic blend of high sensitivity to changes (high vega and gamma values) and profitable short call potentials across various time horizons. By leveraging the insights derived from the Greeks, traders can align their positions optimally with expected movements and volatilities in JFrog Ltd.'s stock over different periods, thereby enhancing the chances of maximizing returns on these positions.
Long Put Option Strategy
Analyzing the long put options for JFrog Ltd. (FROG) offers insights into the risk-reward profiles tailored to various investor timeframes and market expectations. The profitability of each option is primarily influenced by "the Greeks": delta, gamma, vega, theta, and rho. Here we focus on a selection of options characterized by varying expiration dates and strike prices, aiming to illustrate the most profitable opportunities under the assumption of a 5% target increase over the current stock price.
Starting with near-term options, the put option expiring on 2024-05-17 with a strike price of 50 demonstrates a delta of -1.0, indicating a high sensitivity to stock price movements, with a near-complete inverse correlation with the stock price. The theta of 0.0061 shows a very mild time decay, beneficial for the holder of this short-term option. With a premium of 7.98 and a high return on investment (ROI) of 0.9222, this option is highly attractive for those expecting a quick adjustment in the stock price.
Moving further out, the option expiring on 2024-06-21 with a strike price of 45 displays a robust gamma of 0.0273, suggesting that the option's delta is quite responsive to changes in the underlying stock's price. This option, with a premium of 10.23 and coupled with a moderately adverse theta of -0.0238, offers a balanced choice for traders looking for a little more time before expiry.
For options with an even longer timeframe, considering those expiring on 2024-09-20, the strike at 47.5 presents a favorable balance of sensitivity and premium cost. With a delta of -0.7299, it's moderately reactive to price changes. The gamma of 0.0237 enhances delta movements, and a substantial vega of 6.4889 indicates high sensitivity to implied volatility changes. With a moderate premium of 8.2 and an enticing ROI of 0.5658, this option is ideal for traders who forecast volatility rising ahead of September.
Looking towards year-end, the options expiring on 2024-12-20 offer a clear view of long-term strategies. Particularly, the strike at 47.5, showcasing a delta of -1.0, ensures nearly perfect inverse tracking with the stock. While gamma and vega sit at zero, indicating no sensitivity to volatility or rapid price movements, a theta of 0.0057 suggests minimal cost from the passage of time. Given its premium of 8.5 and high ROI of 0.5105, this represents a secure choice for those who prefer a longer duration to manage their bets against potential declines in FROG.
Finally, extending to the verge of the new year, the option with a strike price of 57.5 expiring on 2024-12-20 represents an intriguing case. It has a notable delta of -0.7773, gamma of 0.0175, and a very high vega of 7.6408, pointing to pronounced gains from increases in implied volatility, useful in turbulent market phases. The cost of holding the option, as indicated by theta (-0.0053), is outweighed by the benefits of its premium sensitivity to market shifts, priced at 18.2 with an ROI of 0.2549.
Through these selections, ranging from a near-term high-ROI option to a stable, long-term bet against the market, investors can tailor their exposure according to risk tolerance, expected volatility, and investment horizon.
Short Put Option Strategy
Analyzing the options chain for JFrog Ltd. (FROG) while specifically focusing on short put options reveals several profitable opportunities across different expiration dates and strike prices. Our target involves options where the stock price is anticipated to increase by 5% over the current level. Below are five notable short put options spanning from near-term to long-term expirations:
-
Short Put Option expiring on May 17, 2024, with a strike price of $30.00: This option has a low delta of -0.0316203661, indicating less sensitivity to stock price movement which is preferable for short put positions as it represents lower risk. The option carries a premium of $0.07, with a theta of -0.0203623324, meaning the option loses value slowly over time, which is beneficial from a seller's perspective. The gamma value of 0.0410775762 signifies a moderate rate of change of delta, offering manageable risks against rapid movements in the underlying stock price.
-
Short Put Option expiring on June 21, 2024, with a strike price of $20.00: With a delta of -0.0607916128 and a vega of 1.2818613001, this option shows moderate sensitivity to price and volatility changes. It has a favorable premium of $0.1 and a theta of -0.0191094538, which makes it attractive for earning through time decay, and its higher vega indicates potential profit enhancement should volatility increase.
-
Short Put Option expiring on September 20, 2024, with a strike price of $27.5: This option stands out with a delta of -0.1968319095 and a significant premium of $1.32. The theta here is -0.0089216337, indicating that its value erodes slowly over time, which is an ideal scenario for an option seller. Additionally, the rho of -2.7040256583 suggests the option price is less sensitive to changes in interest rates, making it more stable against such external factors.
-
Short Put Option expiring on December 20, 2024, with a strike price of $30.00: This option carries a delta of -0.301567121, which suggests reasonable sensitivity to the underlying stock's price movement. It comes with a premium of $3.2, providing immediate income which is relatively high. The slow theta decay (-0.007901992) paired with a high vega of 8.9315488656 indicates good profitability potential from volatility changes, should they occur.
-
Short Put Option expiring on December 20, 2024, with a strike price of $35.00: Featuring a delta of -0.4683915143 and a hefty premium of $5.52, this option suggests higher risk but offers potentially higher returns due to both price movements of the underlying stock and its sensitivity to volatility (vega of 10.1918845318). While the delta is higher, indicating a stronger reaction to price changes, the high premium collected upfront may justify the increased exposure, particularly if the trader's outlook on the stock is bullish over the medium term.
These options capture a range of strike prices and expiration dates that can meet various trading strategies, risk appetite, and market outlook assumptions. When choosing these options, traders should consider their views on the underlying stock's future movement, volatility expectations, and how these metrics align with the Greeks of the chosen options. This analysis assists in making informed decisions about which options might offer the best profitability potential given a trader's specific goals and market conditions.
Vertical Bear Put Spread Option Strategy
In analyzing a vertical bear put spread strategy for JFrog Ltd (FROG), its essential to look into a combination of short and long put options across various expiration dates and strike prices, focusing particularly on maximizing return on investment (ROI), favorable Greek values, and approaching the target stock price adjustment of approximately 2% over or under the current price.
Choice 1: Short Term (3 days to expiration)
- Short Put: Buy put with strike price of $22.5, expiring on 2024-05-17, which features low delta close to zero, indicating limited responsiveness to stock price changes, paired with a low theta, meaning minimal value loss per day (Delta: -0.00193, Vega: 0.018, Theta: -0.0046).
- Long Put: Buy put with strike price of $47.5, expiring on 2024-05-17 with a strong delta value of -0.9298, suggesting high sensitivity to price decrease, paired with high gamma and vega, increasing value as price moves favorably and volatility increases (Gamma: 0.0178, Vega: 0.4024).
Choice 2: Medium Term (38 days to expiration)
- Short Put: Buy put with strike price of $30.0, expiring on 2024-06-21, balancing risk with delta of -0.2040 and a high vega which could be lucrative if volatility spikes while theta remains manageable (Delta: -0.2040, Vega: 3.0175).
- Long Put: Buy put with strike price of $50.0, expiring on 2024-06-21, achieving a delta of -1.0, which provides high sensitivity to price decreases, and low theta, sustaining its value well over time (Theta: 0.0061).
Choice 3: Medium to Long Term (129 days to expiration)
- Short Put: Buy put with strike price of $25.0, expiring on 2024-09-20, showcasing an aggressive position with substantial vega and high delta, beneficial in a rapidly decreasing market (Delta: -0.1286, Vega: 4.1199).
- Long Put: Buy put with strike price of $52.5, expiring on 2024-09-20, with strong delta approaching -1, ensuring significant gains with stock price drop, and a balanced vega value for potential volatility advantage (Delta: -0.8690, Vega: 4.1721).
Choice 4: Long Term (220 days to expiration)
- Short Put: Buy put with strike price of $30.0, expiring on 2024-12-20, with a moderate delta and very high vega, theta is particularly low which helps sustain its value over the longer term (Delta: -0.3016, Vega: 8.9315).
- Long Put: Buy put with strike price of $57.5, expiring on 2024-12-20, with a delta nearing -1 thus capturing almost every point of downside movement, gamma and vega are balanced to gain from movement and volatility (Delta: -0.7773, Vega: 7.6407).
Choice 5: Very Long Term (220 days to expiration)
- Short Put: Buy put with strike price of $25.0, expiring on 2024-12-20, with an ideal combination of moderate delta and significant vega, suggesting that the option will increase in value if volatility goes up while being somewhat resistant to price changes (Delta: -0.1591, Vega: 6.2133).
- Long Put: Buy put with strike price of $57.5, also expiring on 2024-12-20, robust in capturing price decreases with high gamma and substantial vega, hintting resilience and advantage in volatile markets (Gamma: 0.0175, Vega: 7.6408).
Each choice optimizes for various critical factors: ROI, sensitivity to the underlying asset's price movements (delta), adjustment to its rate of change (gamma), vulnerability to volatility shifts (vega), and resistance to time decay (theta). These spread strategies are set up to exploit different market conditions across the spectrum of maturities, aiming to maximize profits while maintaining manageable risks.
Vertical Bull Put Spread Option Strategy
In assessing the most profitable vertical bull put spread options strategy for JFrog Ltd. (FROG), we look for combinations of short and long puts with carefully selected strike prices and expiration dates to maximize return on investment while keeping the risk within acceptable limits.
- Short-term Spread (3 Days to Expiry):
-
Consider selling the short put with a strike price of $17.5 and buying the long put with a strike price of $15.0, both expiring on 2024-05-17. The short put has a delta of -0.057, vega of 0.343, and theta of -0.298, while the long put has a delta of -0.038, vega of 0.886, and theta of -0.019. This spread benefits from the time decay (theta) and is ideal when expecting minor price movements.
-
Medium-short Term Spread (38 Days to Expiry):
-
Opt for selling a short put at a $20.0 strike and buying a long put at a $17.5 strike for the 2024-06-21 expiry. The short put displays a delta of -0.060, vega of 1.282, and theta of -0.019. The long put option holds a delta of -0.046, vega of 1.032, and theta of -0.018. This choice balances a reasonable premium inflow with manageable risk levels and a solid decay rate, allowing beneficial capitalization on minor upward stock movements.
-
Medium Term Spread (129 Days to Expiry):
-
Selling a short put with a strike of $25.0 and buying a long put with a $22.5 strike for the 2024-09-20 expiry can be effective. The short put has a delta of -0.129 and theta of -0.007, with a premium that offers a good balance between risk and potential return. It mitigates downside risk efficiently, especially with the gains in the vega of the long put (vega of 2.623) enhancing profitability if volatility increases.
-
Long Term Spread (220 Days to Expiry):
- For a longer-term horizon, consider selling a short put at $30.0 and buying a long put at $27.5, both expiring on 2024-12-20. Here, the shorts have a delta of -0.302 and a vega of 8.932, and buying options provide a lower delta (approx. -0.225), offering a good protection with enhanced sensitivity to volatility through their higher vega values. This spread takes advantage of longer-term bullish sentiment and a significant theta (time decay) aspect.
When employing the vertical bull put spread strategy, one generates income through the premiums collected on the short put while limiting potential downsides through the long put. Given FROGs target stock price and market expectations, adjustments to the strikes should remain sensitive to changes in stock volatility and price movements. Maintaining options that have favorable theta values ensures profitability primarily through time decay, especially crucial as options near expiry.
By carefully monitoring market conditions and adjusting the options' portfolio accordingly, these strategies should provide adequate profit opportunities while mitigating excessive risk exposure.
Vertical Bear Call Spread Option Strategy
Analyzing the options trading scenario for JFrog Ltd. (FROG), we concentrate on constructing a vertical bear call spread strategy, which involves writing calls at a lower strike price and purchasing calls at a higher strike price within the same expiration. This approach benefits from decreases in the underlying stock price or stalling markets up to the strike of the written call, which is ideally close to the current stock price. The goal is to maximize the profit from the premium difference while considering the vulnerabilities introduced by the Greeks Delta, Gamma, Theta, and Vega values.
- Short-term option choice (within 1-2 months):
-
Writing a call with expiration in June 2024 at a $30.0 strike may be beneficial given its higher premium and sizeable negative theta value, which indicates the value decreases quickly as time elapses, benefitting the seller. Accompanying that, buying a call option with a higher strike ($35) in the same month takes advantage of the large vega and negative theta.
-
Medium-term options (3-6 months):
-
Selecting to write a call option for September 2024 at a strike of $25 and buying a call for the same expiration at a strike of $30 shows a robust balance. The written calls relatively higher premium and negative theta promise good return decay over time, helped by a fading price. The purchased call ensures the spread remains controlled in risk.
-
Longer-term choice (6+ months):
- For the December 2024 expiry, initiate a bear spread by writing a call at a $27.5 strike, which has a very high ROI (Return on Investment) and robust rho, indicating a high sensitivity to interest rates; this could be advantageous in a varying economic environment. To manage risk, buy a call at a higher strike, such as $35. Both options show high sensitivity to volatility change (vega), which can be beneficial if timed around expected market turbulence.
In constructing these spreads, it is crucial to consider how sensitive the options are to changes in the underlying stock's price (Delta), volatility (Vega), and the degradation of an option's price over time (Theta). Ideally, the combined strategy will leverage high premiums and the fast theta decay from short positions while balancing out the long positions at higher strikes but with effective gamma and rho values to manage risks. By designing around carefully chosen strike prices primarily aligned withor slightly out ofthe current or expected stock price, we align with trading assumptions and manage risk effectively.
Finally, we derive the total strategys effectiveness by ensuring that combined premiums favor the initial premium of the sold calls over the bought calls and that decay and volatility adjustments (reflected in Greeks) support the overall profitability through the expiration timeline. It's also fundamental to handle risk by matching the deltas of the long and short legs closely, hence stabilizing the strategy against the price changes of JFrog Ltd.'s stock. By following these principles, we can structure a risk-averse yet potentially profitable vertical bear call spread.
Vertical Bull Call Spread Option Strategy
When devising a vertical bull call spread strategy for JFrog Ltd. (FROG), the objective is to look for options that involve buying one call option with a lower strike price and selling another call option with a higher strike price, both with the same expiration date. This strategy typically targets a moderate stock price increase. Here, the goal will be to target options with a +/-2% range of FROG's stock price.
Lets evaluate and highlight potential vertical bull call spread strategies across different expiration terms:
- Short Term Spread (Expiring in less than 40 days):
- Buying Call: Select the call option expiring on 2024-06-21 with the strike price of $22.5 (delta: 0.9415, premium: $10.90, theta: -0.0162, vega: 1.2443, gamma: 0.0131). This has a higher delta and close-to-target strike price that could increase in value in the short term.
-
Selling Call: Choose to sell the call option expiring on 2024-06-21 with a higher strike price of $30.0 (delta: 0.7608, premium: $3.80, theta: -0.0241, vega: 3.3053). The negative theta value means this option will lose less value over time, making it less costly to buy back if needed.
-
Medium Term Spread (Expiring in approximately 129 days):
- Buying Call: Buy the call option expiring on 2024-09-20 with a strike price of $30.0 (delta: 0.6947, premium: $5.60, theta: -0.0164, vega: 6.8767). This choice is justified by a reasonable strike price and a substantial vega value, indicating significant price movement sensitivity.
-
Selling Call: Sell the call with a strike price of $40.0 expiring on the same date (delta: 0.3319, premium: $1.70, theta: -0.0151, vega: 7.1233). A lower delta and similar vega ensure good hedging against the bought call.
-
Long Term Spread (Expiring in approximately 220 days):
- Buying Call: For a longer term, purchase the call option expiring on 2024-12-20 with a strike price of $37.5 (delta: 0.4865, premium: $3.8, theta: -0.0139, vega: 10.2181). This option offers a good balance of sensitivity to price changes (vega) and time decay (theta).
-
Selling Call: Pair it by selling the call option expiring on the same date but with a strike price of $50.0 (delta: 0.2197, premium: $1.23, theta: -0.0096, vega: 7.5827). The lower delta suggests its less likely to end in-the-money, providing profits from premium decay.
-
Very Long Term Spread (Also expiring around 220 days):
- Buying Call: For a further outlook, consider buying the call expiring on 2024-12-20 at a strike price of $32.5 (delta: 0.6233, premium: $5.9, theta: -0.0140, vega: 9.7319), This strike affords a larger delta and good vega, suggesting strong price change responsiveness.
- Selling Call: Sell the call at strike $45.0 expiring on the same date (delta: 0.3141, premium: $1.90, theta: -0.0119, vega: 9.0933). The choice here provides a safe spread, hedging the more expensive long call.
In conclusion, these suggested options for vertical bull call spreads provide various degrees of investment terms and risk exposures while aiming to capitalize on expected price increases of JFrog Ltd. stock. Adjusting the distance between strike prices allows for flexibility in potential profit and risk management, ensuring the strategy is aligned with specific market outlooks and trader's appetite for risk.
Similar Companies in Software - Application:
Fastly, Inc. (FSLY), Bill.com Holdings, Inc. (BILL), Alteryx, Inc. (AYX), Asana, Inc. (ASAN), Jamf Holding Corp. (JAMF), Pegasystems Inc. (PEGA), Procore Technologies, Inc. (PCOR), PowerSchool Holdings, Inc. (PWSC), Report: GitLab Inc. (GTLB), GitLab Inc. (GTLB), monday.com Ltd. (MNDY), Datadog, Inc. (DDOG), Atlassian Corporation (TEAM), GitHub Inc. (MSFT), Cloudflare, Inc. (NET)
https://seekingalpha.com/article/4691635-jfrog-ltd-frog-q1-2024-earnings-call-transcript
https://www.fool.com/investing/2024/05/10/why-is-jfrog-stock-having-a-bad-day-today/
https://finance.yahoo.com/news/jfrog-shares-decline-morgan-stanley-155137178.html
https://finance.yahoo.com/news/why-jfrog-frog-stock-nosediving-163125096.html
https://finance.yahoo.com/news/jfrog-ltd-frog-q1-2024-164853134.html
https://finance.yahoo.com/m/13bbb23a-e9bb-37fb-b3f5-ea817ef55649/why-is-jfrog-stock-having-a.html
https://finance.yahoo.com/m/e6ae2df4-0ecc-328f-84b8-9ef34678ae21/jfrog-stock-is-slumping..html
https://finance.yahoo.com/news/jfrog-ltd-nasdaq-frog-q1-190957688.html
https://finance.yahoo.com/m/1f346274-3863-30c0-b1cb-8893ade21d5b/these-stocks-moved-the-most.html
https://finance.yahoo.com/news/jfrog-first-quarter-2024-earnings-143033613.html
https://www.sec.gov/Archives/edgar/data/1800667/000095017024057817/frog-20240331.htm
Copyright © 2024 Tiny Computers (email@tinycomputers.io)
Report ID: TI1mnc
Cost: $0.85395
https://reports.tinycomputers.io/FROG/FROG-2024-05-13.html Home