SPDR Gold Shares (ticker: GLD)
2024-02-19
 SPDR Gold Shares (GLD) represent one of the largest and most popular exchange-traded funds (ETFs) that offer investors an efficient and secure way to access the gold market. Launched in November 2004, GLD aims to reflect the performance of the price of gold bullion, minus the Trust's expenses. The fund is backed by physical gold held in vaults, and its value is denoted in U.S. dollars. SPDR Gold Shares has become a favored option for investors looking to hedge against inflation, diversify their portfolios, or speculate on the price movements of gold without the logistical complexities of handling physical gold. The fund's accessibility on major stock exchanges, transparent structure, and the liquidity it offers make it a vital instrument for both individual and institutional investors seeking exposure to gold.

| Previous Close | 185.66 | Opening Price | 185.076 | Day Low | 184.835 |
| Day High | 186.67 | Regular Market Day Low | 184.835 | Regular Market Day High | 186.67 |
| Volume | 6,518,526 | Average Volume | 6,680,324 | Average Volume 10 Days | 5,887,440 |
| Bid | 186.2 | Ask | 186.6 | Bid Size | 1,800 |
| Ask Size | 1,000 | Total Assets | 56,168,570,880 | Fifty Two Week Low | 168.19 |
| Fifty Two Week High | 193.18 | Fifty Day Average | 188.0194 | Two Hundred Day Average | 182.474 |
| NAV Price | 185.04733 | YTD Return | -0.025 | Three Year Average Return | 0.0346 |
| Five Year Average Return | 0.0835 | Exchange | PCX | Currency | USD |

| Sharpe Ratio | 0.4206475785314127 | Sortino Ratio | 7.360608247720894 |
| Treynor Ratio | -4.070502319056219 | Calmar Ratio | 0.8243222060900894 |
Analyzing the SPDR Gold Trust (GLD), a thorough review of its technical indicators, fundamentals, and various financial ratios has been conducted to forecast its future stock price movement. GLD, being a gold-backed exchange-traded fund (ETF), offers insights into broader market sentiment, with its dynamics often influenced by global economic indicators, inflation rates, and currency valuation shifts.
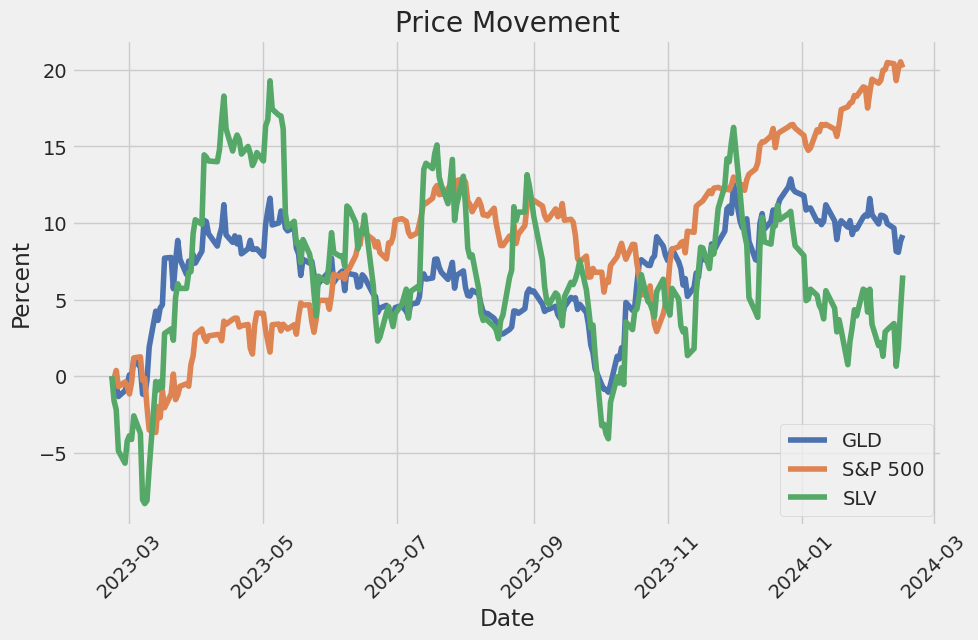
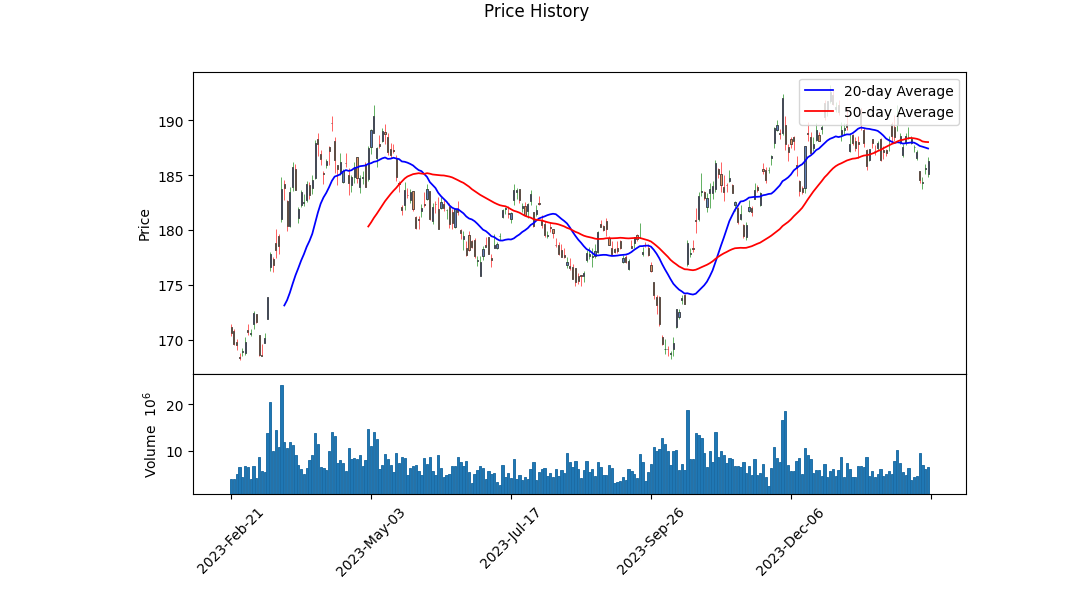
Technical indicators over the last few months reveal a slight uptrend with some volatility. Notably, the On-Balance Volume (OBV) has shown fluctuations but remains on an upward trajectory, indicating sustained buying interest. However, the MACD histogram values toward the end of the observed period point toward a potential weakening of this uptrend, signifying that caution is warranted.
The fundamental overview of GLD emphasizes its role as a safe-haven asset, with its total assets amounting to over $56 billion. The market capitalization stands robust at approximately $48.93 billion. These figures underscore the ETF's substantial presence and the trust investors place in gold amidst market uncertainties. The fundamental data also indicate a minimal YTD Daily Total Return of -2.53%, reflecting the ETF's subtle negative performance in the short term within the context of a larger resilient structure. Furthermore, the ETF holds a remarkably low Beta (5Y Monthly) of 0.09, highlighting its minimal correlation with broader market movements and underlining its status as a diversification instrument in investors' portfolios.
The financial ratios present a mixed yet insightful picture. The Sharpe Ratio at 0.4206 suggests a moderate excess return over the risk-free rate, adjusting for its riskindicating efficiency in investment returns when compared to its volatility. The exceedingly high Sortino Ratio of 7.3606 accentuates this view under scenarios of downside risk, emphasizing the ETF's capability to manage bearish trends effectively. Conversely, the negative Treynor Ratio of -4.0705 might raise concerns; however, it primarily reflects the peculiarities of GLD's risk-return profile against the market index. Lastly, the Calmar Ratio of 0.8243 further substantiates GLD's proficiency in navigating through periods of market stress, offering a steadfast return relating to maximum drawdown risks.
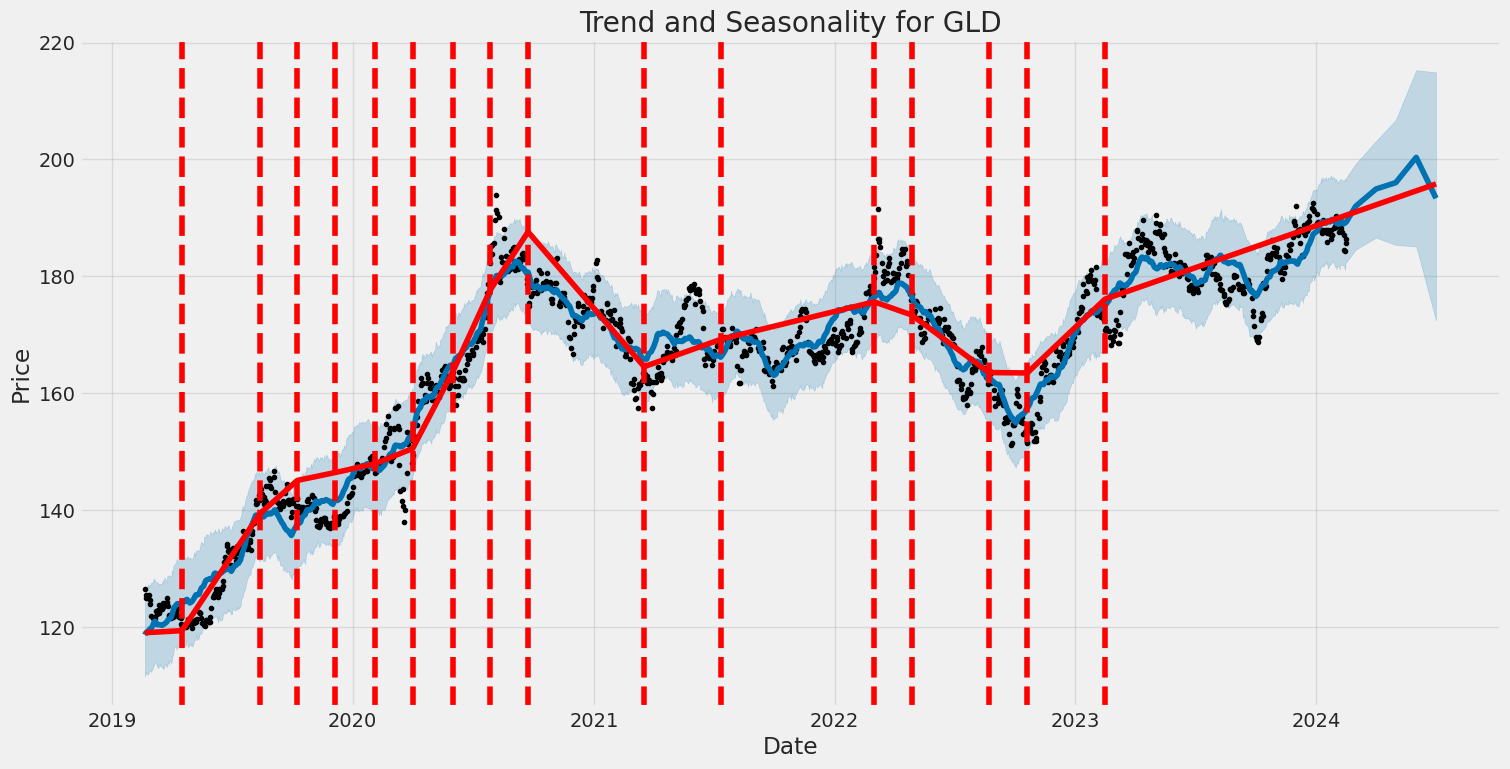
Projecting future stock price movements requires balancing these interrelated factors. Considering the solid fundamentals, coupled with the technical indicators insights, and the noted volatility and recent performance dynamics, it's reasonable to anticipate a period of consolidation in the near term, followed by potential gradual uptrends over the ensuing months. This forecast hinges on preserving investor interest amidst broader macroeconomic narratives and currency valuation trends. It's crucial for investors to monitor forthcoming economic indicators and global events that could influence gold prices, including inflation rates, geopolitical developments, and shifts in the currency markets.
In conclusion, while the short-term horizon might exhibit modest volatility, the fundamentals, coupled with the technical and financial ratio analyses, support a cautiously optimistic outlook for GLD over the medium to long term. The ETF's role as a diversification tool and a hedge against inflation provides a foundational strength that, balanced against operative risks, suggests a favorable trend in its stock price trajectory going forward.
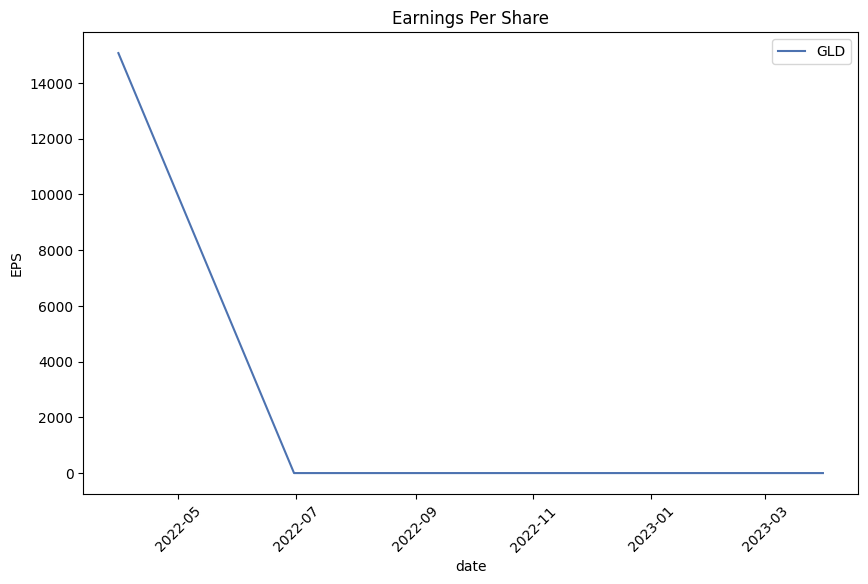
In examining the investment characteristics of SPDR Gold Shares (GLD) through the lens of Joel Greenblatt's principles outlined in "The Little Book That Still Beats the Market," we find ourselves at an interesting juncture when applying traditional metrics such as return on capital (ROC) and earnings yield. Specifically, both ROC and earnings yield for GLD are marked as 'None.' This observation isnt due to oversight but underscores a fundamental aspect of GLD as an investment instrument. SPDR Gold Shares (GLD) is designed to track the price of gold bullion and, therefore, does not generate earnings or employ capital in the way a traditional business does. It is a commodity ETF, essentially holding gold as its primary asset, which doesnt yield earnings or utilize capital to generate profit in the conventional sense. Hence, evaluating GLD using ROC and earnings yield doesn't align with its nature and mechanism. For investors considering GLD, the focus should rather be on the dynamics of gold prices, inflation rates, currency values, and overall economic conditions, as these factors influence golds performance and, by extension, GLD's price movements.
| Statistic Name | Statistic Value |
| R-squared | 0.013 |
| Adj. R-squared | 0.012 |
| F-statistic | 16.68 |
| Prob (F-statistic) | 4.70e-05 |
| Log-Likelihood | -1699.3 |
| AIC | 3403 |
| BIC | 3413 |
| coef (const) | 0.0273 |
| coef (SPY) | 0.0818 |
| Std err (const) | 0.026 |
| Std err (SPY) | 0.020 |
| t (const) | 1.035 |
| t (SPY) | 4.085 |
| P>|t| (const) | 0.301 |
| P>|t| (SPY) | 0.000 |
| [0.025 0.975] (const) | -0.025 0.079 |
| [0.025 0.975] (SPY) | 0.043 0.121 |
| Omnibus | 101.208 |
| Prob(Omnibus) | 0.000 |
| Jarque-Bera (JB) | 432.098 |
| Prob(JB) | 1.48e-94 |
| Skew | -0.248 |
| Kurtosis | 5.829 |
| Cond. No. | 1.32 |
The linear regression model illustrates a modest relationship between GLD (Gold ETF) and SPY (S&P 500 ETF) over the specified period, signaling a slight positive effect of the SPY market movement on GLD prices. The model's alpha value, also known as the intercept, is calculated to be approximately 0.027335348554377154. This alpha suggests that if SPY returns were zero, GLD is expected to have a return close to 2.7% over the period analyzed. Although alpha provides an essential insight into the model's intercept, it should not be construed independently without considering the context of the model's beta and other statistical metrics.
The regression's beta coefficient, estimating the change in GLD's returns for a one percent change in SPY returns, is around 0.08184702663530022. This indicates a low but positive correlation between SPY returns and GLD returns, implying that GLD tends to move in the same direction as SPY but at a much lower magnitude. Despite the presence of a statistical relationship, the R-squared value of the model is very low (0.013), signifying that the variability of SPY returns explains only a small fraction of the variations in GLD returns. This underlines the importance of considering other factors beyond market movements when analyzing GLD's price behavior and suggests that GLD may be affected by other elements not captured in this simple linear model.

The SEC 10-Q filing for SPDR Gold Trust (GLD) for the quarter ending December 31, 2023, provides a detailed overview of the trust's financial condition, including its investment in gold and the performance of its shares. As outlined in the financial statements, the total assets of the trust as of December 31, 2023, were valued at approximately $58.46 billion, with investments in gold at fair value accounting for nearly all the assets. This represented a notable increase from the September 30, 2023, total assets value of approximately $52.54 billion. The rise in assets corresponds with an increase in net assets, which amounted to around $58.27 billion at the end of the period, up from about $52.52 billion at the end of the previous quarter. This growth highlights the trust's positive performance and the rising value of its gold holdings.
During the quarter, the trust saw a net change in the number of shares created and redeemed, indicative of investor activity and interest in gold as an investment. The financial results also detail the trust's operational aspects, including the expenses related to managing the gold investments and the resulting net income. Specifically, the trust experienced a net investment loss but offset this with significant net realized and change in unrealized gains on its investment in gold, leading to a net income of approximately $5.27 billion for the three months ended December 31, 2023.
The filing also discusses the trust's approach to valuing its gold investments, which is based on the London Bullion Market Association (LBMA) Gold Price PM. This approach underpins the trust's financial reporting and operational strategies, ensuring transparency and accuracy in the valuation of its primary asset. Additionally, the document provides insights into the market risks associated with gold investment, highlighting fluctuations in the price of gold bullion as a key factor that could impact the trust's financial position and the value of its shares.
Overall, the SEC 10-Q filing for SPDR Gold Trust for the quarter ended December 31, 2023, offers a comprehensive snapshot of the trust's financial health, strategies, and market position. The trust's significant assets in gold, positive net income, and detailed operational reporting reflect its status as a major vehicle for investors seeking exposure to gold bullion.
| company | symbol | percent |
|---|---|---|
| SPDR Gold Shares | GLD | 100 |
SPDR Gold Shares (GLD) have been a focal point for investors seeking exposure to gold without the need to directly purchase, store, and insure the physical commodity. This exchange-traded fund (ETF) mirrors the price of gold bullion, offering an efficient and liquid means to invest in gold. Over the years, GLD has become an essential instrument for both institutional and individual investors, providing a hedge against inflation and economic uncertainties. The appeal of GLD lies in its liquidity, cost efficiency, and the simplicity of integrating it into a diversified investment portfolio.
Gold's stature as a safe-haven asset was underscored in 2023, with its price reaching all-time highs of $2,135 in early December. Despite this increase in the bullion's price, gold ETFs, including GLD, faced significant outflows, totaling $14.7 billion across the sector. These outflows occurred even as the asset under management (AUM) for these funds decreased to $214.4 billion, suggesting a paradox where golds value increased, but investor appetite within ETFs waned, particularly within European funds.
The total holdings of gold within these ETFs dropped by over 244 tonnes, with the most substantial outflows registered in Europe, losing $11.5 billion, reflecting the most significant loss since 2013. This shift could be attributed to a concoction of surging interest rates, stronger currencies, and rising living costs, prompting investors to liquidate their holdings for profits. Similarly, in North America, gold ETFs faced $4.5 billion in outflows, leading to a decrease in total gold holdings to 1,643 tonnes.
Contrastingly, in Asia, gold ETFs, including GLD, observed an uptick in investor interest, with total holdings increasing by 19 tonnes to 138 tonnes. The AUM in this region increased to $9.6 billion, buoyed by inflows totaling $1.3 billion. This divergence highlights the regional differences in investment strategies and preferences concerning gold and related investment vehicles.
Despite the challenges, the fundamentals underpinning gold's value, such as its role as a hedge against inflation and currency devaluation, remain strong. The anticipated shifts in U.S. monetary policy, with expectations of potential rate cuts, could situate gold for a renewed period of investor interest. Analysis suggests that conditions including ongoing geopolitical tensions and monetary policy anticipations present a fertile ground for gold's prominence within investment portfolios to resurge, making instruments like GLD increasingly attractive.
As 2024 progresses, the dynamics within the gold market and, by extension, gold ETFs like GLD, continue to evolve. With UBS strategists predicting a potential 10% spike in gold prices within the year, driven by speculation around interest rate cuts, the outlook for GLD appears cautiously optimistic. This projection, alongside other macroeconomic and geopolitical developments, will undoubtedly influence GLD's trajectory and its role in portfolio diversification strategies.
Furthermore, with the advent of digital currencies and the approval of Bitcoin ETFs by the SEC, the investment landscape is undergoing transformative changes. These developments offer new avenues for portfolio diversification but also introduce complexities in decision-making processes. Investors are increasingly weighing their options between traditional safe-haven assets like gold and emerging alternatives like Bitcoin ETFs.
Despite these complexities, SPDR Gold Shares remains a critical tool for investors looking to leverage gold's historical resilience and potential for future growth. The fund's ability to offer direct exposure to the price movements of goldwithin the framework of a regulated, transparent, and liquid marketpositions it as a viable option for investors aiming to mitigate risk or capitalize on the metal's safe-haven appeal.
As the financial markets continue to navigate through periods of uncertainty and volatility, the importance of assets like GLD becomes increasingly apparent. Whether as a hedge against inflation, a diversification tool, or a safe-haven investment, GLD offers a compelling case for inclusion in investment strategies aimed at preserving and growing wealth in the face of changing market dynamics.
The SPDR Gold Shares (GLD) exhibited noticeable volatility within the specified date range, highlighted by its fluctuating returns, as derived from the ARCH model analysis. The model's omega coefficient, standing at 0.8175, suggests a significant baseline volatility, indicating that GLDs price movements can be quite unpredictable. The alpha coefficient of 0.0738, although on the lower end, further underscores that past returns do have a modest effect on the future volatility of GLD, pointing towards a level of predictability amidst the financial instrument's inherent unpredictability.
| Statistic Name | Statistic Value |
|---|---|
| Mean Model | Zero Mean |
| Vol Model | ARCH |
| Log-Likelihood | -1699.88 |
| AIC | 3403.76 |
| BIC | 3414.03 |
| No. Observations | 1,257 |
| omega | 0.8175 |
| alpha[1] | 0.0738 |
To understand the financial risk of a $10,000 investment in SPDR Gold Shares (GLD) over a one-year period, a sophisticated approach integrating volatility modeling and machine learning predictions has been employed. This multi-faceted analysis hinges on two pivotal components: the utilization of volatility modeling for grasping the fluctuation characteristics of SPDR Gold Shares' stock and the application of machine learning algorithms to forecast future returns.
Volatility modeling serves as a cornerstone in assessing the dynamic and uncertain nature of financial markets. By applying this model, we can dissect and quantify the inherent volatility of SPDR Gold Shares. This model captures the time-varying variance and allows us to understand the patterns of fluctuation that GLD experiences. It's particularly useful for identifying periods of high volatility which, in the context of financial investments, translates to higher risk. Through this approach, the volatility model identifies the conditional volatility or the expected level of fluctuation around the stock price over time, based on historical price movements. This is paramount for investors looking to gauge the risk associated with their investments in a forward-looking manner.
On the other hand, machine learning predictions supplement the volatility analysis by leveraging historical data to forecast future returns of SPDR Gold Shares. The use of a specific machine learning algorithm focuses on incorporating various features like historical prices, volume, and even external economic indicators to predict future stock performance. This predictive model learns from the data's inherent patterns and anomalies to make informed predictions about future returns. Combining the predictive power of machine learning with the detailed volatility insights provides a more nuanced risk profile of the investment.
The analysis particularly highlights the Value at Risk (VaR) at a 95% confidence interval, calculated to be $130.27 for a $10,000 investment. VaR is a statistical measure that estimates the maximum expected loss over a specified time frame, under normal market conditions, with a certain level of confidence. In this case, the VaR indicates that there is a 95% chance that the investment will not lose more than $130.27 over the one-year period, providing a clear, quantifiable measure of the maximum potential loss faced by the investor. This figure is pivotal for investors as it encapsulates the risk in a single metric, offering a straightforward way to understand the potential downside.
Integrating volatility modeling with machine learning predictions to analyze financial risk presents a comprehensive view of the anticipated market behavior and investment outcomes. By doing so, investors gain a well-rounded understanding of the potential risks involved in equity investment, showcasing the unison of historical volatility analysis and future return predictions. This dual approach not only enhances the accuracy of the risk assessment but also equips investors with the knowledge to make informed decisions based on both historical patterns and predictive forecasts.
Analyzing a comprehensive options chain for SPDR Gold Shares (GLD) over various strike prices and expiration dates, focusing on call options and evaluating the profitability potential based on various "Greeks" (Delta, Gamma, Vega, Theta, and Rho), premium, and Return on Investment (ROI), we derive insightful conclusions to help guide trading decisions.
For the intermediate term, a standout option is the call with a strike price of $100 and an expiration date in January 2026. This option has a delta of 0.9123, indicating a high sensitivity to the underlying asset's price movement, a relatively favorable theta, ensuring a lower rate of time decay, and a vega of 40.974, suggesting a significant responsiveness to implied volatility changes. Its premium is set at $92.00, and its ROI potential stands out impressively, making it a compelling choice for investors bullish on gold over the longer term.
Shorter-term options presenting interesting scenarios include those expiring in January 2025. An option with a strike price of $145 and significant Vega, suggesting a keen sensitivity to implied volatility, could be an attractive pick for traders speculating on gold price volatility. However, it's crucial to note the premium of $49.9 and assess the ROI and Theta to understand the time decay impact.
For those looking at options with sooner expirations, a call with a strike price of $125 expiring in June 2025, exhibits a balanced blend of sensitivity to the underlying asset's price movements (Delta), Vega, and an acceptable level of time decay (Theta). With a premium of $72.25, this option might offer a favorable risk-reward ratio for traders considering medium-term positions.
In reviewing options with a further out expiration in 2025, notable is the call option with a strike price of $150, showcasing a Vega of 46.4021, indicating high sensitivity to volatilitya critical factor given the often-volatile nature of gold prices. While the Delta suggests decent movement with the underlying asset, assessing the premium at $43.93 and the specific Theta and ROI figures will provide a clearer profitability picture.
As you contemplate these options, its crucial to integrate these insights with broader market analysis and individual risk tolerance. The inherent risk of options trading necessitates a thorough evaluation of potential market movements, implied volatility, and time decay impact on the premiums of these call options. Furthermore, keeping abreast of geopolitical factors, economic indicators, and central bank policies that significantly influence gold prices will bolster the decision-making process.
Each mentioned option presents unique opportunities and risks, tailored to different trading strategies and outlooks on the gold market. Whether seeking short-term gains based on volatility or longer-term investments hinged on gold's value appreciation, these insights can guide traders toward informed decisions in their options trading endeavors.
Similar Companies in Investment Trusts/Mutual Funds:
iShares Silver Trust (SLV), VanEck Gold Miners ETF (GDX), SPDR S&P 500 ETF Trust (SPY), United States Oil Fund, LP (USO), Report: Energy Select Sector SPDR Fund (XLE), Energy Select Sector SPDR Fund (XLE), iShares Gold Trust (IAU), Aberdeen Standard Physical Gold Shares ETF (SGOL), VanEck Vectors Junior Gold Miners ETF (GDXJ), Invesco Physical Gold ETC (PHYS)
https://www.etftrends.com/tactical-allocation-channel/new-highs-propel-gold-2024/
https://finance.yahoo.com/news/gold-prices-cross-2-050-004733573.html
https://finance.yahoo.com/news/gold-prices-edge-lower-dollar-003436568.html
https://finance.yahoo.com/news/gold-prices-fall-rate-cut-003548294.html
https://finance.yahoo.com/news/gold-prices-see-support-2-002221542.html
https://finance.yahoo.com/news/gold-prices-set-steep-weekly-005613248.html
https://seekingalpha.com/article/4663690-the-more-it-drops-the-more-i-buy
https://www.etftrends.com/whats-hot-not-besides-bitcoin-etfs/
https://finance.yahoo.com/news/gold-prices-rise-more-economic-005408460.html
https://finance.yahoo.com/m/bf8907ad-d5f5-327b-8e8d-1de5f849e76f/gbtc%3A-the-biggest-spot.html
https://seekingalpha.com/article/4664867-buy-the-dip-2-high-yields-getting-way-too-cheap
https://www.sec.gov/Archives/edgar/data/1222333/000143774924003442/gld20231231_10q.htm
Copyright © 2024 Tiny Computers (email@tinycomputers.io)
Report ID: CpSgprX
Cost: $0.65848
https://reports.tinycomputers.io/GLD/GLD-2024-02-19.html Home