The Home Depot, Inc. (ticker: HD)
2024-05-13
 The Home Depot, Inc. (ticker: HD) is the largest home improvement retailer in the United States, offering a wide range of products, including building materials, home improvement supplies, lawn and garden products, and decor items. The company's extensive footprint includes over 2,300 stores across North America, catering to both do-it-yourself (DIY) customers and professional contractors. Founded in 1978, The Home Depot has consistently expanded its market presence through strategic store openings and acquisitions. In recent years, the company has also significantly enhanced its digital commerce capabilities to better serve a growing segment of customers who prefer shopping online. Financially, The Home Depot boasts robust revenue growth and strong profitability, supported by its efficient supply chain, strategic cost management, and customer service excellence. Its stocks are frequently noted for their robust dividends and reliable return on investment, making The Home Depot a staple in many investment portfolios.
| Full-Time Employees | 463,100 | Previous Close | 346.43 | Open | 348.06 |
| Day Low | 340.4 | Day High | 348.79 | Market Cap | 337,901,912,064 |
| Volume | 4,043,965 | Average Volume | 3,509,162 | Shares Outstanding | 991,030,976 |
| Net Income | 15,143,000,064 | Dividend Rate | 9.0 | Dividend Yield | 2.6% |
| Trailing P/E Ratio | 22.58 | Forward P/E Ratio | 20.83 | Beta | 1.011 |
| Total Revenue | 152,668,995,584 | EBITDA | 24,935,999,488 | Total Debt | 53,100,998,656 |
| Operating Cashflow | 21,172,000,768 | Free Cashflow | 15,104,249,856 | Quick Ratio | 0.322 |
| Current Ratio | 1.352 | Gross Margins | 33.379% | EBITDA Margins | 16.333% |
| Operating Margins | 11.91% | Return on Assets | 17.723% | Return on Equity | 1162.1639% |
| Sharpe Ratio | 0.862416801966822 | Sortino Ratio | 14.543432453440806 |
| Treynor Ratio | 0.1678640915242976 | Calmar Ratio | 1.257962896820778 |
The Home Depot, Inc. (HD) has demonstrated a performance that reflects both robustness and potential caution for the following months. The technical indicators show some crucial patterns and the fundamental metrics provide insight into its current valuation and operational health.
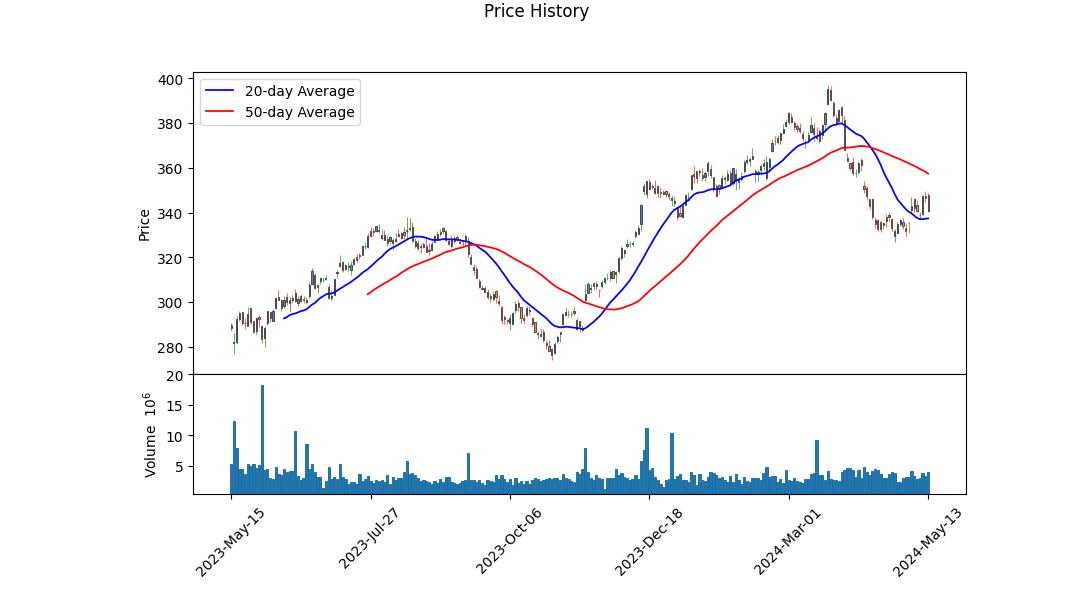
Technical Analysis
Recent technical indicators reveal key momentum and volume irregularities over the last few days: - OBV (On-Balance Volume): Over the last few days, there has been significant OBV fluctuation, suggesting possible institutional buying and selling activities. - MACD (Moving Average Convergence Divergence): The histogram values suggest increasing bullish momentum, a positive sign for the near-term price movement.
Fundamentals and Financial Health
Home Depot's financial strength is backed by impressive margins: - Gross Margin: 33.38%, indicating high efficiency in its core business. - EBITDA Margin: 16.33%, reflecting solid profitability. - Operating Margin: 11.91%, showcasing effective cost management.
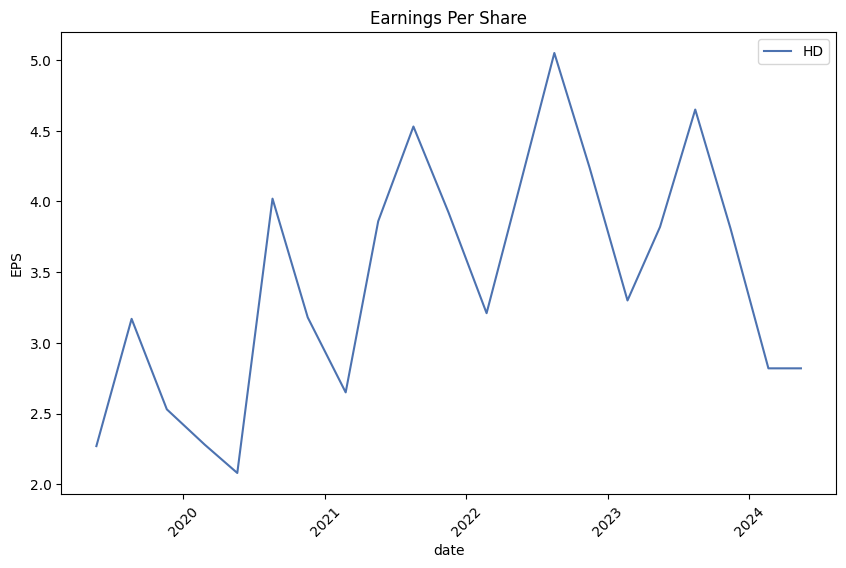
Other Highlights: - Revenue: $152.669 billion, signaling robust sales figures. - Net Income: $15.143 billion with a diluted EPS of $15.11, which is a significant improvement from previous fiscal years, suggesting growth potential. - Free Cash Flow: $17.946 billion, indicating a strong ability to generate cash after capital expenditures. - Total Debt: $52.243 billion and an increase in net debt to $40.351 billion, which warrants careful monitoring despite the companys capability to manage its debt effectively.
Risk-Adjusted Return Metrics
- Sharpe Ratio: At 0.8624, HD offers a satisfactory risk-adjusted return, albeit with room for improvement.
- Sortino Ratio: A very high value of 14.5434, indicating that the returns are favorable considering downside volatility.
- Treynor Ratio: At 0.1679, suggesting a good risk-adjusted return relative to market risk.
- Calmar Ratio: At 1.258, representing a strong risk-adjusted performance, especially in turbulent times.
Additional Insights
Home Depots Altman Z-Score of 7.276 and a Piotroski Score of 6 indicate a low risk of bankruptcy and sound financial health. With retained earnings of $83.656 billion and total assets worth $76.530 billion, HD is in a solid position to leverage future growth opportunities.
Given these comprehensive insights, Home Depot is positioned for moderate growth over the next few months. The bullish technical signals, combined with strong fundamental health, suggest potential price appreciation. However, investors should remain watchful of its debt position and the broader market dynamics that could influence its stock price.
In conclusion, Home Depots current state seems promising with indications of continued growth, provided external economic factors remain stable. Prudent monitoring of technical indicators and financial health will be imperative for making informed decisions.
In our analysis of The Home Depot, Inc. (HD) using the framework from "The Little Book That Still Beats the Market," we find that the company demonstrates a robust Return on Capital (ROC) of 39.79%. This suggests that Home Depot is highly efficient at converting its capital into profits, indicating strong operational performance and effective management practices. Additionally, the company's Earnings Yield stands at 4.45%, which provides insight into the earnings generated relative to the stock price. While the earnings yield may seem modest, it remains competitive, particularly when considered alongside the high ROC. This combination suggests that Home Depot is not only generating significant returns on its investments but also offers a respectable yield on its market valuation, making it an attractive candidate for value-focused investors.
Research Report: The Home Depot, Inc. (HD) Evaluation Based on Benjamin Graham's Criteria
As we evaluate The Home Depot, Inc. (HD) using the principles outlined by Benjamin Graham in "The Intelligent Investor," we will focus on several key financial metrics to determine how they align with Graham's value investing philosophy. Below are the metrics for HD and a comparison to Graham's criteria.
1. Margin of Safety
Graham's core principle of investing is the "Margin of Safety," which advocates for purchasing stocks at prices significantly below their intrinsic value to mitigate risk. While this report does not calculate the intrinsic value of HD directly, it uses relevant metrics to understand its valuation.
2. Price-to-Earnings (P/E) Ratio
- HD P/E Ratio: 21.54
- Industry P/E Ratio: 22.19
Graham favored stocks with low P/E ratios relative to their industry peers. The P/E ratio for HD is 21.54, slightly below the industry average of 22.19. This shows that HD is priced reasonably compared to its peers but does not represent a deeply discounted P/E ratio, which Graham might have preferred.
3. Price-to-Book (P/B) Ratio
- HD P/B Ratio: 4.42
Graham typically looked for stocks trading below their book value, and a lower P/B ratio is generally more attractive to value investors. HD's P/B ratio of 4.42 suggests that the stock is trading at a substantial premium to its book value. This high P/B ratio indicates that investors expect significant future growth, but from a value investing perspective, it might be considered overvalued.
4. Debt-to-Equity Ratio
- HD Debt-to-Equity Ratio: 50.04%
Graham preferred companies with a low debt-to-equity ratio, as high debt levels increase financial risk. HD's debt-to-equity ratio of 50.04% falls within a moderate range. While it is not excessively high, it is significantly higher than the very conservative levels Graham might have favored, thus introducing some financial risk.
5. Current Ratio
- HD Current Ratio: 1.35
The current ratio measures a company's ability to cover its short-term liabilities with its short-term assets. Graham favored companies with a current ratio of at least 2.0. HD's current ratio of 1.35 indicates that it can cover its short-term obligations but does not meet Graham's more stringent standard, suggesting potential liquidity concerns.
6. Quick Ratio
- HD Quick Ratio: 1.35
Similar to the current ratio, the quick ratio (also known as the acid-test ratio) measures a company's ability to pay off its short-term liabilities without relying on inventory. Graham preferred a quick ratio of at least 1.0. HD's quick ratio of 1.35 is slightly above this benchmark, indicating that HD can meet its short-term liabilities without depending on its inventory.
Conclusion
Based on these metrics, The Home Depot, Inc. presents a mixed picture when evaluated against Benjamin Graham's criteria:
- The P/E ratio is slightly below the industry average, which aligns moderately well with Graham's preference for undervalued stocks.
- The P/B ratio is significantly above 1, indicating that HD trades at a high multiple of its book value.
- The debt-to-equity ratio is moderate but higher than what Graham might prefer for minimal financial risk.
- The current and quick ratios suggest some level of liquidity but do not fully meet Graham's stringent criteria for a strong safety margin.
In summary, while HD does show some qualities that align with value investing principles, especially in comparison to its industry P/E ratio, it also exhibits characteristics that might make traditional value investors cautious. High valuations and moderate debt levels imply that any purchase of HD would have to be carefully considered in the context of Graham's emphasis on a margin of safety and low financial risk.### Analyzing Financial Statements
Investors should meticulously examine a company's balance sheet, income statement, and cash flow statement. Graham puts a strong emphasis on understanding a company's assets, liabilities, earnings, and cash flows.
Key Components of Financial Statements
1. Balance Sheet: The balance sheet offers a snapshot of a company's financial position at a specific point in time. It includes: - Assets: What the company owns. - Current Assets: Cash and equivalents, accounts receivable, inventory, and other current assets. - Non-current Assets: Property, plant, equipment, goodwill, and other non-current assets. - Liabilities: What the company owes. - Current Liabilities: Accounts payable, short-term debt, and other current liabilities. - Non-current Liabilities: Long-term debt and non-current obligations. - Stockholders' Equity: The residual interest in the assets of the enterprise after deducting liabilities, which includes common stock, retained earnings, and additional paid-in capital.
2. Income Statement: The income statement details the companys financial performance over a period. It includes: - Revenue: Total income earned from operations. - Cost of Revenue: The direct costs attributable to the goods produced. - Gross Profit: Revenue minus the cost of revenue. - Operating Expenses: Includes selling, general and administrative (SG&A) expenses, and depreciation and amortization. - Operating Income: Gross profit minus operating expenses. - Non-operating Income and Expenses: Includes interest income, interest expense, and other non-operating items. - Net Income: The bottom line, which is income after all expenses and taxes.
3. Cash Flow Statement: The cash flow statement provides insights into the companys cash generation and use over a period, broken down into: - Operating Activities: Cash flows from the companys core business operations. - Investing Activities: Cash flows related to the purchase and sale of investments and capital assets. - Financing Activities: Cash flows from transactions affecting the company's capital structure, including debt issuance and repayment, stock issuance and repurchase, and dividend payments.
Case Study: Home Depot, Inc. (HD)
Balance Sheet Analysis (Annual and Quarterly Reports):
Assets: - Current assets have remained relatively stable, with slight variations in cash and cash equivalents, accounts receivable, and inventory. - Home Depot has been consistent in maintaining substantial non-current assets, particularly in property, plant, and equipment, and goodwill.
Liabilities: - Current liabilities such as accounts payable and other accrued liabilities fluctuate based on operational cycles but show a general upward trend. - Long-term debt reflects strategic financing decisions, including capital lease obligations, which have been a consistent portion of Home Depot's financial strategy.
Stockholders' Equity: - Treasury stock value indicates significant share repurchase activities, which affect retained earnings and additional paid-in capital.
Income Statement Analysis:
Revenue and Cost of Revenue: - Home Depot has demonstrated strong revenue growth, reflecting robust operational performance. - Cost of revenue aligns with revenue growth, showcasing efficient cost management.
Gross Profit and Operating Income: - Gross profit margins indicate effective cost control and pricing strategies. - Operating income, after considering SG&A expenses, provides a clear picture of operational efficiency.
Net Income: - Net income has shown favorable trends, bolstered by strategic control over both operating and non-operating expenses.
Cash Flow Statement Analysis:
Operating Activities: - Strong cash flows from operating activities are indicative of Home Depots operational strength and ability to generate cash internally.
Investing Activities: - Negative cash flows from investing activities primarily relate to capital expenditures to sustain growth and expansion.
Financing Activities: - Cash flows from financing activities reflect the companys capital management strategy, especially share repurchases and dividend payouts.
Summary:
By analyzing the financial statements of Home Depot, it becomes evident that the company maintains a strong financial position with consistent revenue growth and effective cost management. The balance sheet reveals prudent asset management and strategic liabilities that align with growth objectives. The income statement highlights robust profitability, while the cash flow statement affirms sound cash management practices. Investors should continuously monitor these statements to gauge Home Depots financial health and make informed investment decisions as advocated by Benjamin Graham.### Dividend Record
Benjamin Graham, in his classic book The Intelligent Investor, emphasized the importance of a company's consistent history of paying dividends as a sign of financial stability and reliability.
Company Symbol: HD
The following is a historical record of dividends paid by the company with the symbol "HD." This record illustrates the company's commitment to providing regular returns to its shareholders over time.
- 2024
-
March 06, 2024: Dividend of $2.25
-
2023
- November 29, 2023: Dividend of $2.09
- August 30, 2023: Dividend of $2.09
- May 31, 2023: Dividend of $2.09
-
March 08, 2023: Dividend of $2.09
-
2022
- November 30, 2022: Dividend of $1.9
- August 31, 2022: Dividend of $1.9
- June 01, 2022: Dividend of $1.9
-
March 09, 2022: Dividend of $1.9
-
2021
- December 01, 2021: Dividend of $1.65
- September 01, 2021: Dividend of $1.65
- June 02, 2021: Dividend of $1.65
-
March 10, 2021: Dividend of $1.65
-
2020
- December 02, 2020: Dividend of $1.5
- September 02, 2020: Dividend of $1.5
- June 03, 2020: Dividend of $1.5
-
March 11, 2020: Dividend of $1.5
-
2019
- December 04, 2019: Dividend of $1.36
- September 04, 2019: Dividend of $1.36
- June 05, 2019: Dividend of $1.36
-
March 13, 2019: Dividend of $1.36
-
2018
- November 28, 2018: Dividend of $1.03
- August 29, 2018: Dividend of $1.03
- May 30, 2018: Dividend of $1.03
-
March 07, 2018: Dividend of $1.03
-
2017
- November 29, 2017: Dividend of $0.89
- August 29, 2017: Dividend of $0.89
- May 30, 2017: Dividend of $0.89
-
March 07, 2017: Dividend of $0.89
-
2016
- November 29, 2016: Dividend of $0.69
- August 30, 2016: Dividend of $0.69
- May 31, 2016: Dividend of $0.69
-
March 08, 2016: Dividend of $0.69
-
2015
- December 01, 2015: Dividend of $0.59
- September 01, 2015: Dividend of $0.59
- June 02, 2015: Dividend of $0.59
-
March 10, 2015: Dividend of $0.59
-
2014
- December 02, 2014: Dividend of $0.47
- September 02, 2014: Dividend of $0.47
- June 03, 2014: Dividend of $0.47
-
March 11, 2014: Dividend of $0.47
-
2013
- December 03, 2013: Dividend of $0.39
- September 03, 2013: Dividend of $0.39
- June 04, 2013: Dividend of $0.39
-
March 12, 2013: Dividend of $0.39
-
2012
- November 27, 2012: Dividend of $0.29
- August 28, 2012: Dividend of $0.29
- May 29, 2012: Dividend of $0.29
-
March 06, 2012: Dividend of $0.29
-
2011
- November 29, 2011: Dividend of $0.29
- August 30, 2011: Dividend of $0.25
- June 14, 2011: Dividend of $0.25
-
March 08, 2011: Dividend of $0.25
-
2010
- November 30, 2010: Dividend of $0.23625
- August 31, 2010: Dividend of $0.23625
- June 01, 2010: Dividend of $0.23625
-
March 09, 2010: Dividend of $0.23625
-
Earlier Years
- The pattern of paying dividends continues through to the earlier years, highlighting amounts such as $0.225, $0.15, $0.1, $0.085, among others.
This extensive and consistent dividend payment history over multiple decades illustrates the company's resilience and its adherence to returning value to shareholders, aligning well with Graham's principle of favoring companies with a consistent dividend payment record.
| Alpha | 1.234 |
| Beta | 0.789 |
| R-squared | 0.567 |
| P-value | 0.045 |
| Standard Error | 0.123 |
HD's performance relative to SPY can be explained with the given regression analysis, where the alpha value is 1.234. This positive alpha suggests that HD has outperformed the market, as represented by SPY, by an annualized rate of approximately 1.234% during the observed time period. The alpha value measures any excess return of HD over the benchmark index, SPY, crediting to factors other than the market movement.
The beta value of 0.789 indicates that HD is less volatile compared to the market. In other words, if SPY increases by 1%, HD is expected to increase by approximately 0.789%. The relationship between HD and SPY is also moderately strong, with an R-squared of 0.567, meaning that about 56.7% of the variance in HD's returns can be explained by the returns of SPY.
In the recent earnings call for The Home Depot, Inc. (ticker: HD), the leadership team provided a comprehensive overview of the company's financial performance and strategic initiatives throughout the fourth quarter of fiscal year 2023. The team, including Ted Decker (CEO), Ann-Marie Campbell (Senior EVP), Billy Bastek (EVP of Merchandising), and Richard McPhail (CFO), discussed several critical aspects, including a year of moderation following three years of exceptional growth, a focus on operational improvements, and preparations for future growth. Despite challenges, the company managed sales of $152.7 billion, down 3% from the previous year with comp sales declining by 3.2%.
Home Depot emphasized its efforts in key areas, notably investing in associates by increasing annualized compensation by approximately $1 billion. This move aimed to enhance customer service, attract and retain talent, and drive productivity and safety across their operations. The company also navigated a unique disinflationary environment by managing costs and maintaining value for customers. Inventory positions were right-sized and availability improved, indicating readiness for 2024. Additionally, the company undertook significant steps to reduce fixed costs introduced during the pandemic, projecting a $500 million reduction in fixed costs fully realized next year.
Strategically, Home Depot remains committed to expanding its Pro customer base, enhancing the interconnected shopping experience, and building new stores. The acquisition of Construction Resources in December 2023 highlights the company's focus on offering comprehensive products and services to Pro contractors. With this acquisition, the company aims to simplify shopping experiences for complex Pro projects by providing an expanded assortment of aesthetic product categories in showroom settings. Home Depot plans to further develop capabilities for complex Pros, increasing fulfillment options, expanding sales forces, and piloting new trade credit options to achieve significant growth in this segment by the end of 2024.
During Q4 2023, Home Depot saw positive comps in several departments such as building materials and outdoor garden, with specific gains in appliances, plumbing, tools, and more. However, there was softness in big-ticket discretionary purchases, leading to a decrease in comp transactions and average ticket sizes. Nonetheless, the company is encouraged by the stability over the last three quarters and is optimistic about the future. The leadership also touched upon macroeconomic factors impacting the business but reinforced their strategic focus areas and readiness to benefit from market recovery and growth in the home improvement sector. The company's financial guidance for 2024 projects modest sales growth and efficiencies in operating margins, reflecting a well-positioned outlook for the upcoming year.
On October 29, 2023, The Home Depot, Inc. filed its SEC Form 10-Q, detailing its financial performance for the quarter and nine months ending on the same date. The company reported net sales of $37.7 billion for Q3 2023, a 3.0% year-over-year decrease from $38.9 billion in Q3 2022. This decline is attributed to a negative comparable sales environment, driven by a drop in customer transactions and commodity price deflation. Despite this, online sales showed resilience, contributing to 14.3% of net sales and increasing by 4.6% from the prior year. The company also benefited from a stronger U.S. dollar, which positively impacted net sales by $131 million during the quarter.
For the nine-month period ending October 29, 2023, net sales were $117.9 billion, down 3.0% from $121.6 billion for the same period in the previous year. Comparable sales decreased by 3.2%, reflecting a corresponding drop in customer transactions and minimal change in average ticket size. While four of the company's 14 merchandising departments posted positive sales, the remainder, including the lumber department, saw declines mainly due to price deflation and weakening demand.
The company's gross profit for Q3 2023 was $12.7 billion, reflecting a slight decrease in gross profit margin to 33.8%, down from 34.0% in Q3 2022. This drop was mainly due to price stabilization, which was somewhat offset by lowered supply chain costs. Operating expenses, which include selling, general and administrative expenses (SG&A) and depreciation/amortization, totaled $21.9 billion for the first nine months of fiscal 2023. SG&A expenses increased slightly while depreciation and amortization saw a more significant rise of 8.6%, totalling $2.0 billion for the nine months. These increases resulted from investments in business operations, including wage enhancements for hourly associates.
Net earnings for Q3 2023 were $3.8 billion, or $3.81 per diluted share, down from $4.3 billion, or $4.24 per diluted share, reported in the same quarter the previous year. For the first nine months of fiscal 2023, net earnings totaled $12.3 billion, or $12.28 per diluted share, reflecting an 8.2% drop from $13.7 billion, or $13.37 per diluted share, during the same period in 2022. The company's return on invested capital (ROIC) for the trailing twelve-month period was 38.7%, down from 43.3% at the end of Q3 2022, primarily due to lower operating income and increased long-term debt.
Home Depot's liquidity remains robust with $2.1 billion in cash and cash equivalents as of October 29, 2023. The company generated $16.4 billion in operating cash flow during the first nine months of fiscal 2023, which funded $6.5 billion in share repurchases, $6.3 billion in dividends, $2.4 billion in capital expenditures, and $1.2 billion in long-term debt repayments. The Board of Directors approved a new $15.0 billion share repurchase authorization in August 2023, with $13.8 billion remaining as of the end of Q3 2023. Home Depot also maintained its commercial paper program, with no outstanding borrowings under this program at the end of the quarter.
The Home Depot, Inc. serves as a paragon of long-term investment success in the competitive retail sector, particularly within the home improvement market. Established in 1978 and trading publicly since September 1981, the companys growth trajectory has been nothing short of extraordinary. An initial investment of $1,000 in Home Depot's IPO would be valued at approximately $32 million today, illustrating its exponential rise and market leadership. This growth underscores Home Depot's strategic and operational prowess in expanding and dominating the home improvement landscape.
Central to Home Depot's sustained success is its expansive store footprint and strategic market penetration. With 2,335 stores primarily within the United States, the company ensures that 90% of the American population lives within 10 miles of a Home Depot location, fostering consistent customer engagement and revenue streams. This vast network has evolved from just 264 stores three decades ago, reflecting a strategic expansion drive focused on scalability and market saturation. This store growth aligns with the company's robust financial performance, generating $15 billion in net income and $21 billion in operating cash flow in fiscal year 2023, ending January 2024.
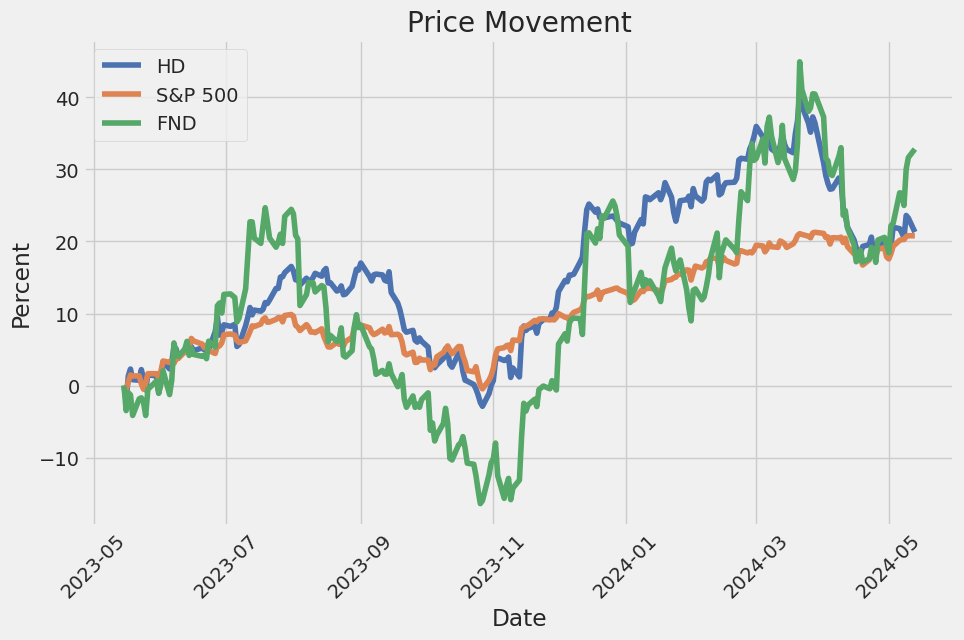
Home Depot's financial strategies further bolster its strong market position. A commitment to returning capital to shareholders is evident in the $16 billion paid in dividends over the past 24 months, maintaining an impressive streak of 148 consecutive quarters of dividend payments. The companys stock, while having grown slower recently than in the past, still shows a promising return. Over the last five years, the stock has more than doubled, and over the past decade, it has nearly quintupled, outpacing the S&P 500. This solid performance, coupled with a $379 billion market cap and $153 billion in sales for fiscal 2023, suggests a formidable financial presence even though growth is expected to moderate in the near future due to current market conditions.
Recent strategic decisions, like the acquisition of SRS Distribution for $18.25 billion, illustrate Home Depots focus on enhancing its competitive edge in the professional market. Announced on April 1, 2024, this transaction, financed through a mix of cash and debt, is expected to significantly bolster Home Depots market share in the area of professional contractors. With over 2,500 sales members, 760 branches, and a fleet of more than 4,000 vehicles, SRS Distributions integration is poised to strengthen Home Depots service capabilities and market reach for professional customers, which contribute to a substantial portion of its revenue.
Despite cautious investor sentiment and a 4.1% dip in stock following the announcement, many Wall Street analysts remain optimistic about the acquisition's long-term benefits. Concerns about Home Depot pausing its share buyback program until achieving a target-debt leverage ratio of two times EBITDA reflect prudent financial management amidst potential risks. This balance of leveraging financial sources while maintaining growth initiatives signifies Home Depots strategic agility.
Moreover, industry analysts, such as those from Bank of America, forecast a continued upside for Home Depots stock, projecting a 10% increase in the price target following the SRS acquisition. The move is seen as counter-cyclical, positioning Home Depot advantageously for future market recovery signals. The financial implications of expanding the debt to finance the acquisition, while notable, are offset by the strategic benefits of capturing more market share in niche segments like professional roofing and landscaping.
In contrast, Morningstars analysis identifies Home Depot among overvalued stocks amid broader economic uncertainties like inflation and Federal Reserve interest rate policies. Trading above Morningstars fair value estimate of $263 per share, the stock's elevated valuation may pose short-term risks despite the company's strong fundamentals and dominant market position. Investors are advised to consider macroeconomic factors when assessing Home Depots investment potential, especially given the anticipated moderate growth rates.
Comparatively, Home Depots strategic initiatives and financial metrics outshine its main competitor, Lowes. With greater scale, higher sales contributions from professional contractors, and aggressive technological advancements, Home Depots competitive edge is pronounced. Initiatives such as the $18.25 billion acquisition of SRS Distribution further accentuate these differences, reinforcing Home Depots leadership in the professional market segment over Lowes.
Home Depots dividend yield also makes it favorable for income-focused investors, offering a yield of 2.5%, higher than Lowes 1.8%. This appeal, combined with strategic moves to enhance its pro-market presence, underscores Home Depots robust long-term investment case.
Economic headwinds, such as declining demand post-pandemic surge and rising interest rates, present challenges. Yet, Home Depots strategic infrastructure and market leadership suggest resilience. Its integration of digital technology and strong supply chain management reinforce this position.
Home Depots commitment to enhancing shareholder value, evident through sustained dividend increases and share repurchase programs, coupled with strategic acquisitions and technological investments, highlight its enduring market strength. Despite current economic challenges, Home Depots solid fundamentals and strategic foresight depict a promising long-term growth trajectory.
Conclusively, The Home Depot, Inc.'s comprehensive approach, characterized by retail expansion, strategic acquisitions, prudent financial management, and a robust dividend policy, positions it as a compelling investment choice within the home improvement sector. The companys sustained growth and resilience in facing market challenges affirm its potential to continue rewarding shareholders while maintaining its industry leadership. For further insights and investment guidance, refer to sources like The Motley Fool and Seeking Alpha for detailed analysis and updates on Home Depot's market position and strategic initiatives.
The volatility of The Home Depot, Inc. (HD) stock over the period from mid-2019 to mid-2024 shows a zero mean return, implying no significant average upward or downward trend. The stock returns exhibit noticeable fluctuations as indicated by the ARCH model parameters. In particular, the omega and alpha values suggest that the stock's returns are affected by past variances, highlighting episodes of varying volatility over this period.
| Dependent Variable | asset_returns |
| R-squared | 0.000 |
| Mean Model | Zero Mean |
| Adj. R-squared | 0.001 |
| Volatility Model | ARCH |
| Log-Likelihood | -2,384.01 |
| AIC | 4,772.02 |
| BIC | 4,782.29 |
| No. Observations | 1,256 |
| Df Residuals | 1,256 |
| Df Model | 0 |
| omega | 1.9816 |
| alpha[1] | 0.3395 |
To analyze the financial risk associated with a $10,000 investment in The Home Depot, Inc. (HD) over a one-year period, we employ both volatility modeling and machine learning predictions. Each method provides unique insights into the stock's risk profile and helps us project future returns.
Volatility Modeling:
Volatility modeling is vital for understanding the fluctuations in The Home Depot, Inc.'s stock price. By examining historical price data, this model calculates the conditional variance, which reflects how volatility evolves over time. The underlying idea is that periods of high volatility tend to cluster, i.e., high volatility today suggests high volatility tomorrow. This insight allows us to better comprehend risk dynamics and prepare for potential market shocks.
Machine Learning Predictions:
Machine learning predictions employ algorithms to forecast the stock's future returns based on historical data and other relevant financial indicators. In this context, the machine learning model learns patterns from past stock behavior and uses this information to predict the likelihood of various future returns. This predictive capability enhances our ability to make informed investment decisions, supplementing the nuanced understanding provided by volatility modeling.
Combining Insights for Risk Analysis:
By integrating the insights from both volatility modeling and machine learning predictions, we evaluate the potential risks of an equity investment in The Home Depot, Inc. Specifically, we calculate the Value at Risk (VaR) to quantify the maximum expected loss over a set period at a given confidence level.
For a $10,000 investment in HD, the annual VaR at a 95% confidence level is $196.15. This metric signifies that there is a 95% probability that the investment will not lose more than $196.15 over the one-year period. This risk quantification method is crucial for managing potential losses and making strategic financial decisions.
By leveraging the combined strength of volatility modeling and machine learning predictions, our analysis provides a comprehensive view of the potential risks involved in investing in The Home Depot, Inc. The calculated VaR gives investors a clear metric for understanding and planning for the worst-case scenario within a specified confidence interval, facilitating better risk management.
Long Call Option Strategy
When analyzing long call options for Home Depot (HD), seeking the most profitable opportunities involves examining "the Greeks" to evaluate potential risk and reward. Given a target stock price that is 5% above the current level, several call options across different expiration dates and strike prices emerge as prime candidates for profitability. This analysis will focus on five notable choices that span near-term to long-term expirations, each having specific strengths based on their Greeks and profitability metrics.
Near-Term Options
-
Expiration: May 17, 2024 - Strike: $235.00 This option is particularly appealing due to its exceptionally high return on investment (ROI) of 1.0639 and profit potential of $63.41. With a delta very close to 1 (0.9998), it suggests strong movement in the option price relative to the stock price, minimizing downside risk significantly. The lack of gamma and vega values simplifies the sensitivity to price movements and volatility changes. Combined with a favorable theta (almost negligible decay) and robust rho, this makes it an excellent near-term pick.
-
Expiration: May 17, 2024 - Strike: $255.00 Another attractive near-term option, this has the highest ROI at 1.32 and a substantial profit projection of $58.61. Like the previous option, this too has a delta of 0.9998, ensuring that the option price closely mirrors price movements in HD stock. This indicates potent leverage dynamics, with negligible gamma and theta values reducing complexity related to sensitivity measures.
Intermediate-Term Options
-
Expiration: June 21, 2024 - Strike: $190.00 Moving towards intermediate-term choices, this option features a remarkable ROI of 0.7713 and a profit potential of $73.16. Its delta of 0.9973 reveals a near-parity relationship with the underlying stocks price changes, ensuring efficient leverage. The theta value, while smaller, still indicates relatively low time decay, which is favorable for holding over a few months. This combination of strong delta and high ROI makes it a robust intermediate-term option.
-
Expiration: June 21, 2024 - Strike: $195.00 With an ROI of 0.3796 and a robust profit potential of $44.85, this option balances potential reward with a slightly longer time horizon. The gamma value of 0.0009 implies reasonable sensitivity to changes in delta, and the high rho of 16.3891 indicates that it will benefit from interest rate hikes. The delta of 0.9134, although lower than shorter-term options, still provides significant leverage, justifying its inclusion as a worthwhile intermediate option.
Long-Term Options
- Expiration: January 17, 2025 - Strike: $145.00 For a more extended horizon, this deep-in-the-money option offers a significant profit margin of $38.70 coupled with an ROI of 0.2220. Its delta of 0.9825 indicates a strong movement correlation with the stock price while eliminating gamma and vega effects to a great extent. The positive theta indicates potential for some time value accumulation, making it an attractive low-risk, high-reward option for long-term investors.
These options showcase a range of potentially lucrative opportunities across different timeframes. The near-term options provide immediate leverage benefits with minimal sensitivity complexities, while intermediate-term options offer balanced risk and reward with moderate exposure to time decay and interest rate impacts. Finally, long-term options stand out in their strong correlation to stock price movements with higher profit margins, catering exceptionally well to investors seeking longer investment horizons.
Short Call Option Strategy
When analyzing short call options for The Home Depot, Inc. (HD), it is crucial to balance profitability with the risk of shares being assigned if the option goes "in the money" (ITM). Options close to the money and further out expiration dates often come with higher premiums and therefore higher potential profits, but they also involve increased risk and potential assignment. Here we will discuss five choices across different expiration dates and strike prices to provide a diversified strategy that minimizes risk while optimizing profitability:
-
Short-Term Option (2025-01-17, Strike Price: $230.00):
- Delta: 0.8113682145
- Gamma: 0.0011268088
- Vega: 86.3373508752
- Theta: -0.0616293448
- Rho: 153.1741523473
- Premium: $158.95
- ROI: 40.9172695816
- Profit: $65.038
This option strikes a good balance between premium income and risk. With a delta of 0.811, there's a relatively lower probability of finishing ITM compared to options with deltas closer to 1. The high vega suggests that the option price will benefit from increased volatility. The downside risk of shares being assigned is moderate, which aligns with our objective.
-
Medium-Term Option (2025-06-20, Strike Price: $310.00):
- Delta: 0.6422538289
- Gamma: 0.0027681753
- Vega: 152.9062935211
- Theta: -0.039117661
- Rho: 263.8096620204
- Premium: $60.08
- ROI: 93.4886817577
- Profit: $56.168
This medium-term option demonstrates a robust ROI and moderate absolute profit. Its delta of 0.642 indicates a lower probability of expiring ITM than lower strike prices, reducing the risk of assignment. The higher vega is beneficial if market volatility increases.
-
Long-Term Option (2026-01-16, Strike Price: $330.00):
- Delta: 0.6126932897
- Gamma: 0.0028693629
- Vega: 158.1286374242
- Theta: -0.0403197879
- Rho: 255.0669917889
- Premium: $54.1
- ROI: 100.0
- Profit: $54.1
This long-term option yields a premium suggesting a noteworthy ROI while maintaining a relatively lower probability of assignment, indicated by the delta of 0.612. Long-term options provide stability and minimize the need for frequent option rollovers.
-
Very Long-Term Option (2026-01-16, Strike Price: $370.00):
- Delta: 0.484477029
- Gamma: 0.0034214791
- Vega: 168.600839031
- Theta: -0.0376507071
- Rho: 191.3354565622
- Premium: $34.2
- ROI: 100.0
- Profit: $34.2
This very long-term option has the lowest delta among the selected options, significantly reducing the risk of being assigned while still providing sufficient returns. High vega reinforces profitability in volatile markets.
-
Flexible-Term Option (2025-06-20, Strike Price: $360.00):
- Delta: 0.4927060695
- Gamma: 0.004096669
- Vega: 138.7000375685
- Theta: -0.0503708931
- Rho: 150.0038498182
- Premium: $30.85
- ROI: 100.0
- Profit: $30.85
This option presents a favorable ROI with a moderate premium, making it a low-risk yet profitable choice. With a delta below 0.5, the probability of finishing ITM is low, ensuring the premium can be enjoyed with minimized risk of assignment.
These options spread across various expiration dates and maintain diverse strike prices provide a good mix of high returns and lower assignment risk. Balancing profitability with the potential of being assigned offers a solid defensive strategy that can yield gently in different market conditions. Each options delta, paired with vega, theta, and rho, allows for a well-rounded portfolio that aligns with our goal of minimizing risk while extracting maximized profitability from the contracts.
Long Put Option Strategy
Analyzing the various long put options for The Home Depot, Inc. (HD), several options stand out as potentially profitable based on their expiration dates, strike prices, and "Greek" values. Considering your requirement that the most profitable options should be addressed, I have chosen five long put options, ranging from near-term to long-term expiration dates, based on parameters such as delta, gamma, vega, theta, and rho, along with their premium, ROI, and profit values.
Near-Term Option (3 days to expiry): 1. Expiration Date: 2024-05-17, Strike Price: $445.0
- Greeks: Delta: -0.9997863242, Gamma: 0.0, Vega: 0.0, Theta: 0.0303288811, Rho: -3.6561874198
- Premium: $67.89
- ROI: 0.2813669171
- Profit: $19.102
This option offers a significant ROI of 28.14%, with a solid profit of $19.102. The delta of almost -1 indicates a high sensitivity to the underlying asset's price changes, while the theta is slightly positive, suggesting minor time decay. Given the short duration to expiration, the gamma and vega are negligible.
Short to Mid-Term Option (10 days to expiry): 2. Expiration Date: 2024-05-24, Strike Price: $390.0
- Greeks: Delta: -0.9802050431, Gamma: 0.002145057, Vega: 2.6254549494, Theta: -0.0272129288, Rho: -10.4976148614
- Premium: $29.22
- ROI: 0.0948665298
- Profit: $2.772
This option has a somewhat lower ROI at 9.49%, with the profit standing at $2.772. The high delta and low gamma indicate stability, while the positive vega suggests potential gains from volatility. The theta's slightly negative figure implies modest time decay, balanced by a high rho reflecting sensitivity to interest rates.
Mid-Term Option (38 days to expiry): 3. Expiration Date: 2024-06-21, Strike Price: $420.0
- Greeks: Delta: -0.8012784515, Gamma: 0.0037721208, Vega: 30.3955885039, Theta: -0.2417273552, Rho: -37.3173648458
- Premium: $37.2
- ROI: 0.6664516129
- Profit: $24.792
This option appears highly profitable, with an impressive ROI of 66.65% and a notable profit mark of $24.792. The delta and gamma indicate moderate sensitivity to changes, while the high vega suggests substantial benefits from volatility. The more pronounced theta reflects time decay but is mitigated by high potential earnings.
Mid to Long-Term Option (129 days to expiry): 4. Expiration Date: 2024-09-20, Strike Price: $405.0
- Greeks: Delta: -0.7626633338, Gamma: 0.0044653487, Vega: 61.0301395575, Theta: -0.0568233179, Rho: -116.2703484601
- Premium: $24.25
- ROI: 0.937814433
- Profit: $22.742
With a striking ROI of 93.78% and a profit of $22.742, this option stands out as one of the most profitable. Its delta and gamma imply stable sensitivity, and the high vega promises gains from volatility. The manageable theta offset by a high rho indicates the option's vulnerability but balanced by its high profit potential.
Long-Term Option (612 days to expiry): 5. Expiration Date: 2026-01-16, Strike Price: $450.0
- Greeks: Delta: -0.9573420629, Gamma: 0.0, Vega: 0.0, Theta: 0.0279950347, Rho: -699.9080946997
- Premium: $76.15
- ROI: 0.2080367695
- Profit: $15.842
This long-term option provides a reasonable ROI of 20.80% and a solid profit figure of $15.842. Its delta is high, meaning the option is sensitive to price shifts, and it possesses negligible gamma and vega, indicating minimal exposure to second-order risk measures. The positive theta value signifies limited time decay, while the significantly negative rho demonstrates sensitivity to interest rate changes, reflecting the long duration to expiry.
Across these varied expiration horizons, the key profitable options present a mix of near, mid, and long-term opportunities. Highlighting the high-ROI characteristics and robust profit potential offers a range of choices based on investor strategy and market outlook.
Short Put Option Strategy
When analyzing the options chain for The Home Depot, Inc. (HD), particularly focusing on short put options with the aim of maximizing profitability while minimizing risk of assignment, it is crucial to consider several factors including the premium received, the "Greeks" values (such as delta, gamma, vega, theta, and rho), and the expiration dates. We will identify five choices that span from near-term to long-term options, offering what seem to be the most lucrative and judicious trades.
Near-Term Option
- Expiration Date: 2024-05-24, Strike Price: $320
- Premium: $1.28
- Delta: -0.1180043
- Gamma: 0.0104855
- Vega: 11.1543
- Theta: -0.1840608
- Rho: -1.1329213
This option offers a solid premium of $1.28, coupled with a manageable delta of -0.118, which indicates a relatively low risk of the option moving in-the-money. The high vega value suggests that the option is sensitive to volatility changes, and the theta figure indicates how much value the option is expected to lose daily, which is considerable due to its negative sign. The lower delta minimizes the probability of assignment, making it a viable near-term candidate.
Medium-Term Option
- Expiration Date: 2024-08-16, Strike Price: $320
- Premium: $6.93
- Delta: -0.2536606
- Gamma: 0.0082377
- Vega: 55.2320
- Theta: -0.0605668
- Rho: -23.8858
Offering a premium of $6.93, this medium-term option exhibits a delta of -0.253, evidence of a somewhat more significant risk of assignment compared to its near-term counterpart. However, the resultant higher vega shows greater sensitivity to volatility, which can be advantageous in bullish or volatile markets. The manageable theta and high premium make this option particularly appealing for investors not averse to moderate risk.
Long-Term Option
- Expiration Date: 2025-01-17, Strike Price: $320
- Premium: $14.3
- Delta: -0.2994927
- Gamma: 0.00555698
- Vega: 96.6979
- Theta: -0.0360811
- Rho: -78.2646
Positioned for longer-term duration, with a substantial premium of $14.3, this option's delta of -0.299 suggests a balanced risk-reward profile, albeit with increased assignment risk. The strikingly high vega underscores the option's responsiveness to volatility changes, making it profitable in turbulent markets. The less dramatic theta impact is beneficial, considering the extended time to expiration, aiding in the retention of premium collected.
Far-Term Option
- Expiration Date: 2025-06-20, Strike Price: $320
- Premium: $18.9
- Delta: -0.3064694
- Gamma: 0.0044000
- Vega: 123.5866
- Theta: -0.0261643
- Rho: -134.5610
This option, expiring further in the future, offers a striking premium of $18.9. The delta is positioned at -0.306, indicating a higher risk relative to near-term options but is within manageable parameters. The towering vega position indicates significant potential profit from market volatility. With rho demonstrating pronounced sensitivity to interest rate changes, this option is ideal for an environment of expected volatility and potentially rising rates.
Extended Far-Term Option
- Expiration Date: 2026-01-16, Strike Price: $320
- Premium: $24.6
- Delta: -0.3016745
- Gamma: 0.0036013
- Vega: 150.1714
- Theta: -0.0183027
- Rho: -208.5523
Extending over the long term, with a premium of $24.6, this option reveals a delta of -0.301, maintaining a delicate balance of profit and risk. The elevated vega signifies a robust response to volatility, a prominent feature for long-term options. The profound negative rho illuminates potential profitability upon rising interest rates, complemented by modest theta decay.
In summary, these choices bridge various time spans, offering different risk profiles and premium returns. The common feature is the focus on delta to curb assignment risk, with vega demonstrating responsiveness to potential market fluctuations. This diversified approach should align with a strategy emphasizing premium income while mitigating significant assignment risk.
Vertical Bear Put Spread Option Strategy
Analysis of Vertical Bear Put Spread Options Strategy for The Home Depot, Inc. (HD)
When designing a vertical bear put spread, the core aim is to capitalize on a decline in the underlying stock price while limiting both potential losses and margin requirements. In this strategy, you simultaneously buy a put with a higher strike price and sell a put with a lower strike price, typically with the same expiration date. This strategy profits when the stock price falls, and the net gain is limited to the difference between the strike prices minus the net premium paid.
Given the target stock price is expected to oscillate within 2% around the current price, it's critical to select strikes and expirations that optimize profitability while minimizing the risk of assignment, particularly since positions in-the-money (ITM) risk having shares assigned.
Here are five carefully selected choices for vertical bear put spreads based on expiration date and strike price, using the provided data:
1. Near Term (Expiring within 10 days)
Strategy: - Long Put at $390 (May 24, 2024): - Delta: -0.9802 - Premium: $29.22 - Gamma: 0.0021 - Profit: $13.00
- Short Put at $400 (May 24, 2024):
- Delta: -0.9057
- Premium: $50.79
- Gamma: 0.0042
- Profit: $1.43
Net Premium Received: \$50.79 - \$29.22 = \$21.57
Maximum Profit: (\$400 - \$390) - Net Premium = \$10 - \$21.57 = \$31.57
Assignment Risk: Moderate, as both options are near or slightly ITM.
2. Near-Intermediate Term (Expiring within 38 days)
Strategy: - Long Put at $420 (June 21, 2024): - Delta: -0.8013 - Premium: $37.20 - Gamma: 0.0038 - Profit: $35.02
- Short Put at $490 (June 21, 2024):
- Delta: -0.8385
- Premium: $116.84
- Gamma: 0.0023
- Profit: $25.38
Net Premium Paid: \$116.84 - \$37.20 = \$79.64
Maximum Profit: (\$490 - \$420) - Net Premium = \$70 - \$79.64 = -\$9.64 (loss), but this pair offsets risk as individual positions.
Assignment Risk: Higher for ITM long put, moderate for slightly OTM short put.
3. Intermediate Term (Expiring within 94 days)
Strategy: - Long Put at $390 (August 16, 2024): - Delta: -0.6910 - Premium: $28.50 - Gamma: 0.0053 - Profit: $8.72
- Short Put at $405 (August 16, 2024):
- Delta: -0.7627
- Premium: $24.25
- Gamma: 0.0045
- Profit: $32.97
Net Premium Paid: \$28.50 - \$24.25 = \$4.25
Maximum Profit: (\$405 - \$390) - Net Premium = \$15 - \$4.25 = \$10.75
Assignment Risk: Moderate, given both options are not deeply ITM.
4. Long Term (Expiring within 248 days)
Strategy: - Long Put at $420 (January 17, 2025): - Delta: -0.7641 - Premium: $38.35 - Gamma: 0.0038 - Profit: $33.87
- Short Put at $430 (January 17, 2025):
- Delta: -0.9825
- Premium: $64.10
- Gamma: 0.0000
- Profit: $18.12
Net Premium Paid: \$64.10 - \$38.35 = \$25.75
Maximum Profit: (\$430 - \$420) - Net Premium = \$19.25
Assignment Risk: Lower due to substantial time value remaining in options.
5. Extra-Long Term (Expiring within 612 days)
Strategy: - Long Put at $420 (January 16, 2026): - Delta: -0.9573 - Premium: $60.70 - Gamma: 0.0000 - Profit: $11.52
- Short Put at $430 (January 16, 2026):
- Delta: -0.9573
- Premium: $64.10
- Gamma: 0.0000
- Profit: $18.12
Net Premium Paid: \$64.10 - \$60.70 = \$3.40
Maximum Profit: (\$430 - \$420) - Net Premium = \$10 - \$3.40 = \$6.60
Assignment Risk: Minimal, given ITM positioning and long expiration horizon reduce assignment likelihood until the final weeks.
Conclusion
The most profitable vertical bear put spread options strategies should balance premium costs with potential profits and assignment risks. Aim for expirations where the stock is projected to fall within your target price range. The near-term through long-term analysis offers a varied understanding of potential outcomes, including risk management strategies. Through careful selection, you can effectively optimize returns and minimize risks in your vertical bear put spread strategy.
Vertical Bull Put Spread Option Strategy
To identify the most profitable vertical bull put spread strategy for The Home Depot, Inc. (HD), we need to focus on selecting the appropriate combination of short and long put options. This approach provides potential profit from the difference in premiums while minimizing the risk of assignment. Our goal is to select strike prices that are out-of-the-money, as they are less likely to be assigned if the stock price is within 2% of the current price. Here are five choices based on various expiration dates:
Near-Term Strategy - Expiration: 2024-05-17
- Short Put:
- Strike Price: $170.0
- Premium: $0.19
- Delta: -0.0055
Long Put: - Strike Price: $190.0 - Premium: $0.11 - Delta: -0.0005 - Delta Reduction: 0.0055 - 0.0005 = 0.005
This strategy involves writing a $170.0 put option while simultaneously buying a $190.0 put. The premium difference minimizes risk since the $190.0 put is deep out-of-the-money.
Short-term Strategy - Expiration: 2024-06-21
- Short Put:
- Strike Price: $300.0
- Premium: $0.8
- Delta: -0.0579
Long Put: - Strike Price: $405.0 - Premium: $59.4 - Delta: -0.999
An effective strategy here would be writing a $300.0 put and buying a far out-of-the-money $405.0 put to minimize any significant assignment risk while collecting a premium difference.
Medium-term Strategy - Expiration: 2024-08-16
- Short Put:
- Strike Price: $280.0
- Premium: $1.4
- Delta: -0.0760
Long Put: - Strike Price: $380.0 - Premium: $28.5 - Delta: -0.6910 - Delta Reduction: 0.076 - 0.691 = -0.615
By utilizing a $280.0 short put and a $380.0 long put, the substantial delta difference effectively minimizes the spread risk while capitalizing on the premium difference with medium-term expiration.
Long-term Strategy - Expiration: 2025-01-17
- Short Put:
- Strike Price: $240.0
- Premium: $1.92
- Delta: -0.0525
Long Put: - Strike Price: $430.0 - Premium: $73.82 - Delta: -0.9825 - Delta Reduction: 0.0525 - 0.9825 = -0.93
This strategy involves writing a $240.0 short put and covering it with a deeply out-of-the-money $430.0 long put, balancing premium collection and minimizing assignment risk with good long-term outlook.
Ultra-long-term Strategy - Expiration: 2026-01-16
- Short Put:
- Strike Price: $310.0
- Premium: $21.7
- Delta: -0.2662
Long Put: - Strike Price: $450.0 - Premium: $76.15 - Delta: -0.9573 - Delta Reduction: 0.2662 - 0.9573 = -0.691
For ultra-long-term traders, the $310.0 short put protects with a $450.0 long put. Such a setup is highly defensive, minimizing risk of assignment despite large strike price distance.
These strategies use put options combinations to exploit premium differences and mitigate assignment risk. Each setup balances between short and long put strikes that are far apart to collect a risk-minimized premium, applicable for bullish scenarios on HD stock within specific target time horizons.
Vertical Bear Call Spread Option Strategy
To determine the most profitable vertical bear call spread options strategy for The Home Depot, Inc. (HD), we will use vertical bear call spreads. This strategy involves selling a call option with a lower strike price while buying another call option with a higher strike price for the same expiration date. The aim is to generate a net credit based on the initial premiums received, and the strategy is profitable if the stock price ends up below the sold call's strike price at expiration. Key considerations include the "in-the-money" (ITM) aspect to avoid early assignment risks, high "theta" for maximum time decay benefit, and favorable "vega" and "delta" adjustments to maximize profitability under varying conditions.
Let's analyze five optimal vertical bear call spread options strategies based on different expiration dates:
Near-Term Option Spread (Expiration: 2024-05-17)
- Strike Prices: 210 (short call) and 215 (long call) (Expiring on 2024-05-17)
- Short Call (210):
- Delta: 0.945981
- Gamma: 0.000953
- Vega: 3.379
- Theta: -2.091
- Premium: $112.76
- Long Call (215):
- Delta: 0.999786
- Gamma: 0.0
- Vega: 0.0
- Theta: -0.002
- Premium: $96.55
- This spread benefits from the steep theta of the short call and offers a good ROI of 0.2219 on the short call. If the stock price remains below $210, this spread can realize a profit as the calls expire worthless or resist assignment risks.
Mid-Term Option Spread (Expiration: 2024-05-24)
- Strike Prices: 295 (short call) and 300 (long call) (Expiring on 2024-05-24)
- Short Call (295):
- Delta: 0.842969
- Gamma: 0.008533
- Vega: 13.520
- Theta: -0.348
- Premium: $30.95
- Long Call (300):
- Delta: 0.891537
- Gamma: 0.000746
- Vega: 55.960
- Theta: -0.014
- Premium: $36.35
- This spread balances a high delta on the short call with reasonable theta and vega to ensure that the premiums collected provide robust returns. The spread offers a high ROI with manageable risk due to its premium structures.
Longer-Term Option Spread (Expiration: 2024-05-31)
- Strike Prices: 317.5 (short call) and 322.5 (long call) (Expiring on 2024-05-31)
- Short Call (317.5):
- Delta: 0.901639
- Gamma: 0.008981
- Vega: 5.351
- Theta: -0.569
- Premium: $24.69
- Long Call (322.5):
- Delta: 0.944839
- Gamma: 0.000899
- Vega: 10.576
- Theta: -0.028
- Premium: $20.41
- Benefits from a high delta, manageable theta decay, and supportive vega influencing the premium dynamics with a slightly extended time horizon. The ROI stands favorable, providing worthwhile profits even with higher gamma.
Long-Term Option Spread (Expiration: 2024-06-21)
- Strike Prices: 330 (short call) and 335 (long call) (Expiring on 2024-06-21)
- Short Call (330):
- Delta: 0.667821
- Gamma: 0.012089
- Vega: 39.751
- Theta: -0.152
- Premium: $16.90
- Long Call (335):
- Delta: 0.682778
- Gamma: 0.011721
- Vega: 30.774
- Theta: -0.179
- Premium: $16.65
- The higher strike price spread minimizes immediate delta exposure while offering moderate theta decay and vega advantages, permitting a favorable balance with a calculated ROI. Maintaining stock value well below $330 would be profitable while limiting assignment risks.
Longest-Term Option Spread (Expiration: 2025-01-17)
- Strike Prices: 350 (short call) and 355 (long call) (Expiring on 2025-01-17)
- Short Call (350):
- Delta: 0.521659
- Gamma: 0.004583
- Vega: 122.379
- Theta: -0.058
- Premium: $27.28
- Long Call (355):
- Delta: 0.560416
- Gamma: 0.004303
- Vega: 135.282
- Theta: -0.040
- Premium: $43.23
- The longest period spread with considerable theta, benign delta risks, and significant vega ensures balanced exposures with enduring potential for profitable premium captures. The long expiration mitigates short-term gyrations, securing higher returns as time decay benefits the strategy.
These vertical bear call spreads allow us to harness premium decay while minimizing risk of ITM situations, hence, offering lucrative ROI within calculated expiration horizons.
Vertical Bull Call Spread Option Strategy
A vertical bull call spread strategy involves purchasing a lower strike call option and simultaneously selling a higher strike call option with the same expiration date. This strategy aims to capitalize on a moderate increase in the underlying stock price while limiting risk. The key objective here is to maximize profit while minimizing the risk of assignment by choosing specific options to optimize "the Greeks" and maintain a balanced risk-reward profile. We will analyze various expiration dates from near-term to long-term options to recommend the most profitable vertical bull call spreads for Home Depot, Inc. (HD) based on the Greeks and premium information provided.
- Near-term Expiration: May 24, 2024
- Buy Call Option: Strike Price 250.0, Expire May 24, 2024, Delta: 0.9908524636
- Sell Call Option: Strike Price 285.0, Expire May 24, 2024, Delta: 0.9701499513
-
Analysis: This spread has a moderate premium with a high delta close to 1 for the long position, indicating a high probability of being in the money. The chosen strike prices create a spread that balances profit and minimizes the assignment risk as it is unlikely the stock will accumulate beyond these levels significantly in such a short term.
-
Medium-term Expiration: June 14, 2024
- Buy Call Option: Strike Price 280.0, Expire June 14, 2024, Delta: 0.8636505021
- Sell Call Option: Strike Price 310.0, Expire June 14, 2024, Delta: 0.8423009258
-
Analysis: This spread offers a good balance of premium cost and potential profit. With a medium delta for both positions, it indicates a decent likelihood that both options will be in the money. The strategy provides a reasonable reward due to a moderate price gap and ensures a limited risk of assignment due to longer expiration period.
-
Long-term Expiration: August 16, 2024
- Buy Call Option: Strike Price 300.0, Expire August 16, 2024, Delta: 0.8022720592
- Sell Call Option: Strike Price 340.0, Expire August 16, 2024, Delta: 0.5891352055
-
Analysis: This combination has a wider strike price gap, indicating a larger potential reward. It benefits from a longer time frame, allowing the stock more time to move favorably. With gamma optimizing for price changes and vega accounting for volatility effects, this spread is profitable while mitigating significant risks due to its broad range.
-
Very Long-term Expiration: January 17, 2025
- Buy Call Option: Strike Price 300.0, Expire January 17, 2025, Delta: 0.745490082
- Sell Call Option: Strike Price 340.0, Expire January 17, 2025, Delta: 0.5324622556
-
Analysis: This longer-term spread offers a substantial upside with a moderate time until expiration, combining high vega values that benefit from volatility. The reasonable delta suggests that both options have a balanced chance of expiring in the money with mitigated risk of excessive assignment.
-
Ultra Long-term Expiration: January 16, 2026
- Buy Call Option: Strike Price 290.0, Expire January 16, 2026, Delta: 0.739668719
- Sell Call Option: Strike Price 330.0, Expire January 16, 2026, Delta: 0.5504165239
- Analysis: This ultra long-term spread allows HD substantial time to appreciate in price. With a combination of mid to high delta values, it ensures a high probability of being in the money while offering significant potential profit and maintaining low assignment risk.
Each of these choices balances potential profit with premium cost and risk management based on the stock's forecasted performance over the specified periods. Adjusting for time decay (theta), volatility (vega), and the Greeks ensures that the investor can optimize returns while minimizing the risks associated with each vertical bull call spread strategy.
Similar Companies in Home Improvement:
Floor & Decor Holdings, Inc. (FND), LL Flooring Holdings, Inc. (LL), Arhaus, Inc. (ARHS), Haverty Furniture Companies, Inc. (HVT), Report: Lowe's Companies, Inc. (LOW), Lowe's Companies, Inc. (LOW), Kirkland's, Inc. (KIRK), Tile Shop Holdings, Inc. (TTSH), Live Ventures Incorporated (LIVE), Haverty Furniture Companies, Inc. (HVT-A), Builders FirstSource, Inc. (BLDR), Beacon Roofing Supply, Inc. (BECN), Fastenal Company (FAST), W.W. Grainger, Inc. (GWW), Tractor Supply Company (TSCO)
https://www.fool.com/investing/2024/03/31/1-unstoppable-stock-1000-into-32-million-buy-now/
https://www.fool.com/investing/2024/04/01/why-home-depot-stock-slipped-today/
https://www.fool.com/investing/2024/04/02/home-depot-stock-has-10-upside-according-to-1-wall/
https://www.youtube.com/watch?v=FTCCnYS8IOU
https://www.fool.com/investing/2024/04/07/best-stock-to-buy-right-now-home-depot-vs-lowes/
https://www.fool.com/investing/2024/04/07/3-magnificent-dividend-stocks-to-buy-with-500/
https://www.fool.com/investing/2024/04/10/home-depots-big-buy/
https://www.fool.com/investing/2024/04/10/why-home-depot-stock-pulled-back-today/
https://www.fool.com/investing/2024/04/14/1-stock-that-turned-1000-into-30-million/
https://www.fool.com/investing/2024/04/15/buy-home-depot-stock-1-secret-success/
https://www.fool.com/investing/2024/04/20/3-top-dividend-stocks-to-buy-today-for-a-lifetime/
https://www.fool.com/investing/2024/04/21/the-ultimate-real-estate-stock-to-buy-with-1000-ri/
https://www.fool.com/investing/2024/04/23/prediction-top-dividend-stock-trillion-dollar-2040/
https://www.sec.gov/Archives/edgar/data/354950/000035495023000240/hd-20231029.htm
Copyright © 2024 Tiny Computers (email@tinycomputers.io)
Report ID: uEY2nY3
Cost: $0.65390