SPDR S&P Insurance ETF (ticker: KIE)
2024-01-28
 The SPDR S&P Insurance ETF, operating under the ticker symbol KIE, is a sector-specific exchange-traded fund that provides investors with exposure to the insurance segment of the U.S. financial industry. Managed by State Street Global Advisors, KIE aims to track the performance of the S&P Insurance Select Industry Index, which represents the insurance sector of the S&P Total Market Index. This ETF encompasses a mix of property & casualty insurers, life insurers, reinsurance companies, and insurance brokerage firms. By investing in KIE, shareholders get diversified exposure across various insurance companies, allowing them to potentially benefit from the overall growth and stability of the insurance industry while mitigating the risks associated with investing in individual stocks. KIE provides a straightforward investment strategy for those looking to tap into the insurance market's performance, offering both transparency and liquidity by being publicly traded on major exchanges. The ETF's holdings are rebalanced quarterly, ensuring the fund stays true to its underlying index and operational objectives.
| Previous Close | 47.51 | Open | 47.56 | Day Low | 47.45 |
| Day High | 47.64 | Price to Earnings (Trailing) | 14.87 | Volume | 372,097 |
| Average Volume | 1,057,355 | Average Volume (10 days) | 777,300 | Bid | 47.57 |
| Ask | 49.82 | Bid Size | 900 | Ask Size | 800 |
| Yield | 1.45% | Total Assets | $709,476,480 | 52 Week Low | 36.86 |
| 52 Week High | 47.85 | 50 Day Average | 45.4294 | 200 Day Average | 42.5142 |
| NAV Price | 47.49595 | YTD Return | 5.06% | 3 Year Average Return | 14.04% |
| 5 Year Average Return | 11.75% | Category | Financial | Beta (3 Year) | 0.72 |
| Sharpe Ratio | -24.31123677102345 | Sortino Ratio | -349.0586476078072 |
| Treynor Ratio | 0.16650878822405074 | Calmar Ratio | 0.8791631097375746 |
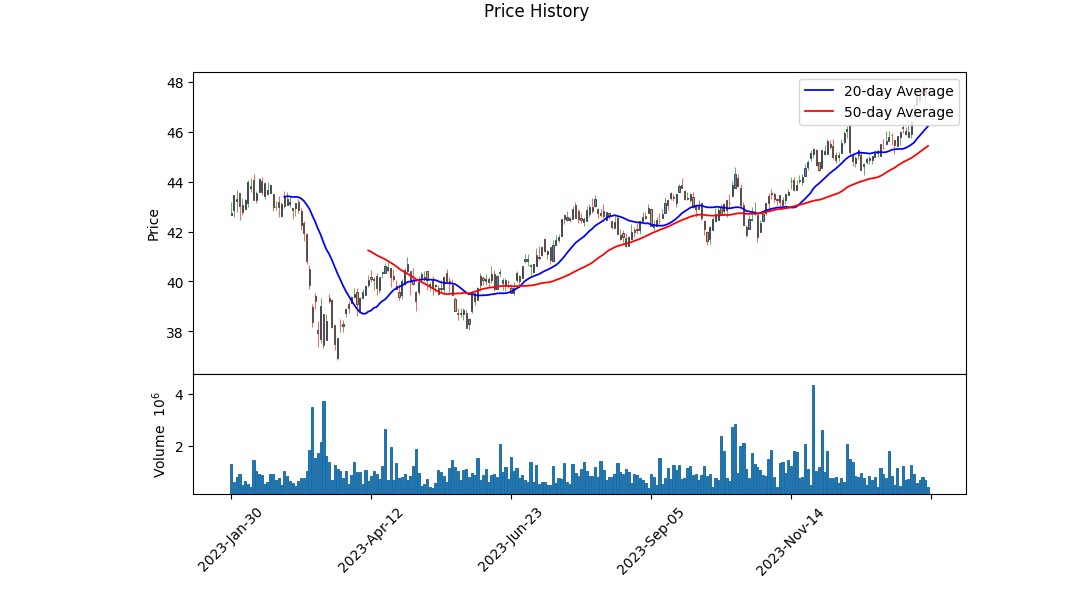
Analysis of KIE's technical data illustrates a consistently increasing On-balance volume (OBV), which suggests an uptrend with buyers likely outweighing sellers. The OBV peaked towards the latest date in the presented data, signifying continued interest and potentially higher future prices. Furthermore, the recent daily closing prices are progressing toward the upper end of the reported interval, which indicates strength and lends support to an upward movement. This uptrend is corroborated by the 50-day moving average (45.4294) being surpassed by recent price actions, and a positive divergence in the Moving Average Convergence Divergence (MACD) histogram, which can be a bullish sign.
Considering the fundamentals, a trailing Price to Earnings (PE) ratio of 14.87 suggests the stock is not overvalued when compared to historical average PE ratios. The Net Assets and NAV values are substantial and the inclusion in the SPDR State Street Global Advisors fund family positions the ETF within a reputable and established group. The reported moderate beta of 0.72 implies lower volatility relative to the market, which should be appealing to risk-averse investors.
The reported ratios reflect on the risk-adjusted returns. The negative Sharpe and Sortino ratios are unusual and signal that the investment might have experienced a decline over the past year, as these ratios incorporate the standard deviation of returns and the downside deviation, respectively. However, this backward-looking assessment does not inevitably predict future performance. Conversely, positive Treynor and Calmar ratios insinuate that KIE might be managing market risks effectively and performing well compared to the overall market volatility. The Treynor Ratio, in particular, indicates a relatively good return when accounting for systematic risk, while the Calmar Ratio's positivity suggests resilience against larger market drawdowns.
Without balance sheets, cash flows, and earnings information, the analysis relies predominantly on market behavior and the ETF's attributes. Given the observable data points and recent technical indicators, the outlook for KIE could be cautiously optimistic. However, continued monitoring of market conditions, sector performance (in this case, insurance), and broader economic indicators is essential to fine-tune any forward-looking projections and strategy. It should also be noted that while ETF fundamentals provide context, they do not offer as detailed insights into financial health as individual company balance sheets.
It is important to recognize that while ETFs like KIE derive their value from the underlying assets, their performance can also be swayed by overall market sentiment, supply and demand for the ETF itself, and the performance of the insurance sector. With that in mind, a nuanced approach should be taken, staying attuned to both the technical analysis updates and fundamental shifts which may affect the ETF's trajectory going forward.
| Statistic | Value |
| R-squared | 0.678 |
| Adj. R-squared | 0.677 |
| F-statistic | 2,639 |
| Prob (F-statistic) | 7.24e-311 |
| Log-Likelihood | -1,668.9 |
| AIC | 3,342 |
| BIC | 3,352 |
| coef (const) | -0.0066 |
| coef (KIE) | 1.0056 |
| std err (const) | 0.026 |
| std err (KIE) | 0.020 |
| t (const) | -0.257 |
| t (KIE) | 51.372 |
| P>|t| (const) | 0.797 |
| P>|t| (KIE) | 0.000 |
| [0.025 (const)] | -0.057 |
| [0.975 (const)] | 0.044 |
| [0.025 (KIE)] | 0.967 |
| [0.975 (KIE)] | 1.044 |
| Alpha | -0.006641349489180255 |
| Beta | 1.005552150305876 |
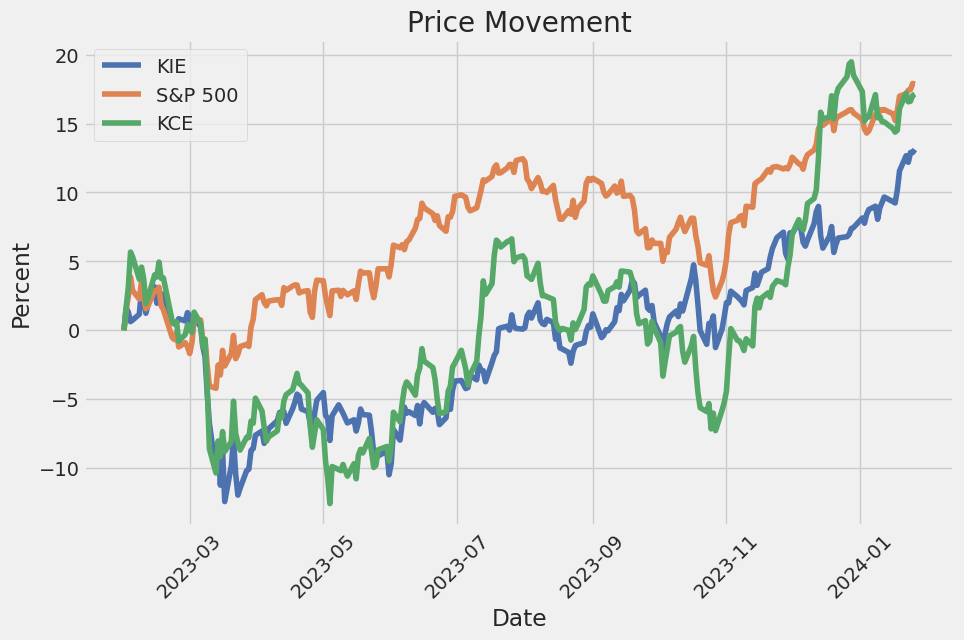
The linear regression analysis of KIE, an exchange-traded fund tracking insurance industry stocks, against SPY, which represents the broader S&P 500 market index, indicates a significant positive relationship with a coefficient (beta) of 1.0056. This suggests that KIE's returns exhibit a strong correlation with the performance of the SPY. This can be seen from the very low p-value for KIE's beta coefficient. A beta figure greater than 1 implies that KIE tends to move more than SPY for a given market move, and the R-squared value of 0.678 informs us that a substantial portion of KIE's movements can be explained by the movements in SPY. However, when focusing on the alpha of the model, which stands at -0.006641349489180255, we observe that it is slightly negative. Although the alpha is not statistically significant given its high p-value (0.797), it suggests that after accounting for market movements, KIE has underperformed the market by a small margin.
In evaluating investment performance, alpha represents the excess returns of an investment relative to the benchmark provided by SPY. In this case, KIE's negative alpha indicates that it has not managed to outperform the market average on a risk-adjusted basis during the period under consideration. This underperformance is minimal and statistically insignificant in the context of this regression analysis. Furthermore, the confidence intervals for alpha span from -0.057 to 0.044 which includes 0, indicating there is uncertainty about the estimated alpha value. The analysis also reports an F-statistic of 2639, showing the overall significance of the regression model, and the standard errors for alpha and beta coefficients indicate the precision of these estimates.
The SPDR S&P Insurance ETF (KIE) has established itself as a notable option for investors looking to gain exposure to the U.S. insurance industry. As we navigate through the challenging landscape that confronts global economies and markets, this ETF aims to follow the S&P Insurance Select Industry Index, a benchmark that captures the performance of the insurance sector within the U.S. financial landscape. In doing so, it opens a gateway for investors to partake in an industry that has displayed steadfast vigor and resilience.
The attractiveness of KIE lies in its targeted sector approach. By encompassing a broad array of insurance-related companies, from property and casualty insurers to life and health insurers, it serves as a conduit for investors to engage with a segment that is undergoing dynamic transformation. The insurance sector, by virtue of regulatory changes, technological advancements, and evolving consumer behavior, is in a phase where adaptability and innovation are key to sustaining momentum.
In recent times, the insurance industry has benefited from a favorable economic backdrop that includes significant premium increases, better control over claims cost growth, and more propitious investment returns. These factors have woven together to yield promising profitability metrics for the sector. An overview of performance reveals that KIE and its underlying index have achieved commendable results in comparison to broader financial indices.
| company | symbol | percent |
|---|---|---|
| Lincoln National Corp | LNC | 2.48 |
| Erie Indemnity Co Class A | ERIE | 2.45 |
| Fidelity National Financial Inc | FNF | 2.44 |
| Unum Group | UNM | 2.36 |
| The Travelers Companies Inc | TRV | 2.35 |
| Principal Financial Group Inc | PFG | 2.34 |
| First American Financial Corp | FAF | 2.33 |
| American International Group Inc | AIG | 2.31 |
| Markel Group Inc | MKL | 2.31 |
| MetLife Inc | MET | 2.31 |
One of the promising aspects of KIE stems from its holdings, which are well-positioned to capitalize on industry trends. As seen in the table titled "Top Ten Holdings," companies like Lincoln National Corp and Erie Indemnity Co Class A hold leading positions in KIE's portfolio, signifying a balance between well-established firms and potential growth opportunities, ultimately presenting a diversified investment panorama.
Zooming into the details of the ETF's performance, as of the latest available data, the S&P Insurance Select Industry Index noted an 8.54% increase over the trailing twelve months leading up to January 17th, 2024. It bears mentioning that such figures have outshone those of the S&P 500 Financials Index, thereby emphasizing the strength and viability of the insurance sector.
Financial analysis suggests that the insurance industry is poised to enjoy robust growth in the coming years. Forecasted return on equity figures point to a significant rise from the historical 5% recorded in 2023 to potential levels of 9.5% in 2024 and even 10% in 2025. This buoyant expectation aligns with projected escalations in premium growth coupled with a moderating inflationary environment.
The industry is not just witnessing positive projections on financial returns but also on operational efficiency markers such as the combined ratio. With an anticipated combined ratio hovering around the 98.5% mark for 2024 and 2025, the underwriting profit improvement from the estimated 103% in 2023 is yet another indicator of the sector's robust health.
When it comes to earnings, the insurance industry stands out within the financial sectors. Data from Factset demonstrates a projected impressive earnings growth, which indicates that sub-industries including property & casualty, reinsurance, and multi-line insurance are primed to underpin much of this development.
Beyond KIE, investors have access to a variety of insurance ETFs, including the likes of iShares U.S. Insurance ETF (IAK) and Invesco KBW Property & Casualty Insurance ETF (KBWP). These alternatives extend the gamut for investment strategies within distinct segments of the insurance industry.
A snapshot of KIE's performance showcases a 6.78% gain over the three-month period preceding the current date and a year-on-year increase of 12.12%, a testament to its standing among insurance ETFs. With an asset base exceeding $700 million, KIE's concentration in property and casualty, as well as life and health insurance, reaffirms its commitment to mirroring the dynamics of the insurance industry.
In conclusion, the SPDR S&P Insurance ETF delivers a compelling venue for investors to channel funds into an industry buoyed by positive trends and promising forecasts. The information presented here reflects the research and insights from Zacks.com as of January 23, 2024, which substantiates the momentum seen in the insurance sector. Investors can access the full report on Zacks.com through the following link: Tap Into the Insurance Industry's Momentum With These ETFs.
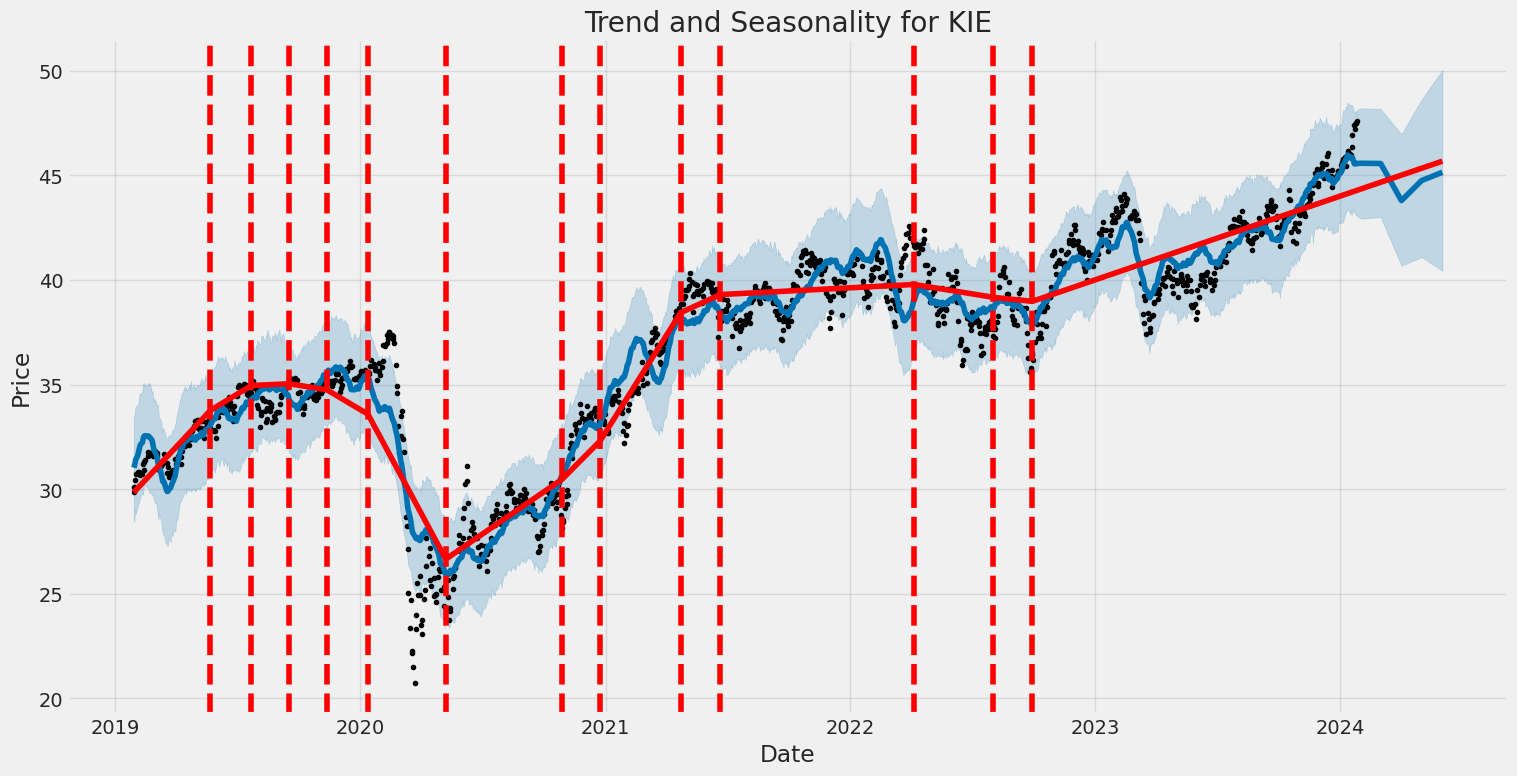
The SPDR S&P Insurance ETF (KIE) exhibited significant fluctuations between January 2019 and January 2024, as indicated by its volatility measures. The Omega () coefficient was 1.0808, suggesting that there's a base level of volatility inherent in the ETF's returns, while the Alpha () coefficient of 0.6212 points to past returns having a substantial impact on its future volatility. This reflects the ETF's tendency to show considerable variability in its performance over time, which could affect investment decisions for those sensitive to market swings.
Here is an HTML table summarizing the volatility characteristics:
| Statistic Name | Statistic Value |
|---|---|
| coef () | 1.0808 |
| std err | 0.09961 |
| t () | 10.850 |
| P>|t| () | <0.00001 |
| 95% Conf. Int. Lower () | 0.886 |
| 95% Conf. Int. Upper () | 1.276 |
| alpha[1] | 0.6212 |
| std err ([1]) | 0.106 |
| t ([1]) | 5.833 |
| P>|t| ([1]) | <0.00001 |
| 95% Conf. Int. Lower ([1]) | 0.412 |
| 95% Conf. Int. Upper ([1]) | 0.830 |
This table only represents a selection of the volatility model's statistics, emphasizing the main coefficients and their respective confidence intervals, which are pivotal for understanding the volatility of the SPDR S&P Insurance ETF.
To thoroughly evaluate the financial risk associated with a $10,000 investment in the SPDR S&P Insurance ETF (KIE) over one year, employing volatility modeling in tandem with machine learning predictions proves instrumental.
Volatility modeling is critical in understanding market uncertainty associated with the insurance ETF's stock fluctuations. Specifically, this statistical approach captures the persistence of volatility clustering, where periods of high volatility tend to follow periods of high volatility and vice versa. Through this methodology, the changing variance of the ETF's returns is captured effectively, aiding in the assessment of the risk profile over the investment horizon.
Machine learning predictions are leveraged to forecast future performance based on historical data. The specific use of the machine learning algorithm in the analysis serves to predict future stock returns by identifying complex patterns and relationships within the dataset that may not be evident using traditional statistical methods. This predictive power, when combined with volatility estimates, enhances the precision of future risk assessments.
The focus of the assessment is on the Value at Risk (VaR), which quantifies the potential loss of the investment. For this ETF, the calculated VaR with a 95% confidence interval suggests that there's only a 5% chance that the investment will lose more than $167.71 over the one-year period.
In the context of the SPDR S&P Insurance ETF, fusing volatility modeling and machine learning predictions provides a robust framework for estimating potential financial risk, factoring in both the volatility patterns of the ETF and the predictive insights into its future price movements. This integrated approach delineates the limits within which the investment is expected to fluctuate, under normal market conditions, alerting investors to the buffer they might need to maintain for downside risks.
Similar Companies in None:
SPDR S&P Capital Markets ETF (KCE), iShares U.S. Insurance ETF (IAK), SPDR S&P Bank ETF (KBE), iShares U.S. Broker-Dealers & Securities Exchanges ETF (IAI), SPDR S&P Pharmaceuticals ETF (XPH), Allstate Corporation (ALL), American International Group, Inc. (AIG), The Travelers Companies, Inc. (TRV), Prudential Financial, Inc. (PRU), MetLife, Inc. (MET), Report: Chubb Limited (CB), Chubb Limited (CB), Progressive Corporation (PGR), Aflac Incorporated (AFL), Hartford Financial Services Group, Inc. (HIG), Lincoln National Corporation (LNC)
https://seekingalpha.com/article/4664575-kie-etf-caution-dividend-yield-dips-to-decade-low
Copyright © 2024 Tiny Computers (email@tinycomputers.io)
Report ID: JDaJELu
Cost: $0.15422
https://reports.tinycomputers.io/KIE/KIE-2024-01-28.html Home