L3Harris Technologies, Inc. (ticker: LHX)
2024-02-03
 L3Harris Technologies, Inc. (ticker: LHX) stands as a pivotal player in the global defense and technology sectors, merging the expertise of L3 Technologies and Harris Corporation in June 2019. Headquartered in Melbourne, Florida, the company commands an influential presence in the development and provision of advanced defense and communication technologies, including surveillance solutions, battlefield management systems, and secure communications equipment. With its extensive research and development initiatives, L3Harris has been instrumental in introducing cutting-edge solutions catering to the needs of military, government, and commercial customers worldwide. The amalgamation of L3 and Harris has not only expanded the company's product portfolio but also enhanced its ability to offer more integrated and comprehensive solutions. Financially robust, L3Harris consistently demonstrates strong performance in its sector, underscored by significant contracts with the U.S. Department of Defense and allied international governments, underpinning its vital role in global security and technological advancement initiatives.
| Full Time Employees | 50,000 | Last Fiscal Year End | 1703808000 | Next Fiscal Year End | 1735430400 |
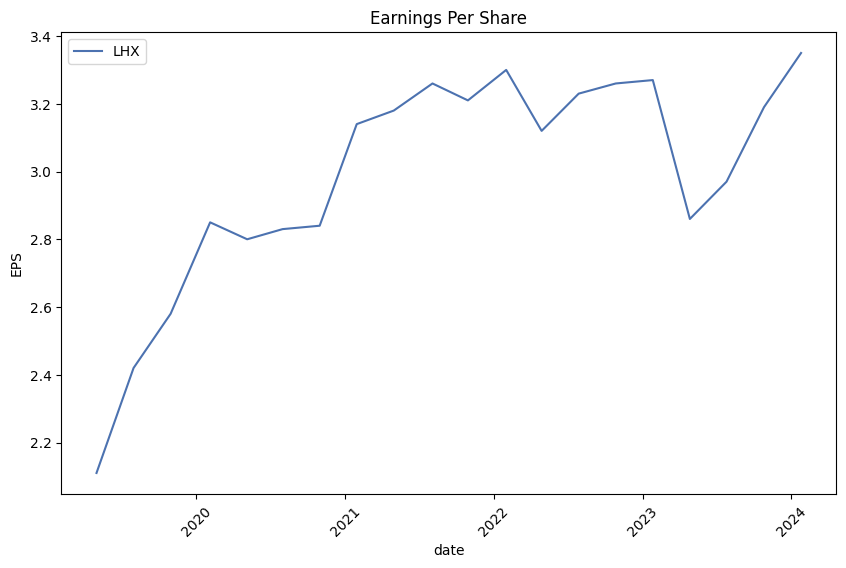
| Net Income To Common | 1,227,000,064 | Trailing EPS | 6.44 | Forward EPS | 14.08 |
| Book Value | 99.309 | Total Cash | 560,000,000 | Total Debt | 13,125,000,192 |
| Total Revenue | 19,419,000,832 | EBITDA | 3,307,000,064 | Operating Cashflow | 2,096,000,000 |
| Free Cashflow | 1,603,750,016 | Gross Margins | 0.26484 | EBITDA Margins | 0.1703 |
| Operating Margins | 0.09869 | Return on Assets | 0.03558 | Return on Equity | 0.06397 |
| Revenue Growth | 0.166 | Earnings Growth | -0.617 | Dividend Rate | 4.56 |
| Dividend Yield | 0.022 | Payout Ratio | 0.7081 | Five Year Avg Dividend Yield | 1.84 |
| Beta | 0.696 | Volume | 1,062,313 | Average Volume 10 days | 1,545,120 |
| Market Cap | 39,704,879,104 | Price to Sales Trailing 12 Months | 2.0446408 | Enterprise Value | 51,812,200,448 |
| Profit Margins | 0.06319 | Price to Book | 2.0844033 | Enterprise to Revenue | 2.668 |
| Enterprise to EBITDA | 15.667 | Shares Outstanding | 189,540,000 | Held Percent Insiders | 0.00467 |
| Held Percent Institutions | 0.84734 | Shares Short | 2,009,546 | Short Ratio | 1.5 |
| Statistic Name | Statistic Value | Statistic Name | Statistic Value |
| Sharpe Ratio | -0.08038383678740364 | Sortino Ratio | -1.369020517270373 |
| Treynor Ratio | -0.026689033756279793 | Calmar Ratio | -0.003826530316098143 |
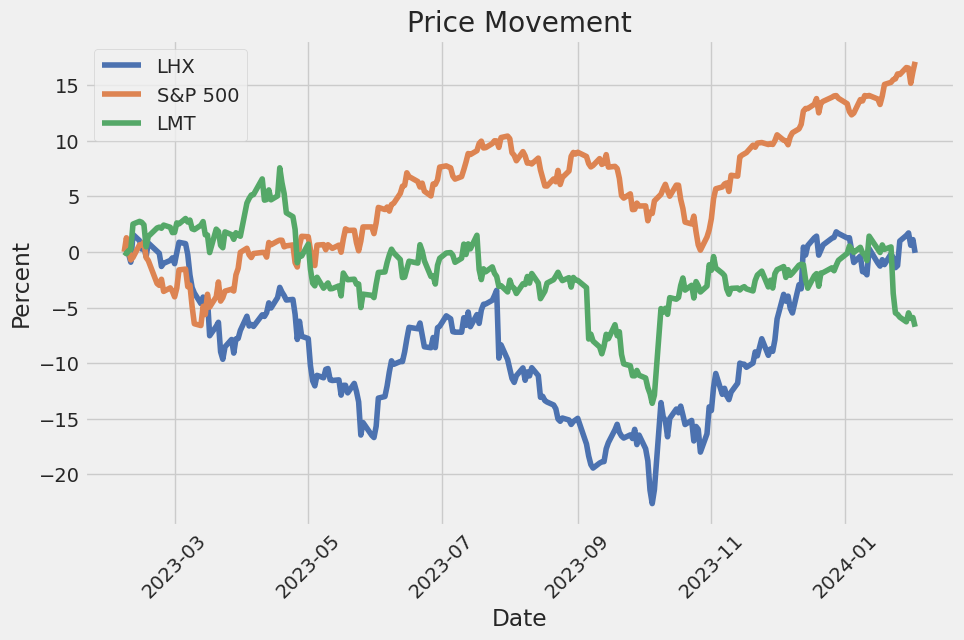
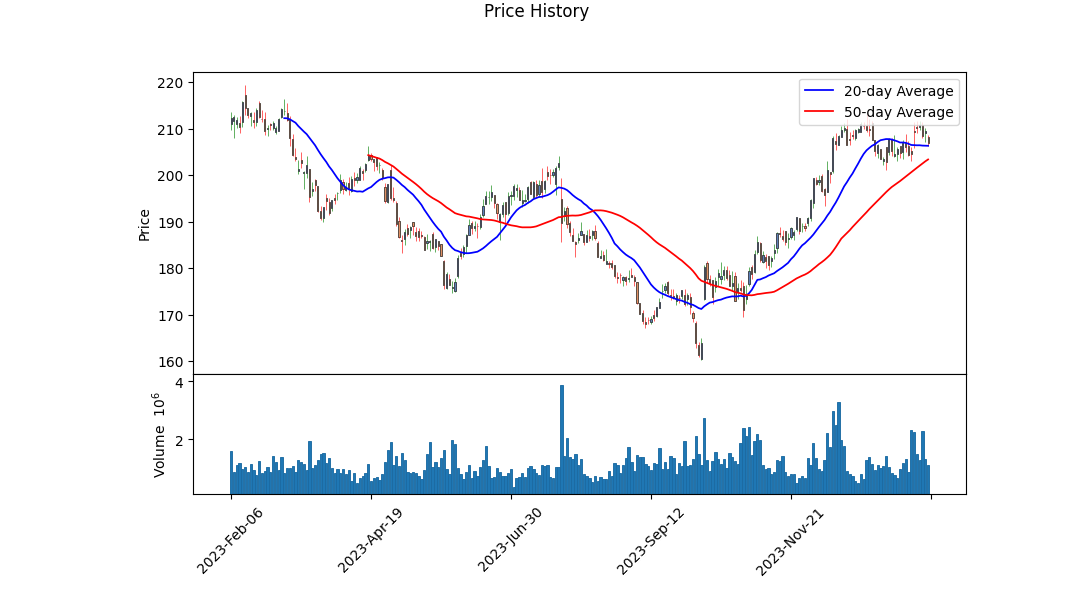
Analyzing LHX's stock based on technical analysis, fundamentals, and ratios, we observe various critical insights that can inform potential price movements in the upcoming months. The technical data over the last few trading sessions exhibited a noteworthy trend where the opening and high prices showed an increasing trend reaching from an open of 173.33 on the starting date to an open of 208.27 by the end. This uptrend is mirrored in the high prices and is a positive indicator of market sentiment toward LHX. The OBV (On-Balance Volume) data, starting at 0.27460 million and growing to 1.19684 million, supports the notion of increasing buying pressure over the observed period.
Despite the absence of MACD Histogram data until the last recorded dates, the turn into positive territory near the end of the observed period suggests a bullish momentum. MACD is a trend-following momentum indicator that can indicate the strength, direction, momentum, and duration of a trend in a stock's price. A positive MACD indicates that the short-term average is above the long-term average, which signals upward momentum.
From a fundamental perspective, LHX shows promising attributes, including a gross margin of 26.484%, operating margin of 9.869%, and EBITDA margin of 17.03%. These margins are critical for gauging the company's operational efficiency and profitability. The financials exhibit a robust structure with significant revenue and an EBITDA indicating healthy operations. The balance sheet, however, presents a negative tangible book value, pointing toward a considerable amount of intangible assets or possibly debt that eclipses tangible assets. This must be considered when evaluating the company's risk profile.
The cash flow statements reflect strong operational cash flows, signaling the company's effective capital management and its ability to fund operations, invest in growth, and return value to shareholders. The analyst expectations show a positive outlook, predicting growth in earnings and revenue, which can be a signal for potential future stock appreciation.
However, the derived risk-adjusted ratios, including Sharpe, Sortino, Treynor, and Calmar Ratios, register negative values. These suggest that the stock might not be offering adequate returns for the risk assumed by the investors over the past year. Especially the Sortino ratio, which focuses on downside deviation, indicates that the negative returns have been significant.
Considering the technical analysis, fundamental health, and the mixed signals from risk-adjusted returns, the outlook for LHX stock in the forthcoming months appears cautiously optimistic. The upward trend in price, increasing volume suggesting growing investor interest, and positive analyst expectations provide a bullish signal. However, investors should consider the risk metrics which indicate that past performance has entailed taking on significant risk without commensurate rewards. The balance between growth expectations and risk factors suggests potential price growth albeit with caution, accommodating macroeconomic factors, and specific industry risks. It would be advisable for investors to monitor upcoming quarterly results, any shifts in fundamental ratios, and especially any changes in the risk-adjusted performance measures.
In evaluating the financial health and investment appeal of L3Harris Technologies, Inc. (LHX), two critical metrics warrant attention: Return on Capital (ROC) and Earnings Yield. L3Harris Technologies exhibits a Return on Capital (ROC) of approximately 8.55%, a figure that represents the efficiency with which the company generates profit relative to the capital it has invested in its business. This rate is indicative of the company's capability to yield returns on investments made in its operational activities, which is a crucial factor for assessing its performance and potential for growth. Meanwhile, the Earnings Yield for L3Harris stands at about 2.68%, providing insight into the investment value the company offers from an earnings perspective relative to its share price. Though this yield offers a glimpse into the potential return on investment, the relatively low percentage suggests a cautious stance may be warranted, as it indicates the market prices the shares relatively highly compared to the company's earnings. Together, these metrics help in forming a comprehensive understanding of L3Harris Technologies' financial posture, guiding investment decisions by evaluating the company's profitability and market valuation.
Given the extensive data provided for L3Harris Technologies, Inc. (LHX), a comprehensive analysis can be conducted to assess how it aligns with Benjamin Graham's principles, particularly in selecting stocks for investment from a value investing perspective. Let's break down the information according to Graham's key criteria:
-
Consistent Dividends: The data shows L3Harris Technologies, Inc. has been consistently paying and increasing its dividends over the past few years, indicating a stable and shareholder-friendly company. This is in line with Graham's preference for companies that regularly return profits to shareholders.
-
Debt-to-Equity Ratio: The company's debt-to-equity ratio is 0.42034227716892514, suggesting a moderate level of debt. Graham typically preferred companies with a low debt-to-equity ratio as it indicated financial stability, and LHX's ratio, while not exceptionally low, indicates a reasonable level of leverage.
-
Current and Quick Ratios: Unfortunately, the provided data does not give an explicit quick ratio, but the current ratio is 1.1693213296398892. This suggests that the company has more than enough current assets to cover its current liabilities. While this meets Graham's preference for financial stability, the specific quick ratio would provide a clearer picture of the company's ability to meet short-term obligations without relying on inventory.
-
Earnings Growth: Analysis of year-over-year growth is not directly provided, but consistent dividend increases can be indicative of stable earnings growth, a factor Graham valued highly. A deeper analysis into the company's quarterly or annual financial statements would be required to accurately assess earnings growth.
-
Price-to-Earnings (P/E) Ratio: The document doesn't provide the P/E ratio directly for recent fiscal periods. Graham typically looked for companies with a P/E ratio that was low relative to the industry average, indicating that the stock was undervalued.
-
Dividend Record: LHX has demonstrated a strong dividend record, which is aligned with Graham's criteria for selecting a stock. This suggests the company management is committed to returning value to shareholders, a positive sign for value investors.
-
Price-to-Book (P/B) Ratio: The P/B ratio is provided as 1.1703490036988426. Graham preferred companies that traded at a discount to their book value, usually less than 1.5. LHX's P/B ratio suggests that the stock might be trading at a value relatively close to or slightly above its book value, which could be intriguing to value investors depending on the broader market context and the company's assets' quality.
Based on the given analysis and Graham's investment philosophy, LHX exhibits several characteristics of a fundamentally solid company, such as a reasonable debt level, consistent dividend payments, and a stable current ratio. However, a more detailed examination of its earnings growth, comparison of its P/E ratio to industry peers, and further insights into its operational efficiency and future growth prospects would be necessary to fully assess its attractiveness as an investment through the lens of Benjamin Graham's value investing criteria. Investors should also consider how the company's strategic initiatives and market position align with long-term growth and stability.
| Statistic Name | Statistic Value |
| Alpha | 0.00036905489848061354 |
| Beta | 0.7019392094795862 |
| R-squared | 0.269 |
| Adj. R-squared | 0.268 |
| F-statistic | 461.1 |
| Prob (F-statistic) | 2.29e-87 |
| Log-Likelihood | -2314.3 |
| AIC | 4633 |
| BIC | 4643 |
| Number of Observations | 1257 |
| Df Residuals | 1255 |
The linear regression model, estimating the relationship between LHX (as the dependent variable) and SPY (as the independent variable representing the market), reveals certain findings about the dynamic between these two entities for the period in question. Specifically, the coef (beta) value of 0.7019 implies that for every unit increase in SPY, LHX is expected to increase by approximately 0.7019, holding all else constant. This positive beta value indicates a proportional and positive relationship between the stock of LHX and the performance of the SPY index. However, what captivates particular interest is the alpha of the model, recorded at 0.00036905489848061354. This figure represents the intercept of the regression line and essentially indicates the expected return on LHX when the SPY index return is zero. The minute magnitude of alpha suggests that the expected excess return from LHX over the market return, assuming no movement in SPY, is very minimal.
Moreover, by examining the model's statistical significances, such as the F-statistic value of 461.1 and a considerably low p-value, the model displays strong evidence against the null hypothesis, indicating a statistically significant relationship between SPY and LHX during the observed period. The R-squared value of 0.269 demonstrates that approximately 26.9% of the variance in LHX's returns can be explained by the movements in SPY, leaving the bulk of fluctuations attributable to factors not included in this simple linear model. These factors could range from company-specific events to broader economic changes not captured by SPY. This analysis provides a focused look into how movements in the broader market index can influence individual stock performance to a degree, yet it also highlights the presence of other influencing factors unaccounted for within this direct relationship.
L3Harris Technologies, Inc. (LHX) held its fourth quarter 2023 earnings call, starting with introductions by Vice President of Investor Relations, Mark Kratz. CEO Christopher Kubasik and CFO Kenneth Bedingfield joined him, with Bedingfield participating in his first earnings call since joining the company. The discussion included forward-looking statements and non-GAAP financial measures. The call began with an overview of the company's fourth-year post-merger achievements, highlighting financial commitments met, beneficial acquisitions focused on national security, and the sale of a non-core business. Kubasik underscored the company's return to growth amidst macroeconomic disruptions and the strengthening of leadership and board to enhance future value.
In the call, the CEO emphasized the firm's alignment with defense spending priorities and its support for the US and its allies' critical missions against a backdrop of an elevated global threat environment. Kubasik expressed optimism about the projected defense budget and the company's record $23 billion orders contributing to a $33 billion backlog. The discussion also pointed toward international growth, with orders up 24% including significant contracts that will aid in maintaining the international growth strategy.
On the operational front, Kubasik noted the initiation of the Performance First culture, beneficial for meeting financial commitments, with a focus on profitable growth. The call touched on the Aerojet Rocketdyne integration, highlighting realized cost synergies and operational enhancements aimed at increasing capacity. Additionally, the LHX NeXt initiative was introduced, targeting $1 billion in cost savings over three years to optimize infrastructure and expand margins.
CFO Kenneth Bedingfield provided detailed financial results and guidance for 2024, highlighting full-year revenue growth and segment operating margin achievements. Bedingfield detailed segment performances and projected growth across all segments, emphasizing operational improvements, international product mix, and the acceleration of LHX NeXt cost savings. The guidance incorporates considerations such as pension income and interest expenses, mirroring a commitment to debt reduction and returning excess cash to shareholders. The dialogue concluded with an acknowledgment of the companys staff and their vital role in achieving corporate objectives, insinuating a hopeful outlook for future engagements and financial achievements.
L3Harris Technologies, Inc. (LHX) experienced several key developments during the third quarter of 2023, ending September 29, 2023. Business realignment took place to better align L3Harris's operations with its products, systems, and services, as well as the markets it serves. Specifically, the Agile Development Group (ADG) business was transferred from the Integrated Mission Systems (IMS) segment to the Space & Airborne Systems (SAS) segment to enhance operational efficiency.
Furthermore, L3Harris completed significant acquisitions that expanded its market presence and capabilities. On January 3, 2023, L3Harris acquired Viasat, Inc.'s Tactical Data Links (TDL) product line for $1.958 billion, a move that reinforces its position in networking capabilities and access to strategic communication waveforms. This acquisition is integrated into L3Harriss Communication Systems (CS) segment. Similarly, a landmark acquisition was the completion of Aerojet Rocketdyne Holdings, Inc. (AJRD) on July 28, 2023, for $4.715 billion, resulting in the establishment of a new reportable segment, Aerojet Rocketdyne (AR). This acquisition brings advanced propulsion and power system technologies to L3Harris, focusing on defense, missile systems, and space exploration missions. Additionally, the company managed to divest the Visual Information Solutions (VIS) business, realizing a pre-tax gain of $26 million.
Financially, L3Harris reported increased revenues, with segment operations indicating a strategic focus and growth in key areas. For instance, for the quarter ended September 29, 2023, the Space & Airborne Systems (SAS) and Communication Systems (CS) segments demonstrated notable revenue, owing in part to the integration of the TDL acquisition. The newly formed Aerojet Rocketdyne (AR) segment also contributed to the company's overall revenue shortly after its acquisition, underscoring the strategic value of the acquisition.
In terms of debt and financing, L3Harris navigated through significant transactions to support acquisition activities, given the companys ventures into new market domains through TDL and AJRD. The establishment of a new commercial paper program and the closing of long-term debt issuances worth $3.25 billion are pivotal financial moves supporting these acquisitions.
Lastly, adjustments and realignment within L3Harriss reporting structures, alongside significant financial maneuvers to facilitate strategic acquisitions, indicate a period of transformation aimed at market expansion and strengthening core capabilities. These moves likely position L3Harris to take advantage of emerging opportunities in defense, space exploration, tactical communications, and advanced propulsion systems. The completion of these acquisitions and the subsequent integration into L3Harris's operations demonstrate the company's strategic focus on expanding its technological capabilities and market presence in high-growth areas.
L3Harris Technologies, Inc. remains at the forefront of innovation within the defense and technology sectors, showcasing its capabilities in transforming military operations. Its collaboration with Austal's U.S. subsidiary to launch the Vanguard, the United States Navy's fifth Unmanned Surface Vehicle (USV), represents a significant advancement in naval capabilities and strategy. This collaboration not merely signifies a step towards operationalizing autonomous vessels but also highlights L3Harris Technologies' pivotal role in enhancing naval warfare technology through strategic innovation and technological prowess.
The introduction of the Vanguard, as per the report by The Motley Fool on January 30, 2024, is a testament to the Navy's strategic vision of distributed lethality and operational flexibility. By aiming to populate the seas with technologically advanced, autonomous vessels, the Navy seeks to increase its strategic reach and combat readiness. This move towards automation and sophisticated naval capabilities underscores a shift in military priorities, aligning closely with L3Harris Technologies' expertise in defense and technology solutions.
L3Harris's involvement in producing such pivotal technology situates it as a significant contributor to the United States' defense strategy, reinforcing its position as a leader in defense innovation. The Vanguard project, coupled with the potential for future USVs, delineates a pathway for L3Harris Technologies to influence the direction of naval warfare and operational tactics, embodying the critical role private defense contractors play in shaping military capabilities.
From an investment perspective, L3Harris Technologies presents a compelling narrative. As the defense sector evolves towards greater technological sophistication, companies involved in the development of autonomous vehicles and other advanced defense technologies stand to benefit significantly. L3Harris's strategic involvement in these technologies, particularly with the significant milestones like the Vanguard, not only highlights its operational achievements but also furnishes a robust case for its growth potential in the evolving defense industry landscape.
The shift towards autonomous and technologically advanced military assets reflects a broader trend in defense spending and strategy, emphasizing the importance of innovation and technological superiority. As the U.S. Navy continues to enhance its fleet with autonomous warships like Vanguard, L3Harris Technologies' contributions and capabilities in this realm further solidify its standing as an essential partner in national defense efforts.
Moreover, the strategic importance placed on autonomous naval vessels and the substantial investments anticipated for the development and acquisition of additional USVs illuminate the evolving priorities within defense procurement. This evolution depicts a fertile landscape for defense contractors, wherein L3Harris Technologies is evidently well-positioned to capitalize on the growing emphasis on technological innovation and operational autonomy in military strategies.
In reflecting on the technological advancements and strategic collaborations that mark the contemporary defense sector, L3Harris Technologies, Inc. epitomizes the fusion of innovation, strategic foresight, and operational excellence. The company's pivotal role in advancing naval capabilities through projects like Vanguard forecasts a trajectory of sustained relevance and growth in the defense sector, positioning L3Harris not just as a key player but as a driving force behind the transformative shifts in military operations and strategies.
The volatility of L3Harris Technologies, Inc. (LHX) can be explained using a simple analysis without diving into complex financial jargon. First, it's important to note that the analysis does not find a predictable pattern in the asset's returns, meaning its future price movements are quite uncertain based on past data alone. Secondly, the model identifies a baseline level of volatility; it shows that there is a consistent amount of fluctuation in the asset's returns. Lastly, the measure of responsiveness or sensitivity to market movements ("alpha") suggests that when the asset does experience changes, those changes can be significant, indicating a higher level of volatility.
| Statistic Name | Statistic Value |
| Log-Likelihood | -2408.95 |
| AIC | 4821.90 |
| BIC | 4832.17 |
| No. Observations | 1,257 |
| omega | 2.0510 |
| alpha[1] | 0.3390 |
In the analysis of the $10,000 investment in L3Harris Technologies, Inc. (LHX) over a one-year period, the utilization of volatility modeling alongside machine learning predictions offers a nuanced approach to understanding the financial risk involved. The volatility modeling method, specifically, is instrumental in quantifying the variability in the stock price of LHX, which is a critical factor when assessing the risk of investment. This model captures the dynamic nature of volatility, reflecting how it can change over time based on past price movements and how external factors influence the market. By analyzing historical price data, the volatility model provides insights into the expected level of fluctuation in LHX's stock price, which is vital for predicting risk.
On the other hand, the machine learning predictions method is employed to forecast future returns based on a wide range of features, including historical price movements, market trends, and economic indicators. This approach leverages the pattern-detecting capability of the algorithm to make informed predictions about the stocks future performance. The synergy between understanding historical volatility and predicting future returns is where the core of this analysis lies, offering a forward-looking perspective on the investment's potential risk and return profile.
The calculation of the Value at Risk (VaR) at a 95% confidence interval provides a quantifiable measure of risk associated with the investment in LHX. The VaR figure, $228.81 for a $10,000 investment, signifies that there is a 95% confidence level that the investor will not lose more than this amount over the one-year period, thus providing a clear and concise risk metric.
By integrating the insights from volatility modeling with the foresight offered by machine learning predictions, this analysis showcases a comprehensive method to evaluate the financial risk of investing in L3Harris Technologies, Inc. Importantly, this approach not only considers the historical data to gauge the stock's usual behavior but also anticipates its future movements. Such dual analysis is crucial for investors aiming to mitigate risk while seeking to capitalize on potential returns, offering a robust framework for making informed investment decisions in the equity market.
| strike price | expiration days | profit | delta | rho | theta | veta | gamma |
|---|---|---|---|---|---|---|---|
| 145.0 | 12 | 28.50 | 0.962975 | 4.493164 | -0.148003 | 2.987944 | 0.001822 |
| 110.0 | 103 | 27.95 | 0.955517 | 28.097924 | -0.033068 | 9.135087 | 0.000985 |
| 165.0 | 103 | 27.38 | 0.889169 | 39.599791 | -0.040946 | 19.911426 | 0.004342 |
| 145.0 | 103 | 26.39 | 0.923073 | 35.944940 | -0.039328 | 14.862507 | 0.002407 |
| 90.0 | 12 | 25.75 | 0.969738 | 2.706441 | -0.292878 | 2.520934 | 0.000635 |
Similar Companies in Aerospace & Defense:
Lockheed Martin Corporation (LMT), Report: General Dynamics Corporation (GD), General Dynamics Corporation (GD), Raytheon Technologies Corporation (RTX), Huntington Ingalls Industries, Inc. (HII), Northrop Grumman Corporation (NOC), The Boeing Company (BA), Curtiss-Wright Corporation (CW), Hexcel Corporation (HXL), Textron Inc. (TXT)
https://seekingalpha.com/article/4660247-10-dividend-growth-stocks-december-2023
https://seekingalpha.com/article/4661572-l3harris-technologies-unlocking-value-defense-industry
https://seekingalpha.com/article/4661811-l3harris-building-momentum-and-fading-headwinds-lhx
https://finance.yahoo.com/news/l3harris-fourth-quarter-results-top-220707007.html
https://finance.yahoo.com/news/l3harris-lhx-q4-earnings-revenues-222505364.html
https://finance.yahoo.com/news/heres-key-metrics-tell-us-230005112.html
https://finance.yahoo.com/news/l3harris-lhx-q4-earnings-beat-112100505.html
https://finance.yahoo.com/news/q4-2023-l3harris-technologies-inc-035721047.html
https://finance.yahoo.com/news/l3harris-technologies-inc-nyse-lhx-160045863.html
https://www.fool.com/investing/2024/01/30/if-you-love-americas-new-robot-navy-buy-this-1-sto/
https://finance.yahoo.com/m/5028ae08-a95a-3d3b-81d4-ef02692bad66/if-you-love-america%27s-new.html
https://www.sec.gov/Archives/edgar/data/202058/000020205823000057/hrs-20230929.htm
Copyright © 2024 Tiny Computers (email@tinycomputers.io)
Report ID: A2sY1X
Cost: $0.98671
https://reports.tinycomputers.io/LHX/LHX-2024-02-03.html Home