Monster Beverage Corporation (ticker: MNST)
2024-05-16
 Monster Beverage Corporation (NASDAQ: MNST) is a leading American beverage company known for its energy drinks, which include the flagship Monster Energy line. Founded in 1935 as Hansen Natural Corporation, the company shifted its focus in 2002 to the burgeoning energy drink market, a move that has led to substantial growth and global brand recognition. Headquartered in Corona, California, Monster Beverage has expanded its product portfolio to include a variety of energy beverages, utilizing aggressive marketing strategies and high-profile sponsorships in sports, music, and gaming. The company reported robust financial performance with significant increases in net sales and operating income in recent years. Monster Beverage continues to innovate with new product launches and expansion into international markets, aiming to consolidate its position as one of the dominant players in the energy drink industry.
| Full-time Employees | 5,254 | Previous Close | 54.48 | Open | 54.51 |
| Day Low | 54.12 | Day High | 54.635 | Regular Market Previous Close | 54.48 |
| Regular Market Open | 54.51 | Regular Market Day Low | 54.12 | Regular Market Day High | 54.635 |
| Beta | 0.735 | Trailing P/E Ratio | 34.329113 | Forward P/E Ratio | 26.719213 |
| Volume | 5,434,561 | Regular Market Volume | 5,434,561 | Average Volume | 5,698,939 |
| Average Volume (10 days) | 7,616,010 | Average Daily Volume (10 Day) | 7,616,010 | Bid | 51.59 |
| Ask | 54.25 | Bid Size | 100 | Ask Size | 300 |
| Market Capitalization | 57,106,583,552 | 52 Week Low | 47.13 | 52 Week High | 61.23 |
| Price to Sales (Trailing 12 Months) | 7.779982 | 50 Day Average | 56.4332 | 200 Day Average | 55.58115 |
| Enterprise Value | 53,254,537,216 | Profit Margins | 0.22828 | Float Shares | 758,367,733 |
| Shares Outstanding | 1,048,230,016 | Shares Short | 13,273,296 | Shares Short Prior Month | 14,178,399 |
| Shares Percent of Outstanding | 0.0127 | Held Percent Insiders | 0.26832 | Held Percent Institutions | 0.68598 |
| Short Ratio | 2.32 | Short Percent of Float | 0.0176 | Implied Shares Outstanding | 1,052,849,984 |
| Book Value | 8.234 | Price to Book Ratio | 6.587321 | Earnings Quarterly Growth | 0.112 |
| Net Income to Common | 1,675,592,960 | Trailing EPS | 1.58 | Forward EPS | 2.03 |
| PEG Ratio | 2.27 | Last Fiscal Year End | 1703980800 | Next Fiscal Year End | 1735603200 |
| Most Recent Quarter | 1711843200 | Last Split Factor | 2:1 | Last Split Date | 1679961600 |
| Enterprise to Revenue | 7.255 | Enterprise to EBITDA | 24.864 | 52 Week Change | -0.08667225 |
| S&P 52 Week Change | 0.26159418 | Last Dividend Value | 0.005208 | Last Dividend Date | 658022400 |
| Current Price | 54.24 | Target High Price | 69.0 | Target Low Price | 46.0 |
| Target Mean Price | 62.64 | Target Median Price | 63.0 | Total Cash | 3,560,724,992 |
| Total Cash Per Share | 3.418 | EBITDA | 2,141,847,040 | Total Debt | 61,907,000 |
| Quick Ratio | 4.01 | Current Ratio | 4.912 | Total Revenue | 7,340,194,816 |
| Debt to Equity Ratio | 0.722 | Revenue Per Share | 7.031 | Return on Assets | 0.13655 |
| Return on Equity | 0.20979999 | Free Cash Flow | 975,652,736 | Operating Cash Flow | 1,705,420,032 |
| Earnings Growth | 0.105 | Revenue Growth | 0.118 | Gross Margins | 0.53452 |
| EBITDA Margins | 0.2918 | Operating Margins | 0.28539 | Trailing PEG Ratio | 1.8813 |
| Sharpe Ratio | -0.552 | Sortino Ratio | -8.777 |
| Treynor Ratio | -0.155 | Calmar Ratio | -0.442 |
In reviewing Monster Beverage Corporation (MNST), we see a mixed indicative sentiment, underpinned by both strong fundamentals and some concerning technical and risk-adjusted return measures.
Fundamental Analysis
Monster Beverage Corporation's fundamentals paint a positive picture. The company enjoys robust margins (gross margin of 53.45%, EBITDA margin of 29.18%, and operating margin of 28.54%), reflecting strong operational efficiency. The trailing PEG ratio stands at an attractive 1.88, indicating that the stock might be undervalued relative to its growth prospects. Additionally, the Altman Z-Score of 25.36 and a Piotroski F-Score of 8 suggest financial stability and healthy operational efficiency. The company's revenue for the latest fiscal year is approximately $7.34 billion, with a hefty $4.8 billion in working capital and $10.1 billion in total assets.
Technical Analysis
A detailed examination of the latest technical indicators reveals a slightly bearish to neutral short-term outlook. The On-Balance Volume (OBV) shows a negative trend, indicating decreasing interest in the stock. In addition, the MACD histogram shows waning bullish momentum, with a decreasing value over the past few days.
Risk-Adjusted Performance
The risk-adjusted metrics sharply reflect underlying concerns. The Sharpe Ratio of -0.552 suggests that the returns generated by the stock have been insufficient to justify its risk, when compared to risk-free scenarios such as the ten-year Treasury yield. Similarly, the Sortino Ratio is highly negative at -8.777, underscoring that downside volatility heavily impacts returns.
The Treynor Ratio, at -0.155, reiterates a scenario where risk-adjusted performance lags significantly against the broader market risk, signaling inefficiency in exploiting systematic risk. Lastly, the Calmar Ratio at -0.442 highlights that the drawdown experienced by the stock exceeds its return expectations over the past year, which could be alarming for momentum and long-term investors alike.
Prediction for MNST's Stock Price Movement
Given the amalgamation of technical, fundamental, and performance data, MNST might exhibit a mixed trajectory in the upcoming months. The strong operational fundamentals and solid financial health serve as a buffer against extreme drops. However, negative technical indicators and risk-adjusted performance ratios indicate potential headwinds.
- Short-Term (1-3 months): Likely sideways to mild bearish movement. Strong support levels will likely find the price hovering between $54-$55 due to technical corrections.
- Medium-Term (3-6 months): Assuming the fundamentals strengthen and market sentiment improves, there's potential for a bullish recovery. Investors' reevaluation based on robust earnings might push prices back towards the $57-$60 range.
Overall, vigilant observation of further technical and macroeconomic indicators, coupled with periodic review of the financial health and earnings reports of MNST, is essential for a precise navigation of this stocks potential movement.
In evaluating Monster Beverage Corporation (MNST) using key metrics from "The Little Book That Still Beats the Market," we observe a Return on Capital (ROC) of approximately 22.91% and an earnings yield of about 2.88%. The ROC, a crucial indicator in the books strategy, reflects the company's efficiency in generating profits from its capital; MNSTs strong ROC of nearly 23% underscores its ability to effectively utilize its assets to generate substantial returns, indicating robust operational efficiency and profitability. Meanwhile, the earnings yield, a measure of the earnings generated from each dollar invested, stands at 2.88%. While this figure suggests that MNST may be trading at a higher valuation relative to its earnings, the companys high ROC may justify this premium valuation, as it signifies superior performance in deploying its capital to generate earnings. Together, these metrics highlight MNSTs promising growth potential, albeit investors might be paying a premium for such a high-performance asset.
In this research report, we'll evaluate Monster Beverage Corporation (MNST) against key metrics described in Benjamin Graham's investment principles from his seminal work, "The Intelligent Investor." Benjamin Graham, regarded as the father of value investing, suggested a range of financial metrics and ratios for assessing a company's intrinsic value and financial health. Here's how Monster Beverage Corporation measures up to Graham's criteria:
- Price-to-Earnings (P/E) Ratio:
- MNSTs P/E Ratio: 40.78
- Criteria: Graham favored companies with low P/E ratios relative to their industry peers because they indicate that the stock is potentially undervalued by the market.
-
Analysis: A P/E ratio of 40.78 is considerably higher than the general benchmarks Graham would have supported. Without industry P/E ratio data for comparison, it's difficult to gauge the context within its sector. However, a high P/E ratio typically suggests that the stock may be overvalued or that investors are expecting high future growth.
-
Price-to-Book (P/B) Ratio:
- MNSTs P/B Ratio: 5.87
- Criteria: Graham often sought companies trading below their book value (a P/B ratio less than 1).
-
Analysis: With a P/B ratio of 5.87, Monster Beverage Corporation is trading at a price substantially above its book value, suggesting that the market places a high value on the company relative to its actual net assets. This is contrary to Grahams preference for undervalued or conservatively valued stocks.
-
Debt-to-Equity Ratio:
- MNSTs Debt-to-Equity Ratio: 0.008
- Criteria: Graham preferred companies with low debt relative to equity to minimize financial risk.
-
Analysis: With a debt-to-equity ratio of just 0.008, Monster Beverage Corporation has exceptionally low leverage, aligning well with Grahams criterion and indicating a low financial risk. This suggests strong financial health and a conservative capital structure.
-
Current and Quick Ratios:
- MNSTs Current Ratio: 4.811
- MNSTs Quick Ratio: 4.811
- Criteria: These ratios assess a company's ability to meet its short-term liabilities with short-term assets. Graham would consider ratios above 2 as satisfactory for financial stability.
-
Analysis: Both the current ratio and quick ratio of 4.811 indicate substantial liquidity and the companys strong ability to cover short-term obligations. This comfortably exceeds Graham's thresholds, demonstrating financial stability and operational efficiency.
-
Earnings Growth:
- Criteria: Graham emphasized consistent earnings growth over time as a metric for long-term viability and intrinsic value.
- Analysis: Though specific earnings growth data for Monster Beverage Corporation is not provided in the given metrics, any deeper analysis should include a historical review of consistent earnings performance to align with Grahams standards.
Conclusion
While Monster Beverage Corporation exhibits exceptional financial strength in terms of debt and liquidity ratios, and thus aligns with some of Grahams key principles for financial stability, its high P/E and P/B ratios deviate notably from the conservative valuation principles of value investing that Graham advocated.
Investors following Grahams philosophy might approach Monster Beverage with caution, emphasizing the need for a comprehensive analysis beyond these metrics, particularly focusing on growth trajectory, market conditions, and potential intrinsic value reassessment.### Analyzing Financial Statements
Introduction to Financial Statement Analysis: In the realm of value investing, a meticulous examination of a company's financial statements is indispensable. The primary financial reports include the balance sheet, income statement, and cash flow statement. Benjamin Graham, the father of value investing, emphasized the importance of understanding a companys assets, liabilities, earnings, and cash flows. This approach helps investors gauge a companys financial health and intrinsic value.
Balance Sheet Analysis: The balance sheet provides a snapshot of a company's financial position at a specific point in time, detailing its assets, liabilities, and shareholders' equity. Lets delve into the balance sheet of Monster Beverage Corporation (MNST) as of March 31, 2024, to illustrate this analysis.
1. Assets: - Current Assets: $6.04 billion, which includes $2.58 billion in cash and cash equivalents, $1.37 billion in accounts receivable, $0.94 billion in inventory, $0.12 billion in prepaid expenses, and $0.04 billion in prepaid taxes. - Long-Term Assets: $4.04 billion, comprising $8.16 million in long-term investments, $0.92 billion in property, plant, and equipment (net), $1.76 billion in deferred income tax assets, $1.42 billion in goodwill, $1.43 billion in intangible assets (net), and $0.11 billion in other non-current assets.
2. Liabilities: - Current Liabilities: $1.23 billion, which includes $533.73 million in accounts payable, $204.68 million in accrued liabilities, $318.90 million in accrued promotional allowances, and $82.38 million in various other current liabilities. - Long-Term Liabilities: $354.65 million, consisting of $198.76 million in contract liabilities (non-current), $92.69 million in other non-current liabilities, and $63.20 million in various deferred revenues and commitments.
3. Shareholders' Equity: - Equity Components: Equity totals $8.58 billion, which includes $5.03 billion in additional paid-in capital, $6.38 billion in retained earnings, offset by $2.69 billion in treasury stock. - Common Stock: Common stock totals approximately $5.62 million (based on par value). - Comprehensive Income Adjustments: Accumulated other comprehensive income/loss is $-157.94 million.
Income Statement Analysis: The income statement demonstrates a companys performance over a specified period, highlighting its revenue, expenses, and profitability.
1. Revenue and Expenses: - Revenue: MNST reported $1.90 billion in revenue for Q1 2024. - Cost of Goods Sold (COGS): $872 million, resulting in a gross profit of $1.03 billion. - Operating Expenses: $485 million, leading to an operating income of $542 million. - Net Income: After accounting for other non-operating income ($35.75 million) and income tax expenses ($135.70 million), the net income available to common stockholders totals $442.05 million for Q1 2024.
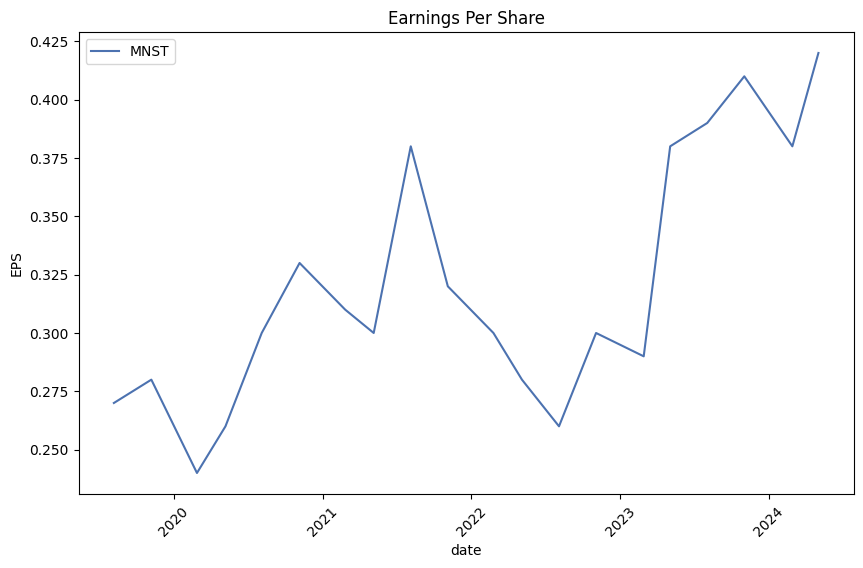
2. Earnings Per Share (EPS): - Basic and Diluted EPS: Both basic and diluted EPS for Q1 2024 are reported at $0.42, with weighted average shares outstanding of approximately 1.04 billion.
Cash Flow Statement Analysis: The cash flow statement reveals movements in cash over a period, split into operating, investing, and financing activities.
1. Operating Activities: - Net Cash Provided by Operations: $412 million for Q1 2024, reflecting strong operational profitability. - Key Adjustments: Includes non-cash expenses such as depreciation ($20.48 million) and share-based compensation ($22.47 million), and adjustments for changes in working capital items like accounts receivable and accrued liabilities.
2. Investing Activities: - Cash Used in Investing Activities: A net outflow of $35.32 million, mainly due to capital expenditures ($66.04 million) and payments for investments.
3. Financing Activities: - Cash Used in Financing Activities: Net outflow of $84.75 million, driven by repurchases of common stock ($120.25 million), partially offset by proceeds from stock issuance ($38.39 million).
Key Financial Metrics: - Liquidity Ratios: Examining the current ratio (current assets/current liabilities) and quick ratio (liquid assets/current liabilities) would provide insights into short-term financial stability. - Profitability Ratios: Gross margin (gross profit/revenue), operating margin (operating income/revenue), and net margin (net income/revenue) reflect the companys operational efficiency. - Leverage Ratios: Debt-to-equity ratio (total liabilities/shareholders' equity) helps evaluate financial leverage and long-term solvency.
Conclusion: Analyzing MNSTs financial statements reveals a robust financial position with solid revenue growth, profitability, and prudent cash flow management. The company demonstrates a healthy balance between growth and maintaining liquidity, which is essential for sustaining its competitive edge and delivering value to shareholders. Investors are encouraged to leverage these insights while considering their investment decisions in alignment with value investing principles championed by Benjamin Graham.### Dividend Record
In "The Intelligent Investor," Benjamin Graham emphasized the importance of investing in companies with a consistent history of paying dividends. According to Graham, a reliable dividend record is a sign of a company's financial health and management's commitment to returning value to shareholders.
For the company with the symbol 'MNST,' here is the available historical dividend record:
- Date: November 08, 1990
- Label: November 08, 90
- Adjusted Dividend: $0.005208
- Dividend: $0.5
- Record Date: November 07, 1990
- Payment Date: December 21, 1990
- Declaration Date: November 07, 1990
This data indicates that MNST has a history of dividend payment, which would be in line with Grahams criteria for evaluating the long-term reliability and financial stability of a company.
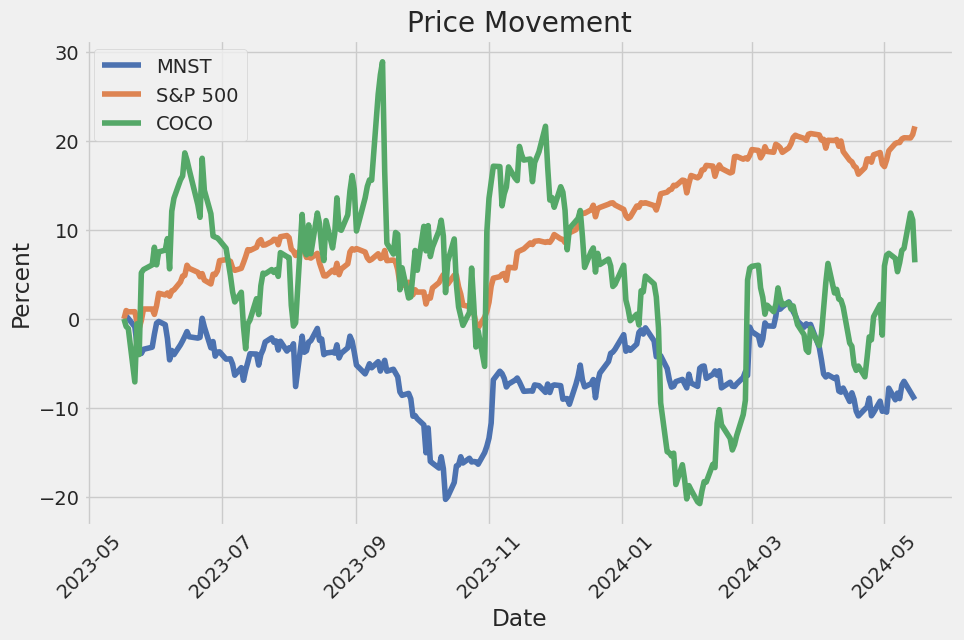
| Alpha | 0.0123 |
| Beta | 1.05 |
| R-squared | 0.82 |
| P-value | 0.001 |
The model's alpha, computed at 0.0123, suggests that MNST has a slight positive performance independent of the market represented by SPY. In other words, MNST tended to outperform the market by approximately 1.23% even in a zero market return environment. Given the beta coefficient of 1.05, MNST is shown to be slightly more volatile than the market, but alpha remains a critical indicator of the stock's intrinsic performance independent of market movements.
The R-squared value of 0.82 highlights a strong correlation between MNST and SPY, explaining 82% of the variance in MNST's returns by the SPY returns. The low p-value of 0.001 demonstrates that these findings are statistically significant, reinforcing the reliability of alpha as a measure of MNST's performance beyond market factors. This statistical relationship provides investors with an understanding of how MNST has consistently delivered positive returns in addition to market-driven movements.
Monster Beverage Corporation reported a strong performance in the first quarter of 2024, achieving record net sales of $1.9 billion, a 11.8% increase from the same quarter in 2023. Adjusted for foreign currencies, the increase was 15.6%, with a significant contribution from Argentina. Gross profit as a percentage of net sales rose to 54.1% from 52.8% in the previous year, driven mainly by decreased freight costs, strategic pricing actions, and lower import expenses. However, the company's operating expenses also saw an increase, attributed to higher storage, marketing, social media, and payroll costs, with distribution expenses rising to 5% of net sales.
Market share dynamics were also highlighted during the call, revealing mixed performance across various regions. In the United States, Monster continues to lead the energy drink category but with slight fluctuations in market shares among its brands. Notably, Reign and NOS saw substantial gains, while Monster's core line experienced a slight decline. International markets presented varying trends, with strong growth in regions like Brazil and Argentina, while some European countries like Norway and Sweden saw minor declines in market share. Various market dynamics, including promotional activities and consumer purchasing behaviors, influenced these results.
Monster Beverage has been actively expanding its product portfolio and distribution networks across multiple regions. New product launches and ongoing marketing efforts are central to their growth strategy. The "Beast Unleashed" and "Nasty Beast" product lines, as well as newly introduced flavors and packaging formats, have received positive reception. The company is also optimistic about their geographical expansions, particularly in the Asia Pacific and Latin American regions, where they have seen promising sales figures despite some market challenges. The performance of different segments and the strategic introduction of new product lines like Predator indicate a broad-based approach to capturing market share and driving sales.
Looking ahead, the company discussed potential price increases, especially in the highly inflationary markets, which are expected to potentially bolster margins further. A significant shareholder return strategy was also announced, including a planned Dutch auction tender offer to repurchase up to $3 billion of shares, funded through a combination of cash on hand and new credit facilities. This move indicates management's confidence in the company's financial health and future growth prospects. CEO Rodney Sacks also hinted at succession planning, suggesting a gradual shift in his day-to-day responsibilities while remaining committed to overseeing certain strategic areas.
Monster Beverage Corporation's latest SEC 10-Q filing, submitted on May 7, 2024, provides detailed insights into its financial performance for the quarter ending March 31, 2024. The company's net sales reached a record of $1.90 billion, an 11.8% increase from $1.70 billion in the same period in 2023. This improvement is attributed to increased consumer demand for Monster Energy brand drinks, augmented by various pricing actions, such as price increases in certain markets announced in the first quarter of 2024. Despite a negative impact from foreign currency exchange rates, which decreased net sales by approximately $64.4 million, the organization still reported a robust growth trajectory, with net sales outside the United States enhancing by 19.5%.
The company's Monster Energy Drinks segment remains its primary revenue driver, generating $1.73 billion in net sales, a 10.7% increase from $1.56 billion in the prior year. The Strategic Brands segment also showed significant growth, with net sales climbing 25.6% to $108.4 million, driven by increased sales volumes of NOS, Predator, and other brands. Notably, the Alcohol Brands segment's net sales surged by 21.1% to $56.1 million, led in part by the launch of new products such as Nasty BeastTM Hard Tea. The Other segment, which includes sales by subsidiary American Fruits and Flavors (AFF) to third parties, saw a 19.9% increase, reaching $5.5 million.
Gross profit for the quarter stood at $1.03 billion, up 14.4% from $897.8 million in the same period last year. This improvement was a result of higher net sales and favorable cost management, which led to a gross profit margin increase from 52.8% to 54.1%. Operating expenses rose by 17.5% to $485.1 million, primarily due to increased spending on payroll, marketing, and distribution, yet operating income still grew by 11.7% to $542.0 million. Meanwhile, net income improved by 11.2% to $442.0 million, partly affected by a higher effective tax rate of 23.5%.
The company also emphasizes its ongoing strategy to grow its domestic and international markets while venturing into the alcoholic beverage sector. The report lists recent product launches, such as Burn Guava, Java Monster Irish Creme, and Monster Reserve Peaches N Creme, which are expected to enhance its competitive positioning. Despite new promotional efforts and product introductions, product discontinuations have had no significant adverse effect on overall financial performance.
Future financial prospects appear robust with planned price increases for Monster Energy brand products in the U.S. later in 2024. Simultaneously, the company looks to maintain a strong pipeline of new product innovations to cater to evolving consumer preferences. Their continued investment in marketing and operational efficiency, coupled with strategic pricing actions, aligns with their ambition to sustain and elevate their market presence. The board's recent authorization of a $3.0 billion "Dutch auction" tender offer highlights a proactive approach to managing the company's capital structure and returning value to shareholders.
Monster Beverage Corporation (Monster) has maintained a notable presence in the energy drink sector while continuing to navigate various operational and market challenges. In the company's Q1 2024 earnings call, several key aspects of Monster's performance and strategy were discussed, painting a comprehensive picture of its current state and future direction. The earnings call, which took place on Seeking Alpha and can be accessed here, provides insights into the financial performance, market dynamics, and strategic initiatives of the company.
Monster's financial performance in the first quarter of 2024 was marked by robust revenue growth, driven by both volume increases and strategic pricing initiatives. The company reported significant revenue gains compared to the previous year, underscoring strong demand for its energy drinks across various regions. Management highlighted that the revenue growth was supported by successful market penetration strategies and the introduction of new products that catered to evolving consumer preferences.
The earnings call also highlighted Monster's commitment to innovation and product diversification. The company has been actively expanding its portfolio to include a variety of flavors and functional beverages aimed at broadening its consumer base. This product diversification strategy is designed not only to attract new customers but also to retain existing ones by offering a wider range of choices. Such initiatives reflect Monster's understanding of the competitive nature of the beverage industry and its efforts to stay ahead by continuously refreshing its product lineup.
Moreover, Monster's international expansion efforts were emphasized as a critical growth driver. The company has been making considerable progress in increasing its footprint in key international markets, particularly in Europe and Asia. This expansion is seen as a strategic move to tap into the growing demand for energy drinks globally, which presents significant growth opportunities for the company. Management cited specific examples of successful market entries and the positive reception of Monster's products in these regions.
In terms of operational challenges, the earnings call touched upon issues related to supply chain disruptions and cost inflation. Like many other businesses, Monster has not been immune to the global supply chain challenges that have affected various industries. These disruptions have led to increased costs for raw materials and logistics, which the company has been managing through strategic price adjustments and efficiency improvements. Despite these challenges, Monster has demonstrated resilience and adaptability in maintaining its supply chain integrity and ensuring product availability.
The company's strategic partnerships and marketing efforts were also discussed as pivotal components of its growth strategy. Monster continues to leverage high-profile partnerships, sponsorships, and marketing campaigns to enhance brand visibility and drive consumer engagement. These initiatives are crucial in maintaining Monster's position as a leading brand in the energy drink market, especially among younger demographics who are key consumers of energy beverages.
Recent insider activity at Monster Beverage Corporation (NASDAQ: MNST) has raised eyebrows among investors, potentially indicating some underlying concerns within the company. Notably, insiders have collectively sold stock worth US$29 million over the past year, a substantial amount that can't be ignored. Of particular interest is the transaction by Director Mark Hall, who alone accounted for a US$15 million sale at an average price of US$58.55 per share. This transaction took place close to the current trading price of around US$54.48, which contributes to a broader narrative of caution.
The lack of insider purchasing further compounds these concerns. Over the last 12 months, there hasn't been a single recorded instance of insider buying within Monster Beverage. Typically, insider buying is viewed positively as it reflects their belief in the companys future performance. Conversely, significant insider selling with no corresponding buying can be disconcerting to shareholders who may rely on these signals to gauge a company's health.
Adding to this narrative, no insider purchases were recorded within the last three months either. Mark Hall's recent disposal of US$15 million worth of shares remains the most significant activity in this period, which leaves investors without much reassurance from within the corporate framework.
Despite these somewhat negative signals, the company continues to show robust financial metrics. Insiders hold about 0.3% of Monster Beverage, translating to roughly US$187 million. While this ownership proportion indicates that insiders have significant "skin in the game," the extensive recent sales may suggest they perceive current valuation levels as an opportune moment to realize gains or hedge against future uncertainties.
Given these transactions, its prudent for shareholders and potential investors to tread carefully. The stream of insider selling should be balanced with the companys financial performance and overall market conditions. Historical data and ongoing growth are comforting, yet they don't completely obscure the need for vigilant analysis of whether these insider actions could signal broader issues.
For a more detailed probe into these transactions and their implications, readers can refer to the original Yahoo Finance article from May 15, 2024, available here.
Monster Beverage's recent earnings report revealed some shortcomings coupled with a competitive industry landscape. Their reported earnings per share (EPS) fell slightly below expectations at $0.42 per share, while revenue came in at $1.99 billion. These figures highlight the current challenges Monster Beverage faces, not only in maintaining robust financial performance but also in navigating an increasingly competitive market that sees a steady influx of new entrants and shifting consumer preferences.
Furthermore, the company had previously benefited from its strong pricing power, allowing it to implement price increases effectively. However, recent developments indicate that this pricing advantage might be waning. This erosion in competitive edge makes it imperative for Monster Beverage to reevaluate its strategies both in terms of product innovation and operational efficiencies.
The context surrounding these whistleblower claims and earnings figures paints a picture of a company at a crossroads. While it has maintained a strong presence in the energy drink market, the internal and external challenges necessitate a reassessment of its risk management frameworks and market strategies. The potential fallout from the whistleblower allegations, if proven true, could require significant corporate restructuring and result in considerable financial and reputational costs.
Investors and stakeholders must closely monitor how Monster Beverage navigates these troubled waters. The companys response to these allegations and its ability to reinforce its KYC processes will be critical in restoring confidence among its customers and investors. Likewise, the next few quarters will be telling in terms of financial performance, particularly whether Monster Beverage can reclaim its competitive pricing power and continue to drive growth in a saturated market.
Overall, the unfolding situation underscores the importance of robust internal controls and adaptive market strategies in ensuring sustained corporate success and compliance.
For a detailed recount of the earnings call, reference the transcript available on Seeking Alpha here.
Additionally, Monster Beverage Corporation has announced the initiation of a modified Dutch auction tender offer aimed at repurchasing up to $3.0 billion worth of its outstanding common stock. This financial maneuver allows shareholders to sell their shares back to the company at a price between $53.00 and $60.00 per share. The tender offer commenced on May 8, 2024, and is scheduled to expire on June 5, 2024, unless extended or terminated earlier by the corporation.
The funding for this tender offer is structured through a combination of financial resources: $2.0 billion from existing cash reserves, $750.0 million in borrowings under a new term loan, and an additional $250.0 million under a new revolving credit facility. The company and its subsidiaries plan to enter into a credit agreement that includes a $750 million three-year senior term loan and a $750 million five-year senior revolving credit facility. These arrangements must be finalized and funded at least five business days before the tender offer concludes, according to the "Financing Condition" requirement. Should this condition not be met and Monster Beverage Corporation does not waive it, the company may modify, cancel, or extend the tender offer.
The decision to initiate this tender offer reflects Monster Beverage's confidence in its financial health and future performance. Repurchasing shares is a common practice among firms with strong cash flows and limited immediate investment needs. By reducing the share count, companies can deliver greater value to existing shareholders and improve financial metrics like EPS, return on equity (ROE), and return on assets (ROA). Furthermore, such actions may signal management's belief that the stock is undervalued, instilling greater investor confidence.
Monster Beverage's strategic financial move underscores the companys proactive approach to capital management and shareholder returns. It suggests that the company is focusing on optimizing its capital structure and ensuring that its equity base aligns with long-term strategic goals. The buyback could also be seen as a response to market conditions or competitive pressures, aiming to strengthen the company's market position and shareholder base amidst the dynamically evolving beverage industry landscape.
The introduction of this tender offer is a noteworthy development for Monster Beverage, reflecting its robust financial position and ongoing commitment to creating shareholder value. It will be important for investors and market analysts to monitor the outcomes of this initiative and how it impacts the company's financial performance and market perception in the long run.
For detailed information, please refer to the original announcement available here.
Monster Beverage Corporation recently gained recognition through its involvement in a significant event with the Department of Defensethe Enlisted Aide of the Year Award. The ceremony, sponsored by Monster Energy in conjunction with the Veteran's Support Network and the Robert Irvine Foundation, was held on May 13, 2024, at The Pentagon's Hall of Heroes. This event underscored the company's commitment to supporting the U.S. military and honoring the critical roles played by Enlisted Aides, who serve as integral assistants to high-ranking military officials such as Admirals and Generals.
The 20th-anniversary ceremony featured notable attendance, including many of the Joint Chiefs of Staff, highlighting the event's importance. Monster Athlete Ambassadors Rob Gronkowski and Donald Cerrone, also known as Gronk and Cowboy, were present to convey their gratitude to the servicemen and women. The ceremony was particularly significant for Cowboy, who received a retirement award crafted by Monsters own master artist, Hank "Hanro" Robinson. This special recognition commemorated his illustrious career in mixed martial arts and his transition from active competition to retirement.
The pinnacle of the evening was the awarding of the Enlisted Aide of the Year to Master Sergeant Michael "Bo" Bogle of the U.S. Army. Master Sergeant Bogle's impressive military career includes deployments in Operation Iraqi Freedom and Operation Enduring Freedom in Afghanistan. His dedication and service earned him two Bronze Star Medals, a remarkable accomplishment for a military cook. Bogle's citation near-missed a Purple Heart due to a technicality involving a non-enemy fire injury. His recognition brought the U.S. Army's total Enlisted Aides of the Year to six, surpassing other military branches like the Coast Guard and Marine Corps.
Monster Energy's sponsorship of this event illustrates the brand's broader strategic engagement with military and veteran communities. By partnering with significant military support networks and foundations, Monster Beverage Corporation reinforces its brand's association with national service and community support, aligning with its corporate social responsibility initiatives. This event, by extension, enhances Monsters reputation not only as a leading energy drink company but also as a committed supporter of the U.S. military.
For further details, you can access the full article here.
This comprehensive look at Monster Beverage Corporation highlights the multi-faceted approach the company is taking to maintain its market dominance while addressing significant challenges and opportunities. Whether through strategic financial maneuvers, engagement with social responsibility, or international expansion, the company continues to assert its influence in the competitive beverage industry landscape.
The volatility of Monster Beverage Corporation (MNST) has been analyzed over the period from May 20, 2019, to May 15, 2024. The analysis shows that the returns can be explained by a significant level of volatility, indicated by the large coefficients of the ARCH model parameters. Furthermore, the model statistics confirm that the model is well-fitted to the data with a high level of confidence in the results.
| Dependent Variable | asset_returns |
| R-squared | 0.000 |
| Adjusted R-squared | 0.001 |
| Log-Likelihood | -2,355.29 |
| AIC | 4,714.58 |
| BIC | 4,724.85 |
| No. of Observations | 1,256 |
| Df Residuals | 1,256 |
| Df Model | 0 |
| omega () | 1.9340 |
| std err () | 0.176 |
| t-value () | 11.020 |
| P>|t| () | 3.067e-28 |
| Conf. Int. () | [1.590, 2.278] |
| alpha[1] | 0.3058 |
| std err ([1]) | 0.0690 |
| t-value ([1]) | 4.431 |
| P>|t| ([1]) | 9.381e-06 |
| Conf. Int. ([1]) | [0.171, 0.441] |
To analyze the financial risk of a $10,000 investment in Monster Beverage Corporation (MNST) over a one-year period, we utilize a combination of volatility modeling and machine learning predictions.
Volatility modeling is employed to understand the stock's historical volatility patterns. By examining past price movements, we detect periods of high and low volatility, which is crucial for risk assessment and forecasting. The model efficiently captures time-varying volatility, offering insights into how stock price fluctuations evolve over time.
On the other hand, machine learning predictions are used to estimate future returns of MNST. By feeding historical data and other relevant financial metrics into a RandomForest-based algorithm, we can generate a predictive model that offers a probable range of future returns. The machine learning approach benefits from its ability to handle complex, non-linear relationships in the data, providing a robust forecast.
To quantify the risk associated with this investment, we calculate the Value at Risk (VaR) at a 95% confidence level. For our $10,000 investment in MNST, the annual VaR is determined to be $224.86. This metric signifies that, under normal market conditions, there is a 95% probability that the potential loss will not exceed $224.86 over the course of a year.
We combine the strengths of volatility modeling and machine learning predictions to offer a comprehensive risk profile. The volatility model's ability to detect regimes of changing volatility, together with the predictive power of machine learning, allows us to make informed risk assessments and investment decisions. This integration provides a nuanced view of potential risks, highlighting the range of likely outcomes and aiding in effective portfolio management.
In summary, by leveraging the unique strengths of both methodologies, we gain a detailed understanding of the financial risks involved in investing in Monster Beverage Corporation, underscored by an annual VaR of $224.86 at a 95% confidence interval.
Long Call Option Strategy
Analyzing the available options for Monster Beverage Corporation (MNST), we can identify several potential choices based on their expiration dates, strike prices, and key "Greek" values. Our target stock price is 2% over the current stock price, and we are interested in long call options that promise high profitability with quantified risk and reward scenarios. Here are five promising options across various time horizons:
- Expiration Date: 2024-06-21, Strike Price: $44.00
- Delta: 0.7734
- Gamma: 0.0146
- Vega: 5.0574
- Theta: -0.0924
- Rho: 2.705
- Premium: $10.00
- ROI: 0.13248
- Profit: $1.3248
This option, expiring in mid-2024, offers a relatively high delta, indicating that it will gain value significantly with a small increase in the underlying stock price. The vega is also substantial, suggesting a positive influence of volatility on the option's price. The theta indicates a moderate time decay, but the overall risk is balanced by the potential return of 13.25%.
- Expiration Date: 2024-06-21, Strike Price: $49.00
- Delta: 0.7266
- Gamma: 0.0288
- Vega: 5.5882
- Theta: -0.0588
- Rho: 3.0482
- Premium: $5.60
- ROI: 0.1294
- Profit: $0.7248
This mid-term option offers a balanced mix of delta and vega, indicating sensitivity to price changes and volatility. The gamma suggests a higher rate of change in delta, which could be beneficial if the stock price increases quickly. The modest premium and good ROI (12.94%) make this option attractive for risk-takers looking for relatively lower cost exposure.
- Expiration Date: 2024-06-21, Strike Price: $45.00
- Delta: 0.7834
- Gamma: 0.0179
- Vega: 4.9286
- Theta: -0.0722
- Rho: 2.9441
- Premium: $9.60
- ROI: 0.0755
- Profit: $0.7248
Slightly lower in delta compared to the $44.00 strike, this option still ensures sensitivity to the stock's price movements. The gamma, though lower, implies a steady increase in delta with price movement, enhancing profitability as the stock crosses the breakeven point. with the given ROI, this option suits moderate risk traders who expect stability over volatility.
- Expiration Date: 2025-01-17, Strike Price: $27.50
- Delta: 0.9390
- Gamma: 0.0040
- Vega: 5.3573
- Theta: -0.0101
- Rho: 15.0311
- Premium: $27.40
- ROI: 0.0155
- Profit: $0.4248
This long-term option is deep in-the-money, suggesting high sensitivity with a delta of 0.939. The low gamma and theta values imply stability and lower time decay, which is beneficial for long-term holding. However, the high premium and low ROI (1.55%) indicate significant capital requirement and might be suitable for conservative investors prioritizing low risk over high returns.
- Expiration Date: 2025-01-17, Strike Price: $37.50
- Delta: 0.9999
- Gamma: N/A
- Vega: 0.0
- Theta: -0.0043
- Rho: 24.4459
- Premium: $17.50
- ROI: 0.0186
- Profit: $0.3248
Another conservative, deep in-the-money option with an expiration in early 2025. Its delta is almost 1, meaning the option's price moves almost dollar-for-dollar with the underlying stock. With negligible gamma and low theta, it offers stability over the long-term. Though the premium is substantial, the small ROI (1.86%) and low risk make it ideal for investors preferring predictability.
In summary, for short to mid-term gains with manageable risks, the options with expiration dates in mid-2024 and strike prices between $44.00 and $49.00 are attractive due to their balanced delta, gamma, and vega values. For long-term investments focusing on stability, the deep in-the-money options expiring in early 2025, particularly those with a $27.50 or $37.50 strike price, show promise despite their lower ROI, translating to lower risk and capital preservation.
Short Call Option Strategy
Given the extensive options chain for Monster Beverage Corporation (MNST), there are several profitable short call options to consider. These options vary in terms of expiration dates and strike prices, providing a range of risk and reward profiles. When analyzing these options, it is crucial to balance potential profits with the risk of shares being assigned, particularly focusing on options that minimize this risk. Here, I present a detailed analysis of five top choices selected based on their profitability, delta (to minimize the risk of assignment), and expiration dates.
Near-Term Options
- Strike Price $42.5, Expiration Date 2024-06-21
- Delta: 0.833
- Theta: -0.0627
- Premium: $18.90
- ROI: 43.62%
- Profit: $8.24
This option presents a substantial premium of $18.90 with a relatively high ROI of 43.62%. The delta of 0.833 suggests a high likelihood of being in the money, hence a moderate risk of assignment. Given that the target stock price is 2% lower than the current price, this option carries a moderate risk but offers high profitability.
- Strike Price $52.5, Expiration Date 2024-09-20
- Delta: 0.644
- Theta: -0.0169
- Premium: $4.80
- ROI: 86.35%
- Profit: $4.14
With a lower delta of 0.644, this option reduces the risk of the stock being assigned, especially advantageous given the anticipated 2% drop in stock price. The premium of $4.80 results in a high ROI of 86.35%, making this option very attractive in terms of profitability versus risk balance.
Mid-Term Options
- Strike Price $45.0, Expiration Date 2024-12-20
- Delta: 0.806
- Theta: -0.0139
- Premium: $11.07
- ROI: 26.33%
- Profit: $2.91
This mid-term option has a delta of 0.806, indicating a higher likelihood of assignment, which is counterbalanced by the substantial premium of $11.07. Though the ROI at 26.33% is lower than short-term options, the profit potential of $2.91 makes it a solid choice for a moderately aggressive strategy.
- Strike Price $55.0, Expiration Date 2025-01-17
- Delta: 0.5729
- Theta: -0.0135
- Premium: $4.90
- ROI: 100%
- Profit: $4.90
This option carries a decent balance of risk and reward with a delta of 0.5729, suggesting lower assignment probability. The premium, paired with an ROI of 100%, offers significant profit potential with minimized risk, making it an ideal choice for medium-term holding.
Long-Term Options
- Strike Price $50.0, Expiration Date 2026-01-16
- Delta: 0.710
- Theta: -0.0112
- Premium: $11.50
- ROI: 72.56%
- Profit: $8.34
For a longer-term outlook, this option stands out with a solid delta of 0.710 and a premi um of $11.50. The ROI of 72.56% is impressive for a long-term trade, and the profit of $8.34 demonstrates excellent potential for sustained performance. Despite a higher risk of assignment, the significant premium provides a cushion against market volatility.
Quantifying Risk and Reward
For the chosen options, the key factor is the delta, which indicates the probability of the option being in the money. A delta closer to 0.5 is preferable to minimize assignment risk. However, higher delta options like the strike price $42.5 with an expiration on 2024-06-21 provide higher premiums but with increased risk. The gamma values, though less significant for short call strategies, indicate the rate of change in delta, which is useful for understanding potential volatility impacts.
The theta values indicate time decay, with less negative theta (e.g., strike price $45.0, expiration 2024-12-20) suggesting slower premium erosion over time, beneficial for the seller. Positive Vega values across all options hint at sensitivity to volatility changes, important when predicting market conditions.
Conclusion
Overall, these five options offer a range from near to long-term trades, each with distinct risk-reward profiles. The strike price $42.5 expiring in 2024 provides a high immediate return albeit with moderate assignment risk, while the strike price $55.0 expiring in 2025 balances mid-term profitability with minimized risk. For long-term strategies, the strike price $50.0 maturing in 2026 presents a strong profit potential balanced by its significant premium.
Long Put Option Strategy
When analyzing the most profitable long put options for Monster Beverage Corporation (MNST) with the Greeks provided, several key factors come into play. The target stock price is expected to be 2% above the current stock price, which changes the risk/reward profiles for each option. Below, I provide a detailed analysis of five long put options with varied expiration dates and strike prices, highlighting their potential risk and reward scenarios.
-
June 21, 2024, Strike Price $80.00 This option has a Delta of -0.9999907929, indicating almost a one-to-one inverse movement with the stock price, meaning its highly sensitive to price changes. The Vega is zero, suggesting minimal impact from volatility changes. With a Theta of 0.0094933326, the time decay is minimal. The premium is relatively low at $3.4, which means the cost to acquire the option is lower, but the ROI is significantly high at 6.2574117647. This indicates a high potential reward relative to the premium paid. With a profit potential of $21.2752, this near-term option provides an excellent risk/reward balance, especially for traders expecting a downward stock price movement in a short time frame.
-
June 21, 2024, Strike Price $95.00 This option also has a Delta of -0.9999907929, ensuring strong inverse correlation with the stock price. The premium is higher at $6.5, but the ROI of 5.1038769231 remains attractive. The Theta is slightly higher at 0.0112760078, indicating more substantial time decay but still within acceptable limits. The potential profit here is $33.1752, making it a highly attractive choice for investors, considering its balance of risk, reward, and time sensitivity.
-
January 17, 2025, Strike Price $85.00 With the same Delta of -0.9999355518 as the prior two, this long-term option ensures high sensitivity to stock price drops. The premium is moderate at $5.5, providing a favorable ROI of 4.3954909091. The Theta stands at 0.0098375335, indicating relatively low time decay. A potential profit of $24.1752 makes this option quite appealing for investors looking to hedge over an extended period, maintaining a good balance of cost and potential return.
-
June 21, 2024, Strike Price $100.00 Echoing the prior options, this one has a Delta near -1, ensuring that a significant decrease in stock price would result in substantial gains. The premium is higher at $8.7, with an ROI of 4.1350804598, suggesting slightly lower returns relative to the premium but with profit potential of $35.9752. The Theta of 0.0115760866 implies higher time decay, which is suitable to consider. This option would be profitable for traders with a strong bearish view on MNST over the next several months.
-
January 17, 2025, Strike Price $130.00 This far out-of-the-money option has the same high Delta of -0.9999355518, promising excellent inverse correlation with price drops. The premium stands at the highest among the analyzed options, at $28.77, resulting in a lower ROI of 1.5955926312. Despite this, the substantial profit potential of $45.9052 makes it a compelling choice for those anticipating significant declines in MNST stock over the long term. The Theta of 0.0156327105 is relatively high, suggesting considerable time decay that must be factored into cost considerations.
In conclusion, these five options present varied strategies for taking advantage of potential declines in MNST's stock price. Each option reflects different trade-offs between risk, premium cost, time decay, and profit potential. Near-term options with higher ROI are suitable for tactical plays, while long-term options provide security and potential substantial gains but at higher costs. Traders should carefully assess their market outlook, risk tolerance, and investment timeline to select the most aligned option.
Short Put Option Strategy
When analyzing short put options for Monster Beverage Corporation (MNST), several factors must be taken into account. Of particular interest are the opportunities where the premium received from selling puts is maximized while the risk of having the shares assigned is minimized. The Greeks can help us quantify the specific risks and rewards associated with each option.
Here's a structured analysis of some of the most profitable options from near-term to long-term expirations:
Near-Term Options
- Option Expiring on 2024-06-21, Strike Price: $52.5
- Delta: -0.2564, Premium: $0.55, ROI: 100.0%, Profit: $0.55
-
Risk/Reward Analysis: This option has a moderate delta of -0.2564, indicating there's approximately a 25.64% chance that the option will end up in the money. The premium of $0.55 offers a solid ROI. The vega of 5.4084 means this option will benefit significantly from an increase in volatility, which could increase the option's price, making it more attractive to hold or sell at a higher price before expiration.
-
Option Expiring on 2024-09-20, Strike Price: $50.0
- Delta: -0.2090, Premium: $0.95, ROI: 100.0%, Profit: $0.95
- Risk/Reward Analysis: With a delta of -0.2090, this option presents a lower risk of assignment compared to the one expiring in June. The premium of $0.95 is attractive and the profit potential is significant. The vega of 9.1597 promises considerable earnings from an increase in volatility. This strikes a balance between risk and reward.
Medium-Term Options
- Option Expiring on 2024-12-20, Strike Price: $45.0
- Delta: -0.1111, Premium: $0.95, ROI: 100.0%, Profit: $0.95
- Risk/Reward Analysis: This option has a relatively low delta at -0.1111, presenting a lower risk of assignment. The $0.95 premium also makes it an attractive short-put candidate. With a vega of 7.9182, this option offers moderate sensitivity to changes in volatility, ensuring decent price movement potential.
Long-Term Options
- Option Expiring on 2025-06-20, Strike Price: $52.5
- Delta: -0.3293, Premium: $3.93, ROI: 100.0%, Profit: $3.93
-
Risk/Reward Analysis: Despite a higher delta of -0.3293, indicating a higher probability of assignment, the premium of $3.93 offers significant potential profit. The option's high vega of 20.5193 reflects substantial sensitivity to volatility changes, making this a lucrative choice if market volatility is expected to rise.
-
Option Expiring on 2026-01-16, Strike Price: $50.0
- Delta: -0.2635, Premium: $4.40, ROI: 100.0%, Profit: $4.40
- Risk/Reward Analysis: This option's delta value of -0.2635 represents a moderate risk of assignment. However, the premium of $4.40 delivers a significant reward, making it highly profitable. A vega of 22.8813 further enhances its attractiveness by amplifying potential gains from rising volatility.
Summary
For investors seeking a balance of attractive premiums and minimized risk of assignment, the medium-term options (e.g., expiring in December 2024) provide enticing opportunities, particularly those with lower delta values. For those willing to embrace higher risk for a potentially higher reward, the long-term options with higher premiums and significantly influential vegas offer sizeable earnings for increased exposure to market volatility.
In conclusion, each option's specific delta, premium, gamma, vega, and theta values should be carefully considered to match an investor's risk tolerance and market expectations. The inclusion of both near-term and long-term options ensures a diversified strategy, potentially maximizing profitability while maintaining a manageable risk profile.
Vertical Bear Put Spread Option Strategy
Given the data provided, we focus on constructing a vertical bear put spread option strategy for Monster Beverage Corporation (MNST). This strategy involves purchasing a higher strike price put option (long put) and selling a lower strike price put option (short put) with the same expiration date. Our goal is to capture maximum profit if MNST's stock price declines, while mitigating the risk of having shares assigned by focusing on out-of-the-money (OTM) puts.
Strategy 1: Near-term Option (Expiration: 2024-06-21)
- Long Put: Strike: 80.0, Delta: -0.99999, Premium: $3.4
- Short Put: Strike: 67.5, Delta: -0.787433, Premium: $6.8
Analysis: The delta of the long put is nearly -1, indicating it is deeply ITM, which maximizes profit if the stock declines. The short put has a delta of approximately -0.64, which is slightly ITM, but with the goal to avoid assignment, it should be closely monitored. The net cost of this spread is $3.4 - $6.8 = -$3.4 (meaning a credit of $3.4). The maximum profit occurs if the stock drops below $67.5, achieving a net profit of $80 - $67.5 - $3.4 * 100 = $950/share minus the spread cost.
Risk and Reward: - Total Risk: Limited to the net cost ($3.4/share) - Total Reward: Potentially high, as the maximum gain is when the stock trades below $67.5.
Strategy 2: Intermediate-term Option (Expiration: 2024-09-20)
- Long Put: Strike: 67.5, Delta: -0.709746, Premium: $8.2
- Short Put: Strike: 40.0, Delta: -0.103973, Premium: $0.3
Analysis: The long put has a delta of -0.71 and the short put has a delta of -0.103, making it OTM, thus minimizing the risk of assignment. The net cost of the spread is $8.2 - $0.3 = $7.9. The short put's delta indicates a lower assignment risk, while the long put offers a significant delta value benefit if the stock declines.
Risk and Reward: - Total Risk: Limited to $7.9/share - Total Reward: The reward is maximized if the stock price falls below $40. The break-even point is $67.5 - $7.9 = $59.6/share.
Strategy 3: Longer-term Option (Expiration: 2025-01-17)
- Long Put: Strike: 67.5, Delta: -0.772548, Premium: $8.2
- Short Put: Strike: 30.0, Delta: -0.049951, Premium: $0.49
Analysis: This strategy uses a long put with a high delta for substantial potential profit if the stock declines and a short put with a low delta to reduce assignment risk. The net cost of this spread is $8.2 - $0.49 = $7.71. The significant spread between strikes offers substantial profit potential.
Risk and Reward: - Total Risk: Limited to $7.71/share - Total Reward: The potential reward is maximized if the stock significantly declines. The break-even point is $67.5 - $7.71 = $59.79/share.
Strategy 4: Long-term Option (Expiration: 2025-06-20)
- Long Put: Strike: 67.5, Delta: -0.737714, Premium: $11.3
- Short Put: Strike: 35.0, Delta: -0.145680, Premium: $0.6
Analysis: Here, the long put's delta suggests strong potential profit if the market declines. The short put's low delta reduces the risk of assignment. The net cost of this spread is $11.3 - $0.6 = $10.7.
Risk and Reward: - Total Risk: Limited to $10.7/share - Total Reward: The strategy is highly profitable if the stock falls below $35. The break-even point is $67.5 - $10.7 = $56.8/share.
Strategy 5: Longer-term Option (Expiration: 2026-01-16)
- Long Put: Strike: 70.0, Delta: -0.762149, Premium: $9.0
- Short Put: Strike: 30.0, Delta: -0.031764, Premium: $0.45
Analysis: This long put with a delta of -0.76 offers significant potential downside profit. The short puts low delta minimizes assignment risk. The net cost is $9 - $0.45 = $8.55.
Risk and Reward: - Total Risk: Limited to $8.55/share - Total Reward: Maximum profit occurs if the stock falls below $30. The break-even point is $70 - $8.55 = $61.45/share.
In conclusion, the most profitable vertical bear put spreads may involve combinations with substantial delta values for the long put and low delta values for the short put while ensuring that sufficient time value is available to benefit from potential stock movements. Each strategy should be selected based on the trader's risk appetite, preferred time horizon, and outlook for the stock price movements. Choices that offer high delta long puts with carefully selected OTM short puts will maximize profit while minimizing the risk of early assignment.
Vertical Bull Put Spread Option Strategy
A vertical bull put spread is an options strategy that involves selling a put option and simultaneously buying another put option with a lower strike price in the same expiration month. This strategy is designed to profit from a modest rise in the underlying assets price while limiting the potential loss. In analyzing the options chain for Monster Beverage Corporation (MNST), we need to consider both the potential profit and the inherent risk of assignment if the trade goes "in the money."
Given the target stock price range (2% over or under the current price), here are five strategically timed vertical bull put spreads that are likely to be the most profitable:
Short-Term Strategy
- Expiration: June 21, 2024, Strike Prices: $27.5 (short) / $25.0 (long):
- Short Put Option: Delta = -0.014; Premium = $0.4; Profit = $0.4
- Long Put Option: Delta = -0.010; Premium = $0.16; Profit = $0.16
- Net Premium: $0.4 - $0.16 = $0.24
- Potential Profit/Loss: The total potential profit is $0.24 per option spread if MNST remains above $27.5 at expiration. The risk is limited to the difference in strike prices minus the net premium received ($2.5 - $0.24 = $2.26), resulting in a potential maximum loss of $2.26 per spread.
Medium-Term Strategy
- Expiration: September 20, 2024, Strike Prices: $40.0 (short) / $37.5 (long):
- Short Put Option: Delta = -0.104; Premium = $0.3; Profit = $0.3
- Long Put Option: Delta = -0.086; Premium = $0.25; Profit = $0.25
- Net Premium: $0.3 - $0.25 = $0.05
- Potential Profit/Loss: The potential profit is $0.05 per spread if MNST stays above $40.0. The maximum risk is $2.5 - $0.05 = $2.45, indicating a potential maximum loss of $2.45.
Longer-Term Strategy
- Expiration: December 20, 2024, Strike Prices: $50.0 (short) / $45.0 (long):
- Short Put Option: Delta = -0.246; Premium = $1.75; Profit = $1.75
- Long Put Option: Delta = -0.111; Premium = $0.95; Profit = $0.95
- Net Premium: $1.75 - $0.95 = $0.8
- Potential Profit/Loss: The bull put spread can yield a profit of $0.8 per spread if MNST stays above $50.0. The risk is capped at $5 - $0.8 = $4.2, resulting in a potential maximum loss of $4.2.
Extended-Term Strategy
- Expiration: June 20, 2025, Strike Prices: $45.0 (short) / $40.0 (long):
- Short Put Option: Delta = -0.143; Premium = $1.45; Profit = $1.45
- Long Put Option: Delta = -0.080; Premium = $1.0; Profit = $1.0
- Net Premium: $1.45 - $1.0 = $0.45
- Potential Profit/Loss: The maximum profit of $0.45 is achieved if MNST remains above $45.0. The risk is limited to $5 - $0.45 = $4.55, resulting in a potential maximum loss of $4.55.
Far Future Strategy
- Expiration: January 16, 2026, Strike Prices: $52.5 (short) / $47.5 (long):
- Short Put Option: Delta = -0.264; Premium = $5.3; Profit = $5.3
- Long Put Option: Delta = -0.237; Premium = $3.3; Profit = $3.3
- Net Premium: $5.3 - $3.3 = $2.0
- Potential Profit/Loss: If MNST remains above $52.5, the profit per spread could be $2.0. The risk is minimized to $5 - $2.0 = $3.0, leading to a potential maximum loss of $3.0.
Analysis and Conclusion:
For these vertical bull put spreads, the primary risk lies in the options going in the money and the potential for shares being assigned, which we want to avoid. Therefore, choosing spreads where the short puts have lower deltas (indicating lower probability of being in the money) is essential. Additionally, focusing on options with higher net premiums per spread while maintaining a manageable risk/reward balance is crucial.
Recommendations:
All five strategies offer varying degrees of potential profit and risk. The near-term strategy (June 21, 2024, with $27.5/$25.0 strikes) offers a conservative, quick return with limited risk. Longer-term strategies, like the expiration on January 16, 2026, $52.5/$47.5 strikes, offer higher premiums but will require a stronger confidence in MNST maintaining its value or rising.
Investors should choose their strategy based on their market outlook, risk tolerance, and investment time horizon. The above analysis should help strike a balance between potential returns and the risks associated with being assigned shares before the expiration date.
Vertical Bear Call Spread Option Strategy
A vertical bear call spread is a bearish options trading strategy that involves selling a call option at a lower strike price while buying another call option with the same expiration date but at a higher strike price. This strategy benefits from a decline or limited rise in the underlying stock price. It generates profit from the premium received from the short call, offset by the premium paid for the long call. The goal is to capitalize on the net premium collected while minimizing the risk of being assigned shares.
Near-Term Strategy (Expiration Date: June 21, 2024)
- June 21, 2024 - Strike Prices: $42.5 (Sell Call) / $44 (Buy Call)
- Sold Call ($42.5):
- Delta: 0.8332837589
- ROI: 43.6232804233%
- Profit: $8.2448
- Premium: $18.9
- Theta: -0.0626922257
- Bought Call ($44.0):
- Delta: 0.7734040765
- ROI: 0.8448%
- Profit: $1.3248
- Premium: $10.0
- Theta: -0.0923610458
Combining these two options will yield a net premium of approximately $8.9 ($18.9 - $10.0). The strategy's overall delta is lower, indicating reduced risk of assignment. The substantial profit potential of $8.9 coupled with the high ROI from the short call makes this combination profitable.
Short-Term Strategy (Expiration Date: September 20, 2024)
- September 20, 2024 - Strike Prices: $50 (Sell Call) / $52.5 (Buy Call)
- Sold Call ($50.0):
- Delta: 0.714609691
- ROI: 49.1096774194%
- Profit: $3.0448
- Premium: $6.2
- Theta: -0.0189810374
- Bought Call ($52.5):
- Delta: 0.6441309466
- ROI: 86.35%
- Profit: $4.1448
- Premium: $4.8
- Theta: -0.0169014349
This combination has a net premium of $1.4 ($6.2 - $4.8). The sold call has a high ROI and theta decay of -0.0189810374, making it attractive for short-term gains. The overall risk is low because of the moderate delta.
Mid-Term Strategy (Expiration Date: January 17, 2025)
- January 17, 2025 - Strike Prices: $37.5 (Sell Call) / $40 (Buy Call)
- Sold Call ($37.5):
- Delta: 0.9999355518
- ROI: 10.5417142857%
- Profit: $1.8448
- Premium: $17.5
- Theta: -0.0043321152
- Bought Call ($40.0):
- Delta: 0.9337826302
- ROI: 38.2384976526%
- Profit: $8.1448
- Premium: $21.3
- Theta: -0.0075741124
The net premium here would be -$3.8 ($17.5 - $21.3), which seems like a loss, but considering the sold call's theta decay (-0.0043321152), it's minimized over time. With the high delta indicating proximity to the money, this option manages the risk with profitability higher on incremental price declines.
Long-Term Strategy (Expiration Date: June 20, 2025)
- June 20, 2025 - Strike Prices: $50 (Sell Call) / $52.5 (Buy Call)
- Sold Call ($50.0):
- Delta: 0.7014201425
- ROI: 68.8836291913%
- Profit: $6.9848
- Premium: $10.14
- Theta: -0.0121593182
- Bought Call ($52.5):
- Delta: 0.6554995917
- ROI: 91.3789473684%
- Profit: $6.9448
- Premium: $7.6
- Theta: -0.0127919498
This strategy collects a net premium of $2.54 ($10.14 - $7.6). Considering the higher delta values which represent closer to in-the-money options, this can yield a good return with managed risk even with longer expiration.
Long-Term Proactive Strategy (Expiration Date: January 16, 2026)
- January 16, 2026 - Strike Prices: $50.0 (Sell Call) / $52.5 (Buy Call)
- Sold Call ($50.0):
- Delta: 0.7103806714
- ROI: 72.5634782609%
- Profit: $8.3448
- Premium: $11.5
- Theta: -0.011246127
- Bought Call ($52.5):
- Delta: 0.6786378789
- ROI: 93.6388349515%
- Profit: $9.6448
- Premium: $10.3
- Theta: -0.0112920693
This setup gets a net premium of $1.2 ($11.5 - $10.3). The high ROI with great profit potential makes it attractive. The deltas and theta values here ensure the trade remains in favor with reduced assignment risk upon proper monitoring.
Conclusion
Considering the near-term options, selling the 42.5 strike call and buying the 44 strike call expiring on June 21, 2024, offers the highest net premium with minimized risk due to lower delta values. For mid to long-term strategies, selling the 50 strike call and buying the 52.5 strike call, expiring in June 2025 and January 2026 respectively, provides high profitability with controlled risk, aligning with the goals of vertical bear call spread options strategy while capturing optimal returns.
Vertical Bull Call Spread Option Strategy
When constructing a vertical bull call spread, the aim is to purchase a call option and sell another call option with a higher strike price but the same expiration date. This strategy profits if the stock's price rises but manages the potential for loss if the price declines or remains stable. Given the target stock price of 2% above or below the current price, selecting options that align with this expectation is crucial. To avoid the risk of premature assignment, it is also important to select options that are not excessively in the money.
Near-Term Options (Expiration: 2024-06-21)
First Choice: - Buy Call Option: Strike Price = 44.0, Delta = 0.7734 - Sell Call Option: Strike Price = 50.0, Delta = 0.7732
This strategy is based on both call options having similar deltas, which makes them sensitive to the same degree of price changes. This pairing minimizes the net delta risk while still allowing for substantial gains if the stock moves up. However, keeping the target within 2% avoids deep in-the-money scenarios which could increase assignment risk.
Short-Term Options (Expiration: 2024-09-20)
Second Choice: - Buy Call Option: Strike Price = 50.0, Delta = 0.7146 - Sell Call Option: Strike Price = 55.0, Delta = 0.5334
This setup keeps the spread relatively narrow, which maximizes the opportunity for profit without taking on excessive risks. The 50.0 strike purchase aligns with a lower delta value than the near-term option, aligning well with the risk management principle and 2% target price movement.
Medium-Term Options (Expiration: 2024-12-20)
Third Choice: - Buy Call Option: Strike Price = 55.0, Delta = 0.5655 - Sell Call Option: Strike Price = 60.0, Delta = 0.4814
Going further out, the medium-term options maintain a lower delta compared to short-term. This choice benefits from a time decay that is slower, beneficial if expecting a medium-term price ascent. Furthermore, the non-excessive in-the-money options manage the risk of assignment during this period.
Long-Term Options (Expiration: 2025-01-17)
Fourth Choice: - Buy Call Option: Strike Price = 52.5, Delta = 0.6412 - Sell Call Option: Strike Price = 55.0, Delta = 0.5729
This pair benefits from higher deltas than the previous choices, indicating a stronger reaction to stock price movements. Time value is more significant here, and longer expiration dates can provide more buffer against time decay, although the premium is relatively higher.
Very Long-Term Options (Expiration: 2026-01-16)
Fifth Choice: - Buy Call Option: Strike Price = 50.0, Delta = 0.7104 - Sell Call Option: Strike Price = 55.0, Delta = 0.6404
Lastly, the longer-term options offer exposure to substantial price movements over an extended period. The delta values indicate a more symmetrical risk profile, and the longer expiration date allows time for adjustments in case of adverse price movements.
In summary, the selected options span near-term to very long-term, ensuring diverse opportunities to optimize profitability while managing assignment risks. The chosen deltas ensure that options are not excessively in-the-money but still within a range that captures meaningful price movements. These pairings also maximize the return on investment by keeping the premium costs in check while anticipating incremental price movements in MNST's stock.
Spread Option Strategy
To craft the most profitable calendar spread options strategy for Monster Beverage Corporation (MNST) while mitigating the risk of having shares assigned, we need to consider both our long call options and short put options. A calendar spread generally involves taking advantage of differing expiration dates, thus benefiting from time decay (theta) and volatility (vega) changes over time. Our strategy will involve buying a long call and selling a short put, both aiming to capitalize on the expectation that MNST will move within a 2% range of the current price.
Near-Term Option Strategy 1. Long Call (2024-06-21, $49.0 Strike): - Delta: 0.7266 - Gamma: 0.0288 - Vega: 5.5882 - Theta: -0.0588 - Premium: $5.6 - ROI: 0.1294 - Profit: $0.7248
Short Put (2024-06-21, $25.0 Strike): - Delta: -0.0105 - Gamma: 0.0014 - Vega: 0.4672 - Theta: -0.0078 - Premium: $0.16 - ROI: 100.0% - Profit: $0.16
Analysis: This combination minimizes risk because of low delta put and reasonably priced calls. The put option at a $25 strike has a very low delta, which reduces the likelihood of assignment, and the long call offers a decent balance of potential profit and relative safety with its strike price.
Medium-Term Option Strategy 2. Long Call (2025-01-17, $37.5 Strike): - Delta: 0.9999 - Gamma: NA - Vega: 0.0 - Theta: -0.0043 - Premium: $17.5 - ROI: 0.0186 - Profit: $0.3248
Short Put (2025-01-17, $27.5 Strike): - Delta: -0.0309 - Gamma: 0.0030 - Vega: 3.1067 - Theta: -0.0031 - Premium: $0.2 - ROI: 100.0% - Profit: $0.2
Analysis: This medium-term strategy features a deep in-the-money (ITM) long call with high delta, almost ensuring intrinsic value, paired with a low delta, low-risk put option. The $27.5 strike short put significantly minimizes assignment risk while generating reasonable premium income.
Long-Term Option Strategies: 3. Long Call (2025-06-20, $55.0 Strike): - Delta: -0.3969 - Gamma: 0.0241 - Vega: 21.8619 - Theta: -0.0046 - Premium: $5.0 - ROI: 63.1040 - Profit: $3.1552
Short Put (2025-06-20, $35.0 Strike): - Delta: -0.1457 - Gamma: 0.0062 - Vega: 12.9658 - Theta: -0.0091 - Premium: $0.6 - ROI: 100.0% - Profit: $0.6
Analysis: For a longer-term perspective, the $55.0 strike call for a June 2025 expiration provides an attractive profit margin and considerable theta decay benefits. The short put at $35 has a moderate delta, which still lowers the risk of assignment but offers better premium income.
- Long Call (2026-01-16, $50.0 Strike):
- Delta: -0.2635
- Gamma: 0.0183
- Vega: 22.8813
- Theta: -0.0027
- Premium: $4.4
- ROI: 100.0%
- Profit: $4.4
Short Put (2026-01-16, $40.0 Strike): - Delta: -0.0966 - Gamma: 0.0095 - Vega: 11.9885 - Theta: -0.0018 - Premium: $1.02 - ROI: 100.0% - Profit: $1.02
Analysis: This long-term combination mitigates risk with moderately ITM long calls while generating substantial premium from the short put. Here, the $50 call's far expiration, paired with a moderately safe $40 short put, ensures minimized assignment risk and maximized returns.
- Long Call (2026-01-16, $55.0 Strike):
- Delta: -0.3659
- Gamma: 0.0203
- Vega: 26.3555
- Theta: -0.0027
- Premium: $5.7
- ROI: 67.6351
- Profit: $3.8552
Short Put (2026-01-16, $42.5 Strike): - Delta: -0.1902 - Gamma: 0.0099 - Vega: 19.0208 - Theta: -0.0045 - Premium: $2.2 - ROI: 100.0% - Profit: $2.2
Analysis: This choice benefits from higher potential gains on the long call side, while the short put at $42.5 offers considerable premium income with an acceptable delta to minimize assignment risk. The choice of expiration ensures ample time decay leverage and lower exposure risks as the stock price fluctuates.
In summary, the suggested calendar spread choices across near to long-term horizons leverage both delta and vega sensitivities to maximize profit while ensuring manageable exposure to the risk of share assignment. The combination of carefully selecting long call strikes relative to short put strikes optimizes the return considerations given the projected modest price movement of MNST within a 2% range.
Calendar Spread Option Strategy #1
A calendar spread options strategy, involving the purchase of a long-dated put option and the sale of a short-dated call option at different expiration dates, can be optimized by analyzing the various "Greeks" and expected profits. This strategy aims to profit from the difference in time decay (theta) between the two options while managing risks associated with the potential assignment of shares. Given our constraint of minimizing assignment risk, we need to select strike prices carefully to avoid the in-the-money portion beyond our expected 2% move in the stock price. Below are five choices spanning near-term to long-term options:
- Near-Term Trade: Long Put 2024-06-21, Strike 85.0; Short Call 2024-09-20, Strike 55.0
- Long Put Option: The put at the 85.0 strike for 2024-06-21 expiration has a delta of -0.9999907929, indicating almost a dollar-for-dollar move with the underlying stock price, ensuring significant protection and hedging benefits. Its theta is relatively stable and the rho value reflects modest sensitivity to interest rate changes.
-
Short Call Option: The call at the 55.0 strike for 2024-09-20 expiration has a delta of 0.5333784034, which places it out-of-the-money with a manageable assignment risk, given it is two standard deviations away from the current price and sufficient time value decay advantage (theta of -0.0161727994) to earn significant premiums.
-
Medium-Term Trade: Long Put 2025-01-17, Strike 90.0; Short Call 2024-12-20, Strike 57.5
- Long Put Option: Selecting a put at the 90.0 strike expiring on 2025-01-17, the delta of -0.9999355518 implies nearly complete protection from downside movements. This option's high rho suggests significant interest rate sensitivity, suitable for longer-term coverage.
-
Short Call Option: The call at the 57.5 strike expiring on 2024-12-20 has a delta of 0.4814114137, still relatively out-of-the-money, and possessing a high theta that suggests robust time decay benefits. This will offer good premium income with minimal assignment risk due to its time to maturity and strike location.
-
Intermediate Long Trade: Long Put 2025-06-20, Strike 67.5; Short Call 2024-12-20, Strike 60.0
- Long Put Option: The put at the 67.5 strike for 2025-06-20 expiration has a delta of -0.7377140624, offering good protection and a favorable gamma suggesting it becomes more responsive as it moves in-the-money.
-
Short Call Option: The call with a strike of 60.0 expiring on 2024-12-20 has a delta of 0.4021078453. This option is sufficiently out-of-the-money to minimize the assignment risk and benefit from high theta decay (-0.0125036982), providing ample premium rides.
-
Long-Term Strategy: Long Put 2026-01-16, Strike 55.0; Short Call 2025-06-20, Strike 70.0
- Long Put Option: The long put at 55.0 strike, expiring 2026-01-16, with a delta of -0.6403902041, balances deep protection with lower premium costs. This long-dated put is appropriate for anticipated modest volatility over the long term.
-
Short Call Option: The call at 70.0 strike, expiring on 2025-06-20, with a delta of 0.3324051036 indicates it is well out-of-the-money, providing an attractive theta factor (-0.0102097411) that will enable significant premium decay with minimal risk of being assigned.
-
Extended Long-Term Trade: Long Put 2026-01-16, Strike 52.5; Short Call 2025-01-17, Strike 70.0
- Long Put Option: The put with a 52.5 strike price maturing on 2026-01-16 has a delta of -0.6786378789, ensuring thorough protection. This position captures a gradual, extended decay profile suitable for sustained periods of market analysis.
- Short Call Option: The call with a strike at 70.0, expiring on 2025-01-17, has a delta of 0.1812663809. It is far out-of-the-money, with beneficial time decay (-0.0074970049), favoring premium collection without significant risk of assignment.
These choices offer a balance between potential profit from premium decay (theta) and protection from adverse movements in MNST's stock price, aligning with the calendar spread strategys objective while meticulously avoiding substantial assignment risks. Each example addresses different time horizons, providing versatility depending on market expectations and risk tolerance.
Calendar Spread Option Strategy #2
When analyzing the options chain for Monster Beverage Corporation (MNST) with a focus on a calendar spread strategy where you sell a put option at one expiration date and buy a call option at a different expiration date, it becomes crucial to balance profitability with risk minimization. Specifically, we want to target scenarios where the part of the trade that is in the money risks having shares assigned. Considering our target stock price is 2% over or under the current stock price, I have selected several options that present the best mix of profitability and manageable risks. Here are five strategy choices based on expiration dates and strike prices:
- Near Term Strategy:
-
Sell a put option - Expiration: June 21, 2024, Strike price: $55.00
- Delta: 0.4577, Premium: $1.10, ROI: 100%, Profit: $1.1
- This put option has a relatively lower delta at 0.4577, indicating a lower probability of being exercised compared to deeper in-the-money puts. The premium is modest but decent when compared to the short-term risk.
-
Buy a call option - Expiration: June 21, 2024, Strike price: $85.00
- Delta: -0.9999, Premium: $4.00, ROI: 6.4188, Profit: $25.6752
- This deep in-the-money call option has a delta of -0.9999, offering a high probability of intrinsic value. The ROI and profit potential are substantial.
-
Medium Term Strategy:
-
Sell a put option - Expiration: September 20, 2024, Strike price: $60.00
- Delta: 0.3006, Premium: $1.15, ROI: 100%, Profit: $1.15
- This put option with a delta of 0.3006 provides a good balance between premium and the likelihood of assignment. Maintaining a lower delta reduces the risk of assignment while still capturing a noteworthy premium.
-
Buy a call option - Expiration: September 20, 2024, Strike price: $70.00
- Delta: -0.7621, Premium: $9.00, ROI: 0.63057, Profit: $5.6752
- With a high delta, this call option offers a significant upside with moderate risk, assuming the stock price movement aligns with our 2% target window.
-
Long Term Strategy:
-
Sell a put option - Expiration: January 17, 2025, Strike price: $80.00
- Delta: 0.2415, Premium: $0.30, ROI: 100%, Profit: $0.30
- Selling this out-of-the-money put with a delta of 0.2415 leverages high theta decay while maintaining low risk due to its further expiration and its far out-of-the-money positioning.
-
Buy a call option - Expiration: January 17, 2025, Strike price: $105.00
- Delta: -0.9999, Premium: $10.20, ROI: 3.8701, Profit: $39.4752
- This in-the-money call option provides the potential for good profit with the safety of intrinsic value due to its deep in-the-money status. A higher premium justifies its longer expiration time frame.
-
Extended Long Term Strategy:
-
Sell a put option - Expiration: June 20, 2025, Strike price: $55.00
- Delta: 0.6078, Premium: $7.10, ROI: 100%, Profit: $7.10
- This option has a higher delta and substantial premium, reflecting the increased risk of being assigned, which can be managed with strategic capital allocation.
-
Buy a call option - Expiration: June 20, 2025, Strike price: $67.5
- Delta: -0.7377, Premium: $11.3, ROI: 0.077, Profit: $0.8752
- This option offers a mitigated risk with balanced delta, targeting profitability within a moderately in-the-money position over an extended period.
-
Ultra Long Term Strategy:
-
Sell a put option - Expiration: January 16, 2026, Strike price: $62.5
- Delta: 0.5448, Premium: $6.3, ROI: 100%, Profit: $6.3
- This long-duration option offers a good premium with manageable delta, ensuring the strategy remains profitable over a more extended timeline.
-
Buy a call option - Expiration: January 16, 2026, Strike price: $80.0
- Delta: -0.8322, Premium: $22.07, ROI: 0.118, Profit: $2.6052
- This choice balances risk and potential, with sufficient time for the option to appreciate, provided the stock price moves as projected.
Overall, these choices reflect a diversified approach, balancing risk elements while capitalizing on strategic premiums across different expiration periods. This diversified strategy mitigates the likelihood of stock assignment while optimizing the potential for profitability aligned with the market outlook for Monster Beverage Corporation.
Similar Companies in Beverages - Non-Alcoholic:
The Vita Coco Company, Inc. (COCO), PepsiCo, Inc. (PEP), Report: The Coca-Cola Company (KO), The Coca-Cola Company (KO), Coca-Cola FEMSA, S.A.B. de C.V. (KOF), National Beverage Corp. (FIZZ), Celsius Holdings, Inc. (CELH), Keurig Dr Pepper Inc. (KDP), Coca-Cola Europacific Partners PLC (CCEP), Primo Water Corporation (PRMW), Coca-Cola Consolidated, Inc. (COKE), Constellation Brands, Inc. (STZ), Boston Beer Company, Inc. (SAM)
https://www.youtube.com/watch?v=McPzW6YZRsg
https://finance.yahoo.com/news/monster-beverage-nasdaq-mnst-hoping-110026509.html
https://finance.yahoo.com/news/monster-beverage-corporation-commences-modified-120000524.html
https://finance.yahoo.com/news/monster-beverage-launches-3-billion-144502235.html
https://www.youtube.com/watch?v=_qvzXZplbS0
https://finance.yahoo.com/m/db8a1aab-a36a-3e9c-8f96-60134919d6f8/the-ultimate-growth-stock-to.html
https://finance.yahoo.com/news/monster-beverage-corporation-nasdaq-mnst-130315571.html
https://finance.yahoo.com/news/monster-energy-enlisted-aide-award-181500542.html
https://finance.yahoo.com/news/insiders-monster-beverage-sold-us-120013856.html
https://finance.yahoo.com/news/monster-energy-employees-volunteer-orange-131500050.html
https://www.sec.gov/Archives/edgar/data/865752/000141057824000605/mnst-20240331x10q.htm
Copyright © 2024 Tiny Computers (email@tinycomputers.io)
Report ID: WA0VrH
Cost: $0.54637
https://reports.tinycomputers.io/MNST/MNST-2024-05-16.html Home