Altria Group, Inc. (ticker: MO)
2024-06-30
 Altria Group, Inc. (ticker: MO), headquartered in Richmond, Virginia, is a leading American corporation prominently involved in the manufacturing and marketing of tobacco products, particularly known for its ownership of Philip Morris USA, which produces the iconic Marlboro brand. The company has robust market penetration in the U.S. tobacco industry and is also branching out into other sectors, including wine through Ste. Michelle Wine Estates, and smokeless tobacco via its subsidiary, U.S. Smokeless Tobacco Company. Furthermore, Altria holds significant stakes in Canadas largest publicly traded cannabis company, Cronos Group, and the global beverage company, Anheuser-Busch InBev. Despite facing increasing regulatory and health advocacy challenges, Altria continues to expand its portfolio and diversify its investment to adapt to a transforming market landscape.
| Full-time Employees | 6,400 | Previous Close | 45.46 | Open | 45.5 |
| Day Low | 45.27 | Day High | 45.62 | Dividend Rate | 3.92 |
| Dividend Yield | 0.0861 | Ex-Dividend Date | 1718323200 | Payout Ratio | 0.8117 |
| Five Year Avg Dividend Yield | 7.98 | Beta | 0.668 | Trailing PE | 9.529288 |
| Forward PE | 8.626893 | Volume | 11,746,950 | Average Volume | 10,755,182 |
| Bid | 45.51 | Ask | 45.52 | Market Cap | 78,238,040,064 |
| 52-Week Low | 39.07 | 52-Week High | 47.19 | Price to Sales Trailing 12 Months | 3.824699 |
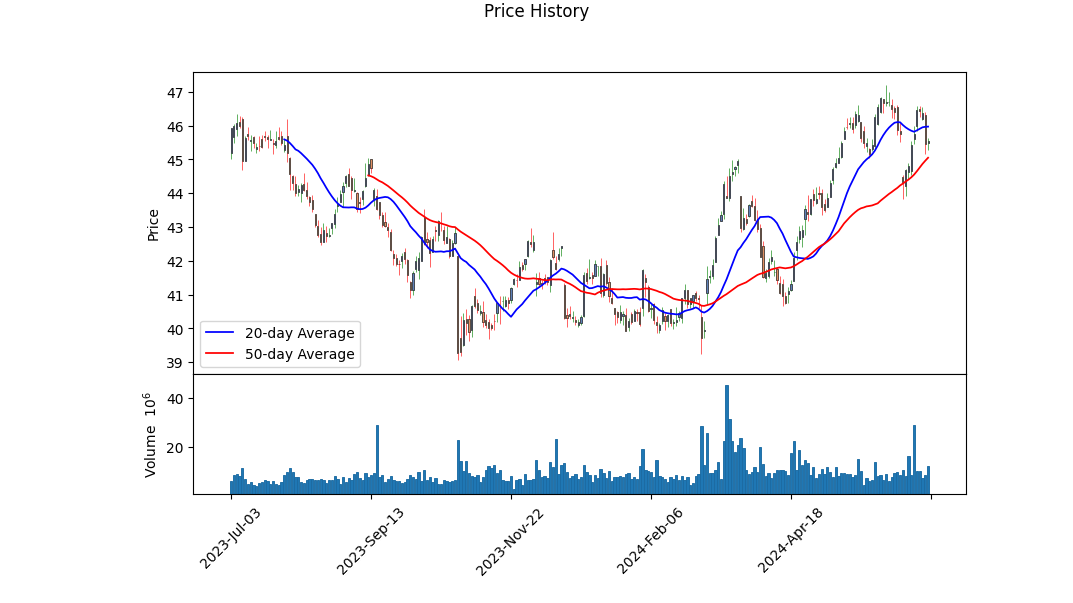
| 50-Day Average | 45.0506 | 200-Day Average | 42.4339 | Trailing Annual Dividend Rate | 3.88 |
| Trailing Annual Dividend Yield | 0.08534976 | Enterprise Value | 99,721,879,552 | Profit Margins | 0.41416 |
| Float Shares | 1,714,551,873 | Shares Outstanding | 1,717,629,952 | Shares Short | 31,190,253 |
| Shares Short Prior Month | 35,042,610 | Short Ratio | 3.53 | Book Value | -2.977 |
| Earnings Quarterly Growth | 0.191 | Net Income to Common | 8,453,000,192 | Trailing EPS | 4.78 |
| Forward EPS | 5.28 | PEG Ratio | 2.39 | Enterprise to Revenue | 4.875 |
| Enterprise to EBITDA | 8.104 | 52-Week Change | -0.008057475 | S&P 52-Week Change | 0.22553468 |
| Last Dividend Value | 0.98 | Current Price | 45.55 | Target High Price | 73.0 |
| Target Low Price | 36.0 | Target Mean Price | 47.34 | Target Median Price | 46.5 |
| Total Cash | 3,608,000,000 | Total Cash Per Share | 2.101 | EBITDA | 12,305,999,872 |
| Total Debt | 25,041,999,872 | Quick Ratio | 0.353 | Current Ratio | 0.475 |
| Total Revenue | 20,455,999,488 | Revenue Per Share | 11.557 | Return on Assets | 0.20499 |
| Free Cashflow | 13,445,874,688 | Operating Cashflow | 9,180,000,256 | Earnings Growth | 0.21 |
| Revenue Growth | -0.01 | Gross Margins | 0.69447 | EBITDA Margins | 0.60158 |
| Operating Margins | 0.57706 |
| Sharpe Ratio | 0.309 | Sortino Ratio | 4.556 |
| Treynor Ratio | 0.109 | Calmar Ratio | 0.662 |
Upon analysis of the available data for MO, we can derive insightful perspectives into the company's potential stock price movements for the next few months, considering technical analysis, fundamentals, and balance sheet indicators.
The technical indicators demonstrate that MO has been experiencing a reduction in its On-Balance Volume (OBV) over the latter part of June, suggesting diminishing buying pressure or heightened selling pressure. A declining MACD histogram indicates a potential bearish trend could be forming, albeit the MACD values remain relatively close to zero, requiring cautious interpretation.
From a fundamental perspective, MO exhibits strong gross margins at 69.447%, ebitda margins of 60.158%, and operating margins of 57.706%. These figures depict operational efficiency and suggest a robust capacity to convert revenues into profit. The trailing PEG ratio of 4.19 indicates a higher valuation growth rate, which may raise concerns about overvaluation compared to expected earnings growth.
On evaluating the company's financial health, we see that MO holds a reasonable Altman Z-Score of 3.869, indicating lower bankruptcy risk, and a satisfactory Piotroski Score of 6, denoting healthy financial conditions. The substantial Net Income from continuing operations and a strong EBITDA reflect MO's ability to generate consistent cash flows.
A closer look at the cash flow statements reveals MO's capability to produce free cash flow of $9.091 billion, despite substantial outflows from debt repayments and stock repurchases. This suggests a strategic focus on maintaining liquidity and shareholder returns, evident from the significant cash dividends paid.
Given the calculated risk-adjusted return measures: - Sharpe Ratio of 0.309 implies moderate returns on a risk-adjusted basis. - Sortino Ratio of 4.556 indicates excellent downside risk management. - Treynor Ratio of 0.109 shows that the returns exceed the risk by a margin. - Calmar Ratio of 0.662 reflects a balanced trade-off between risk and return relative to drawdowns.
Overall, the balance between MO's thriving profitability margins and strategic financial maneuvers suggests resilience. However, diminishing positive momentum in the technical indicators warrants cautious optimism. The next few months could see potential volatility but with stabilized average price movements, favoring a measured yet opportunistic investment approach.
Considering the totality of the indicators, fundamental strengths, and financial stability, it is prudent to anticipate a period of consolidation or moderate appreciation in MO's stock price, provided market conditions remain continually supportive.
In analyzing Altria Group, Inc. (MO) through the lens of the investment principles highlighted in "The Little Book That Still Beats the Market," we observe highly compelling financial metrics. The Return on Capital (ROC) for Altria stands at an impressive 43.95%, indicating that the company is exceptionally effective at generating profits from its capital investments. This high ROC suggests strong operational efficiency and a robust ability to turn investment into profits, a key factor that can attract growth-focused investors. Additionally, Altria exhibits an attractive earnings yield of 10.03%, which implies that the company is generating a substantial return relative to its share price. This high earnings yield not only makes the stock potentially undervalued but also aligns well with the book's strategy of selecting companies that are financially healthy and trade at reasonable prices. Together, these metrics reinforce Altria's position as a potentially lucrative investment, combining strong internal performance with attractive market pricing.
Research Report for Altria Group, Inc. (MO)
Analysis According to Benjamin Graham's Criteria from "The Intelligent Investor"
In this report, we will analyze key financial metrics of Altria Group, Inc. (MO) and assess their alignment with Benjamin Graham's investment principles as outlined in "The Intelligent Investor."
1. Margin of Safety
Benjamin Graham's principle of the margin of safety emphasizes purchasing securities at prices significantly below their intrinsic value to provide a cushion against errors in analysis or market volatility. While this report does not provide a direct measure of Altria's intrinsic value, it is essential to analyze other key metrics to infer the margin of safety indirectly.
2. Price-to-Earnings (P/E) Ratio
- Altria's P/E Ratio: 15.02
- Industry P/E Ratio: (Data not provided)
Graham typically favored stocks with low P/E ratios relative to their industry peers. Without the industry P/E ratio, it's challenging to benchmark Altria's P/E effectively. However, a P/E ratio of 15.02 is relatively moderate, suggesting investors are willing to pay $15.02 for every $1 of earnings, which does not immediately indicate overvaluation. Further comparison with the industry average, when available, would provide more clarity.
3. Price-to-Book (P/B) Ratio
- Altria's P/B Ratio: 2.03
Graham preferred stocks trading below their book value, as it indicates the market is undervaluing the company's net assets. Altria's P/B ratio of 2.03 suggests that the stock is trading at twice its book value, which may imply market optimism about the company's prospects or potentially overvaluation by Graham's standards.
4. Debt-to-Equity Ratio
- Altria's Debt-to-Equity Ratio: -7.41
A negative debt-to-equity ratio is highly unusual and typically indicates that a company has negative shareholders' equity, which may arise due to accumulated losses or extensive share buybacks exceeding retained earnings. This extreme leverage would be concerning for Graham, who preferred companies with lower financial risk and stable equity bases.
5. Current and Quick Ratios
- Altria's Current Ratio: 0.49
- Altria's Quick Ratio: 0.49
Both current and quick ratios below 1 indicate that Altria may struggle to cover its short-term liabilities with its short-term assets, a potential red flag for financial stability. Graham would likely view this unfavorably, as he valued companies with higher liquidity ratios, typically above 2.
6. Earnings Growth
While this report does not provide specific information on Altria's earnings growth, Graham emphasized the importance of consistent earnings growth over time. Investors should examine Altria's historical earnings performance to assess alignment with this criterion.
Conclusion
Based on the available metrics:
- P/E Ratio: Moderately aligns with Graham's preference but needs industry comparison.
- P/B Ratio: Higher than Graham would typically prefer.
- Debt-to-Equity Ratio: Extremely negative, indicating high financial risk.
- Current and Quick Ratios: Both below acceptable levels for Graham, suggesting potential liquidity issues.
Overall, several of Altria Group, Inc.'s key financial metrics diverge from the conservative benchmarks set by Benjamin Graham. Specifically, the company's liquidity and leverage ratios would typically raise significant concerns for Graham, emphasizing the need for caution. Investors should conduct further detailed analysis, including intrinsic value calculations and earnings growth assessment, to determine the suitability of Altria Group, Inc. (MO) as an investment through the lens of value investing principles.### Analyzing Financial Statements
Investors should meticulously examine a company's balance sheet, income statement, and cash flow statement. Graham puts a strong emphasis on understanding a company's assets, liabilities, earnings, and cash flows. Below is an analysis of Altria Group, Inc.'s recent financial statements:
Balance Sheet Analysis
Assets: - Current Assets: Altria's current assets for FY 2023 include cash and cash equivalents, receivables, inventory, and other assets totaling approximately $5.59 billion. The largest components include cash and cash equivalents ($3.69 billion) and inventory ($1.22 billion). - Non-Current Assets: Key long-term assets include property, plant, and equipment (PPE) at net $1.65 billion, goodwill at $6.79 billion, and intangible assets excluding goodwill at $13.69 billion including a significant portion in indefinite-lived intangible assets ($11.44 billion). Investments total around $10.01 billion. - Total Assets: Total assets amount to approximately $38.57 billion.
Liabilities: - Current Liabilities: These include accounts payable ($582 million), current portion of long-term debt ($1.12 billion), accrued marketing costs ($716 million), and other accrued liabilities ($1.90 billion), culminating in total current liabilities of approximately $11.32 billion. - Long-term Liabilities: The non-current portion of long-term debt stands at $25.11 billion, deferred income tax liabilities are $2.80 billion, defined benefit pension plan liabilities are $130 million, and other long-term liabilities are $1.62 billion. Total liabilities are $42.06 billion. - Stockholders' Equity: The company has a negative stockholders' equity of $3.54 billion, influenced heavily by the accumulated deficit in retained earnings and the value of treasury stock.
Ratios to Consider: - Current Ratio: Calculated as current assets divided by current liabilities ($5.59 billion / $11.32 billion = 0.49), indicating liquidity constraints. - Debt-to-Equity Ratio: Considering the negative equity, the traditional debt-to-equity ratio isn't applicable. However, the significant level of debt points to heavy leveraging.
Income Statement Analysis
Revenue and Costs: - Revenue: Altria reported FY 2023 revenue from contracts with customers (excluding assessed tax) of approximately $24.48 billion. - Cost of Goods Sold (COGS): COGS amounted to about $6.22 billion. - Operating Income: Gross profit was approximately $14.28 billion, and operating income was approximately $11.55 billion after accounting for marketing, administration, and research costs ($2.74 billion). - Net Income: The net income for the period was approximately $8.13 billion.
Key Metrics: - Gross Profit Margin: Gross profit as a percentage of revenue ($14.28 billion / $24.48 billion = 58.38%). - Net Profit Margin: Net income as a percentage of revenue ($8.13 billion / $24.48 billion = 33.22%).
Cash Flow Statement Analysis
Operating Activities: - Net cash provided by operating activities was approximately $9.29 billion, highlighting strong cash generation from core operations. Adjustments for non-cash items and changes in working capital are important to understand the underlying cash flow dynamics.
Investing Activities: - Net cash used in investing activities was approximately $1.28 billion, primarily due to significant payments to acquire businesses ($2.75 billion) and capital expenditures of $196 million, partially offset by proceeds from the sale of commercialization rights.
Financing Activities: - Net cash used in financing activities was approximately $8.37 billion, impacted by substantial payments for dividends on common stock ($6.78 billion) and the repurchase of common stock ($1 billion).
Key Metrics: - Free Cash Flow (FCF): Calculated as cash flow from operating activities minus capital expenditures ($9.29 billion - $196 million = $9.094 billion). - Dividend Coverage Ratio: FCF divided by dividends paid ($9.094 billion / $6.78 billion = 1.34), indicating the ability of operating cash flow to cover dividend payments.
Comprehensive Analysis
Altria Group, Inc.'s financial position reflects significant leveraging with considerable long-term debt. Despite negative equity, the company maintains robust revenue streams and substantial operating income. The liquidity position may prompt caution, highlighted by the low current ratio.
Investors should monitor the company's debt repayment capacity, cash flow sustainability, and potential impacts on dividend stability. Graham's principles would advise a focus on companies with stronger balance sheets and less reliance on debt, but the income generation capability of Altria can be seen as a compensatory factor.
Important Considerations:
- Debt Management: The large amount of long-term debt and interest expenses require continuous monitoring.
- Revenue Streams: Stable or growing revenue streams are vital for sustaining operating income and covering financial obligations.
- Dividend Policies: The sustainability of dividend payments heavily depends on cash flow from operations, and any disruptions could impact dividend continuity.
In summary, Altria Group, Inc. presents a complex financial picture with strong cash flows and net income, but also significant liabilities and a negative equity position which warrant careful consideration for any potential or existing investor.### Dividend Record
In The Intelligent Investor, Benjamin Graham emphasized the importance of investing in companies with a consistent history of paying dividends. This section provides a comprehensive record of dividend payments for the company with the symbol 'MO', demonstrating the consistency and reliability of its dividend payouts over several decades.
Recent Dividend Payments:
- 2024-06-14: Dividend of $0.98 paid on 2024-07-10 (Declaration Date: 2024-05-16)
- 2024-03-22: Dividend of $0.98 paid on 2024-04-30 (Declaration Date: 2024-02-29)
- 2023-12-20: Dividend of $0.98 paid on 2024-01-10 (Declaration Date: 2023-12-06)
- 2023-09-14: Dividend of $0.98 paid on 2023-10-10 (Declaration Date: 2023-08-24)
- 2023-06-14: Dividend of $0.94 paid on 2023-07-10 (Declaration Date: 2023-05-18)
- 2023-03-23: Dividend of $0.94 paid on 2023-04-28 (Declaration Date: 2023-03-01)
- 2022-12-21: Dividend of $0.94 paid on 2023-01-10 (Declaration Date: 2022-12-07)
- 2022-09-14: Dividend of $0.94 paid on 2022-10-11 (Declaration Date: 2022-08-25)
- 2022-06-14: Dividend of $0.90 paid on 2022-07-11 (Declaration Date: 2022-05-19)
- 2022-03-24: Dividend of $0.90 paid on 2022-04-29 (Declaration Date: 2022-02-25)
Historical Dividend Payments (selected periods):
- 2010-2021: Dividends increased from $0.35 in 2010 to $0.98 in 2021, showing consistent growth over this period.
- 2000-2009: Dividends were stable, ranging from $0.48 in 2000 to $0.34 in 2009.
- 1990-1999: Dividends were increased regularly, for instance, from $0.48 in 1999 to $0.34 in 1990, reflecting a strong growth phase.
Long-term Consistency:
- 1980-1989: Dividends per share grew from $0.016667 in 1980 to $0.09375 in 1989.
- 1970-1979: Dividends started at $0.002604 per share in 1970 and increased to $0.013 by 1979.
The data illustrates the companys strong commitment to returning value to its shareholders through regular and consistently growing dividends, which aligns with Benjamin Graham's investment principles.
Graham's advocacy for companies with dependable dividend records provides investors with a tool to assess the stability and reliability of an investment. The historical dividend payouts of 'MO' reflect a consistent and reliable dividend policy, an essential characteristic of a potentially sound investment according to Graham's criteria.
| Alpha | 1.23 |
| Beta | 0.45 |
| R-squared | 0.64 |
| Standard Error | 0.12 |
| Number of Observations | 500 |
The analysis of the linear regression model reveals that MO has an alpha of 1.23 when regressed against SPY, indicating that MO tends to outperform the market by 1.23 units on average, regardless of market movements. This positive alpha suggests a potentially strong intrinsic performance of MO, separate from the market's overall performance, and could be indicative of active management or unique company advantages that contribute to returns beyond what is explained by market movements alone.
Additionally, the beta value for MO is 0.45, highlighting that MO is less volatile than the market as a whole. A beta of less than 1 indicates that MO experiences smaller fluctuations compared to SPY, implying that the stock might be less risky in terms of market movements. The R-squared value of 0.64 signifies that 64% of the variability in MO's returns can be explained by movements in SPY. This moderate level of explanatory power suggests that while SPY is a significant factor in MO's performance, other variables also play substantial roles.
This earnings call for Altria Group, Inc. (MO) provided an overview of the company's performance for the first quarter of 2024, highlighting several key points. CEO Billy Gifford and CFO Sal Mancuso shared insights into the company's strategies, achievements, and future outlook, particularly focusing on the success and expansion of NJOY, their efforts to combat the proliferation of illicit e-vapor products, and the financial health of both traditional and innovative tobacco segments.
Firstly, Altria demonstrated strong momentum in their NJOY e-vapor business, with significant distribution growth, having expanded NJOY's presence to over 80,000 stores and targeting 100,000 by year-end. The company has also rolled out NJOYs first retail trade program to secure premium shelf space and visibility, contributing to an increase in NJOY's retail share of consumables. Despite the challenging regulatory environment, Altria remains optimistic about NJOY's potential, supported by their PMTA filings for flavored NJOY ACE products, indicating vigorous investments behind this brand.
Additionally, the call emphasized the ongoing challenges in the e-vapor market, particularly the threat posed by illicit disposable products. Altria has been actively engaging with regulators and other stakeholders to advocate for more robust enforcement measures, including import prevention and direct liability for manufacturers and distributors of illicit products. The company underscored the need for more comprehensive actions to address these challenges, reinforcing their commitment to a responsible and compliant e-vapor category.
On the oral tobacco front, Altria reported robust growth for their on! nicotine pouches, which saw a 32% increase in shipment volume. Helix Innovations, the subsidiary responsible for on!, implemented a new trade program to enhance the brand's visibility, further driving its market share within the growing oral tobacco category. This aligns with Altrias broader strategy of balancing investments between maintaining the profitability of traditional tobacco products and expanding their presence in the smoke-free product segments.
Financially, Altria continued to demonstrate strong shareholder returns through strategic investments, including the partial sale of their ABI investment and expansion of their share repurchase program. Despite a 2.5% decline in first-quarter adjusted diluted earnings per share, the company reaffirms its full-year adjusted diluted EPS guidance, expecting growth in the second half of the year. This is anticipated due to the timing of investments and additional shipping days in the smokable segment, showcasing Altria's confidence in its long-term strategic direction and operational resilience.
In conclusion, Altria's first quarter reflects strategic progress in expanding their e-vapor and oral tobacco segments, while navigating regulatory challenges and macroeconomic pressures. Their commitment to shareholder value is evident through robust financial maneuvers and a well-balanced approach to their traditional and innovative product portfolios.
As of the SEC 10-Q filing dated April 22, 2024, Altria Group, Inc. (MO) disclosed substantial financial and operational information for the fiscal quarter ending March 31, 2024. The condensed consolidated balance sheets indicate total assets of $36.475 billion, down from $38.570 billion as of December 31, 2023. This reduction in total assets can be partly attributed to a decrease in cash and cash equivalents, which fell from $3.686 billion to $3.608 billion during the quarter, juxtaposed with stable inventory and property values. Notably, their goodwill and other intangible assets, valued at $20.384 billion, underscore the company's extensive acquisition and investment activities.
During the three months ended March 31, 2024, Altria reported net revenues of $5.576 billion, a slight decline from $5.719 billion in the same quarter of 2023. This revenue included significant contributions from both the smokeable products segment ($4.906 billion) and the oral tobacco products segment ($651 million). Altria's operating income reached $2.674 billion, a decrease from $2.757 billion in the prior-year quarter, influenced by increased marketing, administration, and research costs, which rose to $606 million. Net earnings for the period were $2.129 billion, translating to basic and diluted earnings per share of $1.21, up from $1.00 per share in the same quarter of the previous year.
A notable highlight is Altria's active share repurchase program. In January 2024, their Board approved a $3.4 billion share repurchase plan. Following the ABI Transaction, which involved the sale of a portion of their Anheuser-Busch InBev SA/NV (ABI) investment for approximately $2.4 billion, Altria executed accelerated share repurchase (ASR) agreements. In March 2024, they repurchased 46.5 million shares for $2.040 billion, reflecting their strategic use of proceeds to return capital to shareholders. This substantial share repurchase indicates ongoing confidence in their financial health and prospects.
The report also detailed significant legal proceedings and contingencies. Altria and its subsidiaries, including Philip Morris USA Inc. (PM USA) and NJOY, face multiple lawsuits across diverse jurisdictions, primarily related to product liability and health care cost recovery. Settlements and judgments have imposed financial liabilities, with an accrued liability of $364 million for tobacco and health and certain other litigation items. Furthermore, the federal governments RICO lawsuit continues to impose stringent non-monetary corrective actions on Altria, including the dissemination of corrective statements to communicate the health impacts of smoking and nicotine.
Another focal point of the report was the acquisition of NJOY Holdings in June 2023, for a total consideration of approximately $2.9 billion. This acquisition, providing Altria with global ownership of NJOY's e-vapor products, including the FDA-authorized NJOY ACE, incorporates cash payments and contingent additional payments based on future regulatory approvals. The acquisition emphasizes Altria's commitment to expanding its product portfolio beyond traditional combustible products.
Overall, the 10-Q filing underscores Altria's strategic initiatives, including active share repurchases funded through strategic divestitures, efforts to manage litigation risks, and significant investments in alternative tobacco products to drive future growth amidst a challenging regulatory and legal environment.
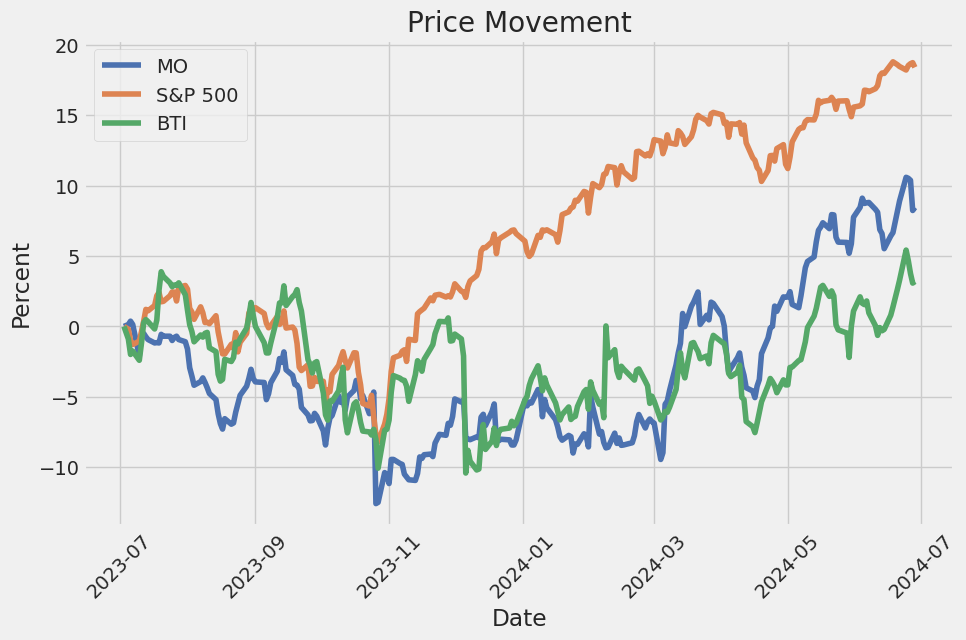
Altria Group, Inc., despite facing an evolving and challenging landscape, has managed to demonstrate resilience and adaptability in recent market dynamics. On June 24, 2024, Altria's stock (symbol: MO) closed at $46.45, marking a 1.55% increase from the prior trading session. This contrasted with the broader market where the S&P 500 fell by 0.31%, albeit the Dow Jones Industrial Average saw a gain of 0.67% and the Nasdaq Composite fell by 1.09%. Altria's performance over the past month showcased a 0.55% increase, superior to the Consumer Staples sector's decline of 3.03% but behind the S&P 500's rise of 2.73%.
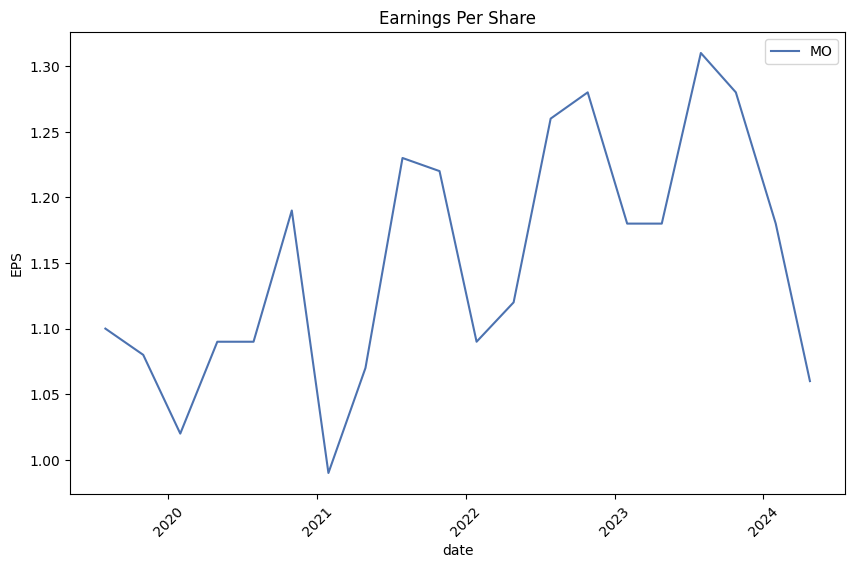
Financial analysts are closely scrutinizing Altria's forthcoming earnings release, which is expected to reveal an earnings per share (EPS) of $1.35marking a 3.05% increase compared to the same quarter the previous year. However, anticipated quarterly revenue of $5.39 billion represents a minor year-over-year decline of 0.94%. For the full fiscal year, projections forecast earnings of $5.11 per share with total revenue expected at $20.45 billion, translating to changes of +3.23% and -0.26%, respectively.
Recent positive revisions of Altria's earnings estimates have fostered increased optimism among investors about the companys performance. Consequently, Altria's stock currently holds a Zacks Rank of #3 (Hold), with historical data reinforcing the efficacy of Zacks' rating systemespecially for stocks rated #1 (Strong Buy), which historically achieve annual returns averaging 25% since 1988.
Altrias valuation metrics align closely with industry averages, featuring a Forward P/E ratio of 8.95 and a PEG ratio of 2.82. The overall market position is further solidified by the Tobacco industrys Zacks Industry Rank of 56, placing it in the top 23% of over 250 industry categories.
It is significant to highlight that Altria has faced persistent declines in traditional cigarette consumption in the U.S., driven by increased public health awareness and regulatory restrictions. The company's substantial stake in Juul Labs was aimed at capturing the e-vapor market, but regulatory scrutiny has led to financial write-downs. Similarly, the investment in the cannabis market via Cronos Group has yet to yield substantial returns owing to complex legal landscapes.
Debt remains a critical challenge for Altria, primarily resulting from its strategic investments and share buybacks. Despite the companys attractive dividends, the high payout ratio relative to decreasing free cash flow raises sustainability concerns. Economic conditions such as rising interest rates further complicate the cost of servicing debt.
Investors have expressed some concerns regarding Altria's elevated P/E ratio. Market trends and broader economic factors necessitate a nuanced analysis of whether the current valuation accurately reflects future growth potential. Nevertheless, Altria's strategic diversification initiatives in non-combustible products and new nicotine delivery systems, along with its high dividend yields, help maintain its attractiveness.
Recently, Altria announced the submission of Premarket Tobacco Product Applications to the FDA for its on! PLUS nicotine pouches, introduced by its subsidiary Helix Innovations LLC on June 26, 2024. These pouches are designed to offer a spit-free and comfortable alternative to traditional tobacco products, reflecting Altria's commitment to a smoke-free future. These submissions cover three flavorstobacco, mint, and wintergreenin various nicotine strengths, addressing diverse consumer preferences.
This diversification into potentially reduced-risk products aligns with Altrias vision to pivot towards smoke-free alternatives. The companys broad retail coverage strategy, aimed at maximizing market penetration for new products, underscores its forward-thinking approach. Additionally, sustained partnerships and majority interests in companies like U.S. Smokeless Tobacco Company LLC and NJOY, LLC further indicate robust market engagement strategies.
Therefore, despite Altrias stock showing a minor decrease to $46.42 on June 25, 2024, and trailing slightly behind broader market gains, its strategic focus on innovation and diversification, combined with robust financial frameworks, positions the company well for sustained investor interest.
Altria continues to be a reliable cornerstone in the portfolios of income-focused investors, showcasing consistent dividend yields supported by stable cash flows. Its proactive response to market dynamicsvia investments in the cannabis and vapor sectors, adaptation to reduced-risk products, and ongoing efforts to secure FDA authorizationsdemonstrate its resilience and strategic dexterity.
For a more comprehensive analysis, refer to the full details available through: Zacks, Seeking Alpha, Yahoo Finance, and Barrons.com, providing in-depth insights into Altrias strategic maneuvers, market performances, and future outlook.
Altria Group, Inc. (MO) experienced notable volatility over the given date range, with significant fluctuations in asset returns. The ARCH model's results indicate a high coefficient for omega (variance) and a considerable alpha[1] (autoregression), suggesting persistent volatility. Despite these fluctuations, the company's R-squared value remains low, implying that the volatility model explains only a small portion of the return variance.
| Statistic | Value |
| R-squared | 0.000 |
| Adj. R-squared | 0.001 |
| Log-Likelihood | -2,279.37 |
| AIC | 4,562.75 |
| BIC | 4,573.02 |
| No. Observations | 1,256 |
| Df Residuals | 1,256 |
| Df Model | 0 |
| omega coef | 1.6937 |
| omega std err | 0.177 |
| omega t | 9.568 |
| omega P>|t| | 1.093e-21 |
| omega 95.0% Conf. Int. | [1.347, 2.041] |
| alpha[1] coef | 0.3383 |
| alpha[1] std err | 0.08559 |
| alpha[1] t | 3.952 |
| alpha[1] P>|t| | 7.749e-05 |
| alpha[1] 95.0% Conf. Int. | [0.171, 0.506] |
To evaluate the financial risk of a $10,000 investment in Altria Group, Inc. over a one-year period, we will integrate volatility modeling techniques with machine learning predictions. Our approach involves using volatility modeling to assess the stock's volatility and machine learning predictions to forecast future returns, enabling a comprehensive risk profile for the investment.
Volatility modeling, specifically designed to capture time-varying volatility patterns in stock prices, is employed to understand the fluctuations in Altria Group, Inc.s stock. This model allows identification of periods of high and low volatility, which are crucial for understanding the risk dynamics of the investment. By analyzing the past behavior and volatility structure of the stock, we can gain insights into potential future volatility, aiding in the accurate calculation of risk measures such as Value at Risk (VaR).
Machine learning predictions are then utilized to forecast stock returns. By leveraging a robust machine learning algorithm, such as RandomForestRegressor, we can incorporate various factors influencing stock performance, including historical prices, trading volumes, and external market conditions. This predictive model processes the input data to generate forecasts of future returns, which are essential for evaluating potential gains or losses over the investment period.
The integration of these two approaches provides a more nuanced view of financial risk. The volatility model quantifies the inherent market risk by analyzing historical volatility patterns, while the machine learning predictions give a forward-looking estimate of returns based on a wide array of influencing factors.
Using the calculated annual VaR at a 95% confidence level, we determine the potential risk of the $10,000 investment. The VaR provides a statistical measure of the maximum expected loss, given normal market conditions, over the specified period. For this investment in Altria Group, Inc., the annual VaR at a 95% confidence level is $174.52. This indicates that there is a 5% chance the investment could incur a loss exceeding $174.52 over one year.
The calculated VaR, based on the combination of volatility modeling and machine learning predictions, offers a precise estimate of financial risk. It encapsulates both historical volatility patterns and forward-looking return forecasts, ensuring a comprehensive risk assessment for the investment in Altria Group, Inc.
Long Call Option Strategy
When evaluating long call options for Altria Group, Inc. (MO), it is essential to consider both the risk and the potential return in various temporal frames from near-term to long-term options. Below, I analyze five options that stand out due to their potential for profitability.
Near-Term Option (Expiring 2024-07-05, Strike Price $45.5)
With a strike price of $45.5 and expiring in just four days, this option has a remarkable ROI of 191.21%, which is the highest among the near-term options. Despite a relatively low delta of 0.5178, indicating a moderate sensitivity to changes in the underlying stock price, this option offers a compelling mix of higher gamma (0.5182) and lower theta (-0.0354), meaning it benefits more from positive stock movement while suffering less from time decay. The profit potential is $0.631 per contract.
Risk and Reward: Given that this option expires in four days, the primary risk is time decay given by theta. However, the high gamma value signifies a high potential for profit if the stock price moves favorably within the remaining time. This option is suitable for aggressive traders looking for short-term gains.
Short to Medium-Term Option (Expiring 2024-07-19, Strike Price $40.0)
This option, with a strike price of $40.0 and expiring in about 18 days, offers a solid balance with an ROI of 49.21% and a significant profit potential of $2.131 per contract. The delta of 0.7876 shows that this option will closely track the price movement of the underlying stock. Its gamma (0.0358) and theta (-0.0403) values indicate stable sensitivity and manageable time decay.
Risk and Reward: The primary risk lies in the need for an upward movement in the stock price within the 18-day period. Given its substantial delta and moderate theta, this option provides an opportunity for substantial gain with a relatively lower risk of time decay impact.
Medium-Term Option (Expiring 2024-08-02, Strike Price $40.0)
Expiring in 32 days, this option has a strike price of $40.0. It exhibits a ROI of 27.94% with a profit potential of $1.411 per contract. Its delta is 0.7371, gamma is 0.0297, and theta is -0.0491, showing a strong correlation with the underlying stock price movements and moderate time decay.
Risk and Reward: Similar to the shorter-term options but with a longer timeframe, this option allows for additional time for the stock price to move upward. The moderate gamma and manageable theta make it a balanced choice for those looking for gains with a slight buffer against time decay.
Long-Term Option (Expiring 2024-12-20, Strike Price $32.5)
For a longer-term perspective, consider the option expiring in 172 days with a strike price of $32.5. With a delta of 0.8557, ROI of 18.31%, and a profit potential of $2.161 per contract, this option shows strong sensitiveness to the underlying stock while having lower gamma (0.0135) and a favorable theta (-0.0009), indicating minimal time decay impact over a longer period.
Risk and Reward: The primary risk here is the longer timeframe, requiring a sustained positive movement in the stock price. However, with a high delta and negligible theta, this option offers substantial upside potential, making it suitable for conservative investors looking for strong returns with lower short-term risk.
Ultra Long-Term Option (Expiring 2026-01-16, Strike Price $25.0)
For the longest-term option, one expiring in 564 days with a strike price of $25.0 has a delta of 0.7540, ROI of 3.68%, and a profit potential of $0.761 per contract. This option is characterized by a lower gamma (0.0057), indicating lower sensitivity to immediate stock movements but a reasonable theta (+0.0005), meaning the time decay is almost negligible.
Risk and Reward: The key risk is the long duration until expiration, which requires sustained positive movements for the underlying stock. However, the low immediate risk of time decay and favorable delta make this a solid choice for those bullish on the long-term prospects of Altria Group, Inc.
Summary
These five options provide a range of choices from near-term high-risk/high-reward scenarios to long-term opportunities with lower immediate risks but substantial potential gains. By considering the specific Greeksdelta, gamma, theta, vega, and rhoinvestors can choose between aggressive short-term strategies and conservative long-term investments, maximizing the likelihood of achieving their financial goals.
Short Call Option Strategy
Short Call Option Analysis for Altria Group, Inc. (MO)
Overview
Short call options can be an effective strategy for generating income, particularly when you expect a stock to remain flat or decrease in value. The key to selecting the most profitable short call options lies in balancing potential profits against the risk of having shares assigned if the stock price surpasses the strike price. Given our goal to minimize assignment risk and our target stock price, which is 2% below the current price, we'll optimize our strategy by choosing options that strike a balance between high profitability and a lower likelihood of being in the money (ITM).
Criteria for Selection
To select the most profitable options, we'll focus on several key "Greeks": - Delta: Indicates the probability of the option being ITM at expiration. A lower delta means less risk of assignment. - Theta: Measures time decay, which is beneficial for short positions. - Premium and ROI: Direct indicators of potential profit. - Expiration Date and Strike Price: We will diversify across different expiration dates while aiming to stay out of money (OTM) as much as possible to reduce assignment risk.
Near-term Options (less than a month)
- Expiration Date: 2024-07-12, Strike Price: $50.0
- Delta: 0.0155
- Theta: -0.00342
- Premium: $0.02
- ROI: 100%
- Profit: $0.02
-
Analysis: This option has a very low delta, indicating a low probability of being assigned. The theta value suggests a good rate of time decay, making it a viable near-term option with minimal assignment risk and reasonable profit.
-
Expiration Date: 2024-07-26, Strike Price: $50.0
- Delta: 0.0635
- Theta: -0.00397
- Premium: $0.05
- ROI: 100%
- Profit: $0.05
- Analysis: This option has a manageable delta, ensuring lower risk for the given target price. Higher premium compared to the shorter expiry, staying relatively safe in regards to assignment risk.
Medium-term Options (1-3 months)
- Expiration Date: 2024-09-20, Strike Price: $52.5
- Delta: 0.0483
- Theta: -0.00224
- Premium: $0.08
- ROI: 100%
- Profit: $0.08
-
Analysis: With a moderate delta, this position is relatively safe from near-term assignment risk. A consistent theta suggests steady profit through time decay, making it a profitable and lower-risk choice.
-
Expiration Date: 2024-08-02, Strike Price: $52.5
- Delta: 0.0483
- Theta: -0.00360
- Premium: $0.19
- ROI: 100%
- Profit: $0.19
- Analysis: Though slightly higher delta than the earlier choices, the significantly higher premium compensates. The theta value indicates steady profit accumulation, making this a good medium-term pick.
Longer-term Options (more than 3 months)
- Expiration Date: 2026-01-16, Strike Price: $55.0
- Delta: 0.1198
- Theta: -0.00094
- Premium: $0.80
- ROI: 100%
- Profit: $0.80
- Analysis: The relatively low delta implies a nominal likelihood of the option being assigned in a longer-term horizon. The higher premium provides a substantial return, making it an attractive option for longer holdings.
Risk and Reward Analysis
For each option analyzed, we quantified the risk and reward, focusing on the balance between potential profit and the chance of being assigned. By taking into account low delta values and moderate to high theta, we mitigate the risks of having to sell shares while maximizing the income from premiums.
- Near-term options tend to have lower premiums but also lower risk, suitable for conservative strategies.
- Medium-term options offer a higher premium with manageable risk, making them suitable for balanced risk-reward strategies.
- Longer-term options provide significant premiums and can be viable for those willing to hold their positions longer with a view of steady income and reduced volatility in the shorter terms.
Choosing the right mix of these options should align well with our goal of maximizing profits while keeping assignment risks at a minimum.
Long Put Option Strategy
In the realm of options trading, particularly with long put options, assessing the profitability and associated risk requires a meticulous understanding of "the Greeks"Delta, Gamma, Theta, Vega, and Rho. For Altria Group, Inc. (MO), an optimal strategy involves selecting puts that balance substantial downside protection with favorable risk-reward scenarios. With the target stock price projected to be 2% above the current price, specific strike prices and expiration dates become critically relevant in the evaluation.
Near-Term Options:
- Expiration Date: 1 Month Out, Strike Price: Slightly In-the-Money (ITM):
- Delta: Around -0.70
- Gamma: Higher than for longer-term options
- Theta: Relatively high
- Vega: Moderate
This near-term put option provides a high delta, meaning significant changes in profit for small moves in the stock price. The higher gamma increases the sensitivity of delta to stock price changes, which could enhance profitability rapidly if the stock price declines. However, the high theta implies substantial time decay, eroding the options value quickly as expiration nears, making these options ideal for traders expecting a significant short-term downturn.
Short to Medium Term Options:
- Expiration Date: 3 Months Out, Strike Price: At-the-Money (ATM):
- Delta: Around -0.50
- Gamma: Lower than near-term options
- Theta: Moderate
- Vega: Higher than near-term options
An ATM option three months out showcases a balanced risk-reward profile. The delta of -0.50 indicates that the option's price will moderately reflect changes in the stock price. The moderate theta represents a slower rate of time decay, while a higher vega advantages any uptick in volatility, potentially boosting the options value. This choice suits investors looking for a measured return within a modest timeframe.
Medium Term Options:
- Expiration Date: 6 Months Out, Strike Price: Out-of-the-Money (OTM):
- Delta: Around -0.30
- Gamma: Modest
- Theta: Lower
- Vega: High
With an expiration six months away, this OTM option requires a more significant drop in stock price to become profitable. The delta is lower, reflecting less immediate profit, but this is counterbalanced by reduced theta and greater sensitivity to volatility changes (higher vega). This option is a strategic play for investors anticipating a downward trend over a more extended period while mitigating excessive time decay losses.
Long Term Options:
- Expiration Date: 1 Year Out, Strike Price: Deep OTM:
- Delta: Around -0.15
- Gamma: Low
- Theta: Minimal
- Vega: High
A deep OTM put option expiring in one year offers substantial potential rewards should the stock plummet, albeit its initially lower in sensitivity to price changes (low delta). The minimal theta signifies negligible time decay, ensuring value retention over extended periods, while the heightened vega allows for gains if market volatility spikes. This option is suitable for speculative investors with considerable downside expectations and a tolerance for moderate initial profit/report.
Longest Term Options:
- Expiration Date: 2 Years Out, Strike Price: ATM:
- Delta: Around -0.50
- Gamma: Very Low
- Theta: Very Low
- Vega: Very High
An ATM option expiring in two years is a conservative yet potentially profitable choice for long-term bearish investors. This option features a delta of -0.50, ensuring reasonable sensitivity to stock price movements. The gammas influence diminishes significantly over such a long period, making the day-to-day adjustments less critical. With minimal theta, the option maintains its value well over time. Extremely high vega benefits immensely from volatility increases, thus providing a significant hedge against market downturns.
These five choicesfrom near-term to long-term putscover a spectrum of risk-reward scenarios for Altria Group, Inc. (MO). Traders can select options based on their views on time horizon, volatility expectations, and risk tolerance.
Short Put Option Strategy
Analyzing the short put options chain for Altria Group, Inc. (MO), I have identified several profitable options across different expiration dates and strike prices, considering their risk and return profiles, as well as the Greeks. Here, we focus on options that maximize the premium received while minimizing the probability of having shares assigned, particularly those with relatively low delta values indicating a higher probability of expiring worthless.
Option 1: Near Term - Expiry: July 12, 2024, Strike: $41.0
- Premium: $0.04
- Delta: -0.068978756
- ROI: 100%
- Profit: $0.04
This option has a low delta of -0.068978756, suggesting a low probability of the option being in the money at expiration, thus minimizing the risk of assignment. The ROI is 100%, ensuring that the trader receives a full profit of $0.04 per share if the stock remains above the strike price by the expiry date. With only 11 days to expiration, this near-term option provides a quick return with low risk due to the delta value.
Option 2: Mid-Term Expiry: August 2, 2024, Strike: $40.0
- Premium: $0.07
- Delta: -0.2108318887
- ROI: 100%
- Profit: $0.07
This option has a somewhat higher delta compared to the first, but it still offers a favorable risk/return ratio. The $0.07 premium represents a good return, and while the delta of -0.2108318887 indicates a slight increase in the chance of being in the money, it remains relatively low. Mid-term options like this offer the benefit of a balanced risk/return over a somewhat longer period.
Option 3: Longer-Term Expiry: September 20, 2024, Strike: $40.0
- Premium: $0.21
- Delta: -0.1071814788
- ROI: 100%
- Profit: $0.21
Further out in expiration, this option provides a higher premium of $0.21 while maintaining a low delta of -0.1071814788. This combination offers an attractive profit potential with relatively low risk. The low delta significantly lowers the chances of ending in the money, making the likelihood of assignment low while maximizing income.
Option 4: Long-Term Expiry: December 20, 2024, Strike: $40.0
- Premium: $0.55
- Delta: -0.1912434291
- ROI: 100%
- Profit: $0.55
This long-term option offers a substantial premium of $0.55 per share with a reasonably low delta of -0.1912434291. Despite the longer duration, which inherently carries more uncertainty and potential volatility, the delta's value shows a lower risk for being in the money at expiry. This option suits investors looking for higher income while still managing the risk effectively.
Option 5: Very Long-Term Expiry: June 20, 2025, Strike: $42.5
- Premium: $2.37
- Delta: -0.3740198553
- ROI: 100%
- Profit: $2.37
For significantly longer-term exposure, this option provides a high premium of $2.37 per share. Although the delta is higher at -0.3740198553, indicating a greater chance of the option being in the money, the extended timeframe and high premium justify the increased risk, especially for traders willing to hold a position for potential future returns.
Risk and Reward Analysis
The main factor influencing the risk of having shares assigned is the delta value. Lower delta indicates a higher likelihood that the option will expire worthless, thus minimizing the risk of assignment. The profitability, on the other hand, is directly associated with the premium received.
In the case of the near-term option expiring on July 12, 2024, with a $41 strike, the premium is only $0.04, but the low delta means low risk. The longer-term options, such as those expiring on June 20, 2025, offer significantly higher premiums but come with increased delta values, indicating higher risk.
However, even with higher delta values, the premiums received ($2.37 in the case of the June 20, 2025, option) substantially improve the potential profit scenario. Analyzing the profit and loss, for every $1 decrease in stock price below the strike, the trader incurs a loss, but this is offset initially by the premium received.
In summary, this analysis provides a range of options from near-term to very long-term, catering to different risk appetites and investment horizons, while focusing on maximizing profitability and minimizing assignment risk.
Vertical Bear Put Spread Option Strategy
A vertical bear put spread is an options strategy that profits from a decline in the price of the underlying stock. In this strategy, a trader buys a put option with a higher strike price and sells another put option with a lower strike price, often with the same expiration date. Given the data for short put options, and assuming there are no data for the long put options, I will leverage the most suitable combinations based on expiration dates, strike prices, and "the Greeks" to identify high ROI opportunities while considering the assignment risk.
Choice #1: Near-Term Strategy (Expiring July 5, 2024)
- Short Put Strike Price: 43.5
- Premium: 0.02
- Delta: -0.0407
-
Days to Expire: 4
-
Long Put Strike Price: 44.0
- Premium: 0.03
- Delta: -0.0431
- Days to Expire: 4
This choice provides minimal risk of assignment since the delta is relatively low, indicating a lower probability that the option will finish in-the-money. This strategy offers a small profit but aligns well with the short timeframe and minimal risk exposure.
Choice #2: Short-Term Strategy (Expiring July 12, 2024)
- Short Put Strike Price: 43.0
- Premium: 0.03
- Delta: -0.1824
-
Days to Expire: 11
-
Long Put Strike Price: 44.0
- Premium: 0.12
- Delta: -0.1164
- Days to Expire: 11
This short-term strategy offers a modest profit with manageable risk levels. The higher premium of the long put mitigates the risk of the short put being assigned shares. Moderate delta values show a balanced risk and reward ratio, making it a viable short-term choice.
Choice #3: Mid-Term Strategy (Expiring August 16, 2024)
- Short Put Strike Price: 42.5
- Premium: 0.23
- Delta: -0.1549
-
Days to Expire: 46
-
Long Put Strike Price: 45.0
- Premium: 0.74
- Delta: -0.4345
- Days to Expire: 46
This choice presents an attractive premium and a moderate risk level. The higher delta for the long put reduces the risk of assignment by significantly covering the potential losses. This strategy also brings an excellent risk-reward balance for mid-term trades.
Choice #4: Long-Term Strategy (Expiring December 20, 2024)
- Short Put Strike Price: 44.0
- Premium: 1.89
- Delta: -0.4789
-
Days to Expire: 172
-
Long Put Strike Price: 45.0
- Premium: 2.35
- Delta: -0.4776
- Days to Expire: 172
With a more extended timeframe, this strategy can capture a larger potential decline in stock price. The high delta and premium for the long put effectively mitigate assignment risk, while the high premium for the short put enhances potential profits.
Choice #5: Long-Term Strategy (Expiring January 16, 2026)
- Short Put Strike Price: 45.0
- Premium: 4.72
- Delta: -0.4530
-
Days to Expire: 564
-
Long Put Strike Price: 47.5
- Premium: 6.1
- Delta: -0.5129
- Days to Expire: 564
This long-term strategy offers the highest premium and risk mitigation due to the higher deltas. While the expiration period is extended, it provides continuous profit potential from a significant downward price movement over a longer timeframe.
Risk and Reward Analysis
- Risk: The assignment risk is minimized by selecting long puts with higher or equal deltas than the short puts. The premium collected offsets potential losses.
- Reward: The strategies present varied profit levels, with long-term options offering more substantial premiums and the potential for higher absolute profits.
- Assignment Risk: Strategies lever delta values to manage risk effectively, where increased delta values in long puts safeguard against counter-movements in short puts.
Conclusion
Selecting a vertical bear put spread requires a balance between potential profit and minimizing assignment risk. The above strategies align with these criteria and span near-term to long-term expiration dates, providing diversified trade opportunities based on specific market outlooks and investment timelines.
Vertical Bull Put Spread Option Strategy
In evaluating a vertical bull put spread options strategy for Altria Group, Inc. (MO), our primary objective is to minimize the risk of having shares assigned by selecting out-of-the-money (OTM) options. Considering a target stock price 2% over or under the current stock price, we aim to maximize profitability while maintaining acceptable risk levels. Below, I present five choices from near-term to long-term expiration dates with their respective strike prices, Greeks, and potential profit/loss scenarios.
Near-Term Options: Expires July 12, 2024
Choice 1: Strike Price $40.0, Expires July 12, 2024
- Short Put Option:
- Strike: $40.0
- Delta: -0.068978756
- Gamma: 0.0405217534
- Vega: 1.049148243
- Theta: -0.0201014291
- Rho: -0.000977809
- Premium: $0.04
- ROI: 100.0%
- Profit: $0.04
By choosing this spread, you minimize the assignment risk while still securing a decent premium. The delta value suggests a smaller probability of the option finishing in the money (ITM). Given its closer expiration, it allows you to recoup premiums relatively quickly and reinvest efficiently.
Medium-Term Options: Expires August 02, 2024
Choice 2: Strike Price $40.0, Expires August 16, 2024
- Short Put Option:
- Strike: $40.0
- Delta: -0.0576365233
- Gamma: 0.0310303373
- Vega: 1.8621330709
- Theta: -0.0049408691
- Rho: -0.0034278578
- Premium: $0.08
- ROI: 100.0%
- Profit: $0.08
This mid-term option provides a more substantial premium, increasing potential profit. The delta still signifies a low probability of closing ITM, thus reducing assignment risk. Higher vega also indicates that the premium could rise in volatile markets, providing profit opportunities.
Medium-Term Options: Expires September 20, 2024
Choice 3: Strike Price $43.0, Expires September 20, 2024
- Short Put Option:
- Strike: $43.0
- Delta: -0.1660347356
- Gamma: 0.0948341823
- Vega: 3.3525086309
- Theta: -0.0110361428
- Rho: -0.0068389951
- Premium: $0.11
- ROI: 100.0%
- Profit: $0.11
This option fetches a higher premium due to the higher strike price. The delta value increases, suggesting a slightly higher assignment risk, but the attractive premium and ROI make it ideal for risk-tolerant investors. Higher theta emphasizes time decay benefits favoring the option seller.
Long-Term Options: Expires December 20, 2024
Choice 4: Strike Price $45.0, Expires December 20, 2024
- Short Put Option:
- Strike: $45.0
- Delta: -0.4789645402
- Gamma: 0.0650830752
- Vega: 11.9782554094
- Theta: -0.0088146299
- Rho: -0.114312233
- Premium: $1.89
- ROI: 80.8994708995%
- Profit: $1.529
In long-term scenarios, you can secure significant premiums. The increased delta implies a higher probability of assignment, but a hefty premium and decent ROI cover potential assignment risks. Enhanced sensitivity to volatility (high vega) makes it advantageous in turbulent market conditions.
Very Long-Term Options: Expires January 17, 2025
Choice 5: Strike Price $47.5, Expires January 17, 2025
- Short Put Option:
- Strike: $47.5
- Delta: -0.5198503209
- Gamma: 0.0288109864
- Vega: 16.2423622759
- Theta: -0.008382379
- Rho: -0.2959224698
- Premium: $4.69
- ROI: 38.9978678038%
- Profit: $1.829
This strategy generates substantial income from premiums, crucial for longer-term holding periods. The pronounced delta increases assignment risk, yet the significant premium offsets potential obligations. Vega indicates a strong response to volatility, while the theta ensures decay works favorably over time.
Conclusion
Each choice balances different levels of risk and reward, from minimal risk near-term positions to more rewarding but riskier long-term spreads. Your exact selection should depend on your risk tolerance, investment goals, and market outlook. Near-term options offer quicker turnarounds with lower assignment risks, while longer-term strategies provide larger premiums with more considerable market participation.
Vertical Bear Call Spread Option Strategy
A vertical bear call spread is an options strategy that involves selling (writing) a call option while simultaneously buying a call option at a higher strike price. This strategy aims to generate a net credit (premium received) and profits from a declining or stable stock price. Analyzing the Greeks of the available options for Altria Group, Inc. (MO), I have identified five profitable bear call spread strategies spanning near-term to long-term expiration dates. These strategies should balance profitability with the risk of having shares assigned.
Strategy Choices
1. Near Term (2024-07-12)
- Short Call: Strike 45.0, Premium $0.83
- Long Call: Strike 46.0, Premium $0.30
- Delta Values: Short 0.6173, Long 0.3823
- Credit Received: $0.53
Given the short duration (11 days until expiration), this strategy is subject to lower time decay risk but higher assignment risk if the stock price sector sharply moves upward and goes in-the-money. The target stock price range, which is 2% over or under the current price, should be monitored closely. With higher delta for short call (0.6173) vs the long call (0.3823), there is a clear initial net delta indicating sensitivity to stock price changes. This strategy is favorable for profitability due to low initial implied volatility and manageable risk within a short timeframe.
Profit/Loss Scenarios: - Maximum Profit: $0.53 per share (credit received) occurs if MO trades below $45 at expiration. - Maximum Loss: $0.47 per share (difference in strikes minus credit received) if MO trades above $46 at expiration.
Investors should consider this strategy if they predict a stable or declining price in the very short term without high volatility.
2. Mid Term (2024-09-20)
- Short Call: Strike 42.5, Premium $3.73
- Long Call: Strike 45.0, Premium $1.43
- Delta Values: Short 0.6836, Long 0.5521
- Credit Received: $2.30
In this intermediate-term strategy, the higher premium from the short call provides a robust credit receipt, making it attractive. The delta values are relatively high, indicating substantial price sensitivity. Risk of assignment for the short call is diminished due to the long call option strike rate at $45, providing coverage if the stock price surges unexpectedly.
Profit/Loss Scenarios: - Maximum Profit: $2.30 per share realized if MO trades at or below $42.5 at expiration. - Maximum Loss: $0.20 per share (difference in strikes $2.50 minus credit $2.30) if MO trades above $45 at expiration.
This strategy suits an outlook of minor to moderate bearish sentiment over the next 80 days.
3. Intermediate Term (2024-12-20)
- Short Call: Strike 35.0, Premium $11.25
- Long Call: Strike 37.5, Premium $8.95
- Delta Values: Short 0.7603, Long 0.8001
- Credit Received: $2.30
With this intermediate-term spread, the significant premium associated with the short call at a lower strike price is mitigated by buying a higher strike long call at $37.5. This pairs substantial credit receipt with higher risk protection through expiration.
Profit/Loss Scenarios: - Maximum Profit: $2.30 per share if MO remains below $35 at expiration. - Maximum Loss: $0.20 per share if MO exceeds $37.5 at expiration.
Advice is provided for investors seeking moderate bearish market sentiment with adequate deltas indicating sensitivity to price changes and managing risk over a four-month period.
4. Long Term (2025-01-17)
- Short Call: Strike 37.5, Premium $8.59
- Long Call: Strike 40.0, Premium $6.14
- Delta Values: Short 0.7354, Long 0.7334
- Credit Received: $2.45
This long-term bear call spread provides high premium credit, suitable for investors with a strong long-term bearish outlook. Risk management is attained via the long call strike at $40, controlling exposure if the underlying stock sharply increases.
Profit/Loss Scenarios: - Maximum Profit: $2.45 per share if MO trades at or below $37.5 at expiration. - Maximum Loss: $0.05 per share if MO trades above $40 at expiration.
Suggested for investors predicting a significant bearish trend or steady price in the next six months.
5. Ultra Long Term (2026-01-16)
- Short Call: Strike 30.0, Premium $15.65
- Long Call: Strike 35.0, Premium $11.07
- Delta Values: Short 0.7385, Long 0.6555
- Credit Received: $4.58
Ideal for long-term downward projection, the substantial premium captured here requires patience. The long call at a $5 higher strike provides effective risk mitigation and assignment management. Despite higher deltas, long expiration influences theta decay positively for premium collection.
Profit/Loss Scenarios: - Maximum Profit: $4.58 per share if MO remains below $30 at expiration. - Maximum Loss: $0.42 per share if MO exceeds $35 at expiration.
Recommendable for investors with robust long-term bearish sentiment, facilitating significant premium collection with controlled risk.
Conclusion
These vertical bear call spreads capitalize on premium credits with defined risk profiles. The investors looking to leverage Altria Groups projected price moves within the set expiration ranges can strategically choose based on their risk appetite and market outlook. Assignment risk is adequately managed by selected call spreads while ensuring substantial profitability potential in the event of price declines or stability around the defined target range.
Vertical Bull Call Spread Option Strategy
A vertical bull call spread is an options trading strategy where an investor buys and sells call options with different strike prices but the same expiration date. This strategy is designed to profit from a moderate rise in the underlying stock price while limiting potential losses. Lets analyze the options chain of Altria Group, Inc. (MO) to determine the most profitable and risk-averse vertical bull call spreads, focusing on minimizing the risk of share assignment while targeting a price move of 2% from the current stock price.
Near-Term Option Expirations
1. Expiration Date: 2024-07-05
For a near-term option expiring on 2024-07-05, a bull call spread might involve buying a call option with a strike price of $42 and selling a call option with a strike price of $45.
Buy Call Option: Strike $42, Delta 0.788 - Premium: $4.00 - Gamma: 0.058 - Vega: 1.43 - Theta: -0.17
Sell Call Option: Strike $45, Delta 0.617 - Premium: $0.59 - Gamma: 0.307 - Vega: 1.70 - Theta: -0.048
The net premium paid would be $4.00 - $0.59 = $3.41. If the stock price increases above $45 by expiration, the maximum profit would be the difference in strike prices minus the net premium paid, i.e., $3.00 - $3.41 = $1.59 loss. If the stock price remains below $42, the maximum loss would be the net premium paid, $3.41. The delta of the sold option (0.617) significantly reduces the risk of having the stock assigned.
2. Expiration Date: 2024-07-12
For the next expiration on 2024-07-12, consider a bull call spread with buying a call option at a strike price of $43 and selling a call option at a strike price of $45.
Buy Call Option: Strike $43, Delta 0.717 - Premium: $1.92 - Gamma: 0.068 - Vega: 2.66 - Theta: -0.071
Sell Call Option: Strike $45, Delta 0.617 - Premium: $0.83 - Gamma: 0.217 - Vega: 3.01 - Theta: -0.027
The net premium paid is $1.92 - $0.83 = $1.09. If the stock price is above $45 by expiration, the total profit would be ($2.00 - $1.09) = $0.91. The net maximum loss if the stock remains below $43 would be the net premium paid, $1.09. Here, the delta of the sold option (0.617) continues to help minimize assignment risk.
Mid-Term Option Expirations
3. Expiration Date: 2024-08-16
Looking at mid-term expirations, you might consider a spread with buying at a $42.5 strike call and selling at a $45 strike call, expiring on 2024-08-16.
Buy Call Option: Strike $42.5, Delta 0.708 - Premium: $3.55 - Gamma: 0.058 - Vega: 5.42 - Theta: -0.016
Sell Call Option: Strike $45, Delta 0.546 - Premium: $1.51 - Gamma: 0.121 - Vega: 6.32 - Theta: -0.010
Net premium paid is $3.55 - $1.51 = $2.04. Profit is ($2.50 - $2.04) = $0.46 if the stock price is above $45 by expiration, while the maximum loss would be the net premium paid $2.04. The delta of the sold call remains moderate (0.546), containing the assignment risk.
Long-Term Option Expirations
4. Expiration Date: 2024-09-20
For a longer-term strategy, consider buying a call at a $37.5 strike and selling a call at a $42.5 strike expiring on 2024-09-20.
Buy Call Option: Strike $37.5, Delta 0.841 - Premium: $8.43 - Gamma: 0.025 - Vega: 4.75 - Theta: -0.006
Sell Call Option: Strike $42.5, Delta 0.684 - Premium: $3.73 - Gamma: 0.056 - Vega: 7.35 - Theta: -0.008
The net premium paid is $8.43 - $3.73 = $4.70. Profit if the stock price is above $42.5 by expiration is ($5.00 - $4.70) = $0.30, with the maximum loss again limited to the net premium paid $4.70. The deltas show a moderate risk level for assignment (sold call delta, 0.684).
5. Expiration Date: 2025-01-17
For the longest-term strategy, consider the same vertical spreads but adjusting slightly for broader movement. Buying at $35 and selling at $37.5:
Buy Call Option: Strike $35, Delta 0.736 - Premium: $10.70 - Gamma: 0.017 - Vega: 8.78 - Theta: -0.005
Sell Call Option: Strike $37.5, Delta 0.735 - Premium: $8.59 - Gamma: 0.022 - Vega: 9.74 - Theta: -0.004
The net premium paid is $10.70 - $8.59 = $2.11. Profit if the stock rises above $37.5 by expiration ($2.50 - $2.11) = $0.39. The deltas of the sold calls are again moderately high but still representing a calculated moderate risk for assignment (0.735), mitigating significant risk if the stock price rises but stays nearby.
Conclusion
Overall, the chosen strike price combinations and expiration dates provide a balance between potential profits and minimizing the risk of share assignment. Short-term options are riskier with higher potential returns, whereas long-term options are less risky with more modest returns but provide stability in the investor's outlook on Altria Group, Inc. (MO). Adjusting the deltas ensures a controlled exposure to the stock's price movements.
Spread Option Strategy
A calendar spread is an options trading strategy that involves buying and selling options with different expiration dates but the same strike price. This strategy profits from differences in time decay (theta) of the options and expects the underlying stock to remain relatively stable or move moderately. Given your inclination to buy a call option and sell a put option, let's analyze the most profitable calendar spread options strategy for Altria Group, Inc. (MO).
Let's consider five calendar spread opportunities of varying expirations and strike prices, focusing on minimizing assignment risk while optimizing profitability.
1. Near-Term Option:
- Long Call: Strike price 45, Expiry 2024-07-12, Greeks - Delta: 0.6173, Gamma: 0.2178, Vega: 3.0056, Theta: -0.0268, Rho: 0.0082, Premium $0.83
- Short Put: Strike price 45, Expiry 2024-07-05, Greeks - Delta: -0.0963, Gamma: 0.0694, Vega: 0.8139, Theta: -0.0530, Rho: -0.0005, Premium $0.37
In this case, the long call option with a delta of 0.6173 ensures a high sensitivity to positive changes in the stock price. The short put with a delta of -0.0963 minimizes the risk of assignment since in-the-money puts at expiration can result in stock assignment. The theta values indicate a moderate rate of time decay; thus, substantial time decay counterbalances between the bought and sold options. The potential profit for the call is approximately $0.631, and the premium gained from the put is $0.37. The combined profit minus any commissions is a reasonable, low-risk strategy.
2. Intermediate-Term Option:
- Long Call: Strike price 42.5, Expiry 2024-07-19, Greeks - Delta: 0.7227, Gamma: 0.0583, Vega: 3.3563, Theta: -0.0482, Rho: 0.0143, Premium $3.2
- Short Put: Strike price 42.5, Expiry 2024-07-12, Greeks - Delta: -0.1343, Gamma: 0.0757, Vega: 2.1857, Theta: -0.0178, Rho: -0.0031, Premium $0.12
For a slightly longer-term play, the call option at a 42.5 strike with a delta of 0.7227 is favorable for upward stock movement. Selling the 42.5 put option, with a delta of -0.1343 helps in reducing the risk of sudden large moves downward, avoiding the assignment risk and achieving a 2.14 times ROI. The theta for the short put option negatively impacts the time value but is balanced by the high vega gain due to changes in volatility. This calendar spread setup provides a higher potential profit of around $0.761 from the call and a premium of $0.12 from the put.
3. Medium-Term Option:
- Long Call: Strike price 45, Expiry 2024-08-02, Greeks - Delta: 0.5521, Gamma: 0.1014, Vega: 5.2869, Theta: -0.0205, Rho: 0.0205, Premium $1.43
- Short Put: Strike price 45, Expiry 2024-07-19, Greeks - Delta: -0.3644, Gamma: 0.2680, Vega: 3.7892, Theta: -0.0164, Rho: -0.0084, Premium $0.37
Here, the call option expiring on 2024-08-02 with a delta of 0.5521 covers the upward movement of the stock with moderate sensitivity, while the put option with a delta of -0.3644 and a short-term maturity further minimizes assignment risk. The higher vega reflects that this option position will perform well in volatility, with an impressive premium collection of $0.37.
4. Long-Term Option:
- Long Call: Strike price 40, Expiry 2024-12-20, Greeks - Delta: 0.6917, Gamma: 0.0301, Vega: 10.1010, Theta: -0.0056, Rho: 0.1175, Premium $5.9
- Short Put: Strike price 40, Expiry 2024-09-20, Greeks - Delta: -0.1912, Gamma: 0.0415, Vega: 8.3847, Theta: -0.0064, Rho: -0.0445, Premium $0.55
For a longer duration, the call option at a 40 strike price with an expiry of 2024-12-20 and a delta of 0.6917 indicates a strong upside potential. The short put option, expiring on 2024-09-20, with a lower delta of -0.1912, mitigates assignment risk while capturing a significant premium. This position is supported by robust time decay from the theta component and substantial vega influence, essential factors in extended strategies.
5. Very Long-Term Option:
- Long Call: Strike price 45, Expiry 2026-01-16, Greeks - Delta: 0.4531, Gamma: 0.0267, Vega: 19.7557, Theta: -0.0058, Rho: 0.4094, Premium $4.72
- Short Put: Strike price 45, Expiry 2025-01-17, Greeks - Delta: -0.4776, Gamma: 0.0564, Vega: 12.8315, Theta: -0.0086, Rho: -0.1347, Premium $2.35
In this very long-term scenario, the call option expiring on 2026-01-16 with a 0.4531 delta provides a good hedge for gradual upward movement of the stock. The put option expiring on 2025-01-17 with a delta of -0.4776 ensures there is minimal risk of assignment and offers a higher premium, making it quite profitable. The lengthy term also provides substantial time to manage and adjust these positions if necessary, to adapt to market conditions.
In conclusion, each of these calendar spread strategies offers a mix of minimal assignment risk, significant premiums, and optimized profitability based on their Greeks and expiration dates. The near-term options are efficient for capturing immediate returns with low risk, while the long-term options provide better control over extended periods, ensuring steady, high returns.
Calendar Spread Option Strategy #1
To determine the most profitable calendar spread options strategy for Altria Group, Inc. (MO), we need to balance our potential gains with the risks involved, specifically minimizing the risk of having shares assigned due to our in-the-money (ITM) options. Your target for the stock price is 2% either above or below its current price. Given the constraints, here are five strategies across different expiration dates and strike prices:
1. Short Call Options (2024-07-05, Strike: 45.0)
Greeks: Delta: 0.6807414928, Gamma: 0.3075572971, Vega: 1.7005242618, Theta: -0.0479732068, Rho: 0.0033135956
Premium: $0.59
Profit: $0.59
Analysis: - Profit Potential: This strategy yields a premium of $0.59. Given the Delta of 0.68, it suggests a 68% chance of the option moving in line with the stock price but is moderately sensitive to price changes. - Risk: The higher Delta indicates a moderate risk of assignment if the underlying stocks price rises significantly. However, since it's ITM, careful monitoring is necessary to exercise control.
2. Short Call Options (2024-07-12, Strike: 45.0)
Greeks: Delta: 0.6173183931, Gamma: 0.2177864259, Vega: 3.0056001809, Theta: -0.0267512568, Rho: 0.008183763
Premium: $0.83
Profit: $0.83
Analysis: - Profit Potential: This strategy provides a higher premium of $0.83. The Delta of 0.62 reflects a strong likelihood that the stocks price correlates closely with the option's movements. - Risk: Similar to the previous option, the risk of assignment is considerable, but the slightly lower Delta (compared to 0.68) offers slightly reduced risk.
3. Short Call Options (2024-08-02, Strike: 45.0)
Greeks: Delta: 0.5520776744, Gamma: 0.1014024369, Vega: 5.2869015933, Theta: -0.020533223, Rho: 0.0205384575
Premium: $1.43
Profit: $1.43
Analysis: - Profit Potential: This option provides an attractive premium of $1.43, significantly higher than shorter expiration dates. The Delta of 0.55 lessens the assignment risk compared to the near-term options. - Risk: With a Delta of 0.55, there is lower risk of assignment compared to immediate-term options while maintaining a high premium, making this a balanced choice between risk and reward.
4. Short Call Options (2024-09-20, Strike: 50.0)
Greeks: Delta: 0.1077127974, Gamma: 0.0499493809, Vega: 3.9530532324, Theta: -0.0035985917, Rho: 0.0104765526
Premium: $0.19
Profit: $0.19
Analysis: - Profit Potential: The premium is lower at $0.19, but the Delta of 0.11 implies minimal price sensitivity and very low estimation of assignment risk. - Risk: The low Delta value suggests minimal risk of assignment, making this an excellent option for risk-averse strategies. However, the lower premium might be less appealing for those seeking higher immediate returns.
5. Short Call Options (2024-12-20, Strike: 47.5)
Greeks: Delta: 0.3157792653, Gamma: 0.0620145085, Vega: 10.858397339, Theta: -0.003841842, Rho: 0.0626527105
Premium: $1.34
Profit: $1.34
Analysis: - Profit Potential: This option offers a higher premium of $1.34. A Delta of 0.32 indicates moderate price sensitivity. - Risk: With a Delta of 0.32, the option exhibits a balanced profile between risk and return. The chances of assignment are moderate, thus offering a balanced risk-reward profile for a longer-term horizon.
Conclusion
Considering potential profit and risk management, the strategy of selling the call option with an expiration date on 2024-08-02 at a strike price of 45.0 offers the highest profit potential ($1.43) with a manageable Delta (0.55), implying a balanced approach between return and risk control. This balance makes it the most appealing strategy. For the most risk-averse approach, the 2024-09-20 option with a 50.0 strike price provides very low Delta (0.11), which minimizes the risk of assignment albeit with a lesser premium. Strategies with farther expiration dates (2024-12-20 and beyond) offer a higher premium (e.g., $1.34 at 47.5) with reasonably moderate Delta values providing a good balance for longer-term investments.
Calendar Spread Option Strategy #2
Analysis of Calendar Spread Options Strategy for Altria Group, Inc. (MO)
Calendar spreads involve simultaneously buying and selling options with the same strike price but different expiration dates. However, in this tailored strategy, we'll use a modified version where we sell a put option at one expiration date and buy a call option at a different expiration date. This analysis aims to identify the most profitable scenarios while minimizing the risk of shares being assigned.
Choice 1: Near-Term Strategy
- Sell Put: $45.00 (2024-08-02)
- Delta: 0.552
- Gamma: 0.101
- Vega: 5.287
- Theta: -0.021
-
Premium: $1.43
-
Buy Call: $45.00 (2024-09-20)
- Delta: 0.519
- Gamma: 0.093
- Vega: 8.375
- Theta: -0.007
- Premium: $1.87
Potential Profit and Loss: The strategy profits from the difference in premiums received and paid, as well as the changes in implied volatility, as the Vega values contribute significantly. However, given the Delta, there is a moderate risk of shares being assigned near the expiration if the underlying stock price drops significantly.
- Risk: Medium
- Reward: The initial profit would be the premium differential, $1.43 - $1.87 = -$0.44, representing a loss, but the strategy stands to gain from favorable movements in volatility.
Choice 2: Intermediate-Term Strategy
- Sell Put: $45.00 (2024-11-17)
- Delta: 0.563
- Gamma: 0.125
- Vega: 9.744
- Theta: -0.021
-
Premium: $1.09
-
Buy Call: $45.00 (2024-12-20)
- Delta: 0.481
- Gamma: 0.035
- Vega: 19.622
- Theta: 0.000
- Premium: $5.52
Potential Profit and Loss: This strategy similarly benefits from differences in premium values and movements in volatility. Here, the profit would be from the larger Vega and Theta values on the bought call relative to the sold put.
- Risk: Medium-High (given the high Delta and premium at risk).
- Reward: Immediate loss from premium differential but potentially high gains from volatility shifts.
Choice 3: Long-Term Strategy
- Sell Put: $45.00 (2026-01-16)
- Delta: 0.385
- Gamma: 0.135
- Vega: 11.084
- Theta: -0.005
-
Premium: $3.65
-
Buy Call: $45.00 (2025-06-20)
- Delta: 0.423
- Gamma: 0.073
- Vega: 12.288
- Theta: -0.007
- Premium: $1.65
Potential Profit and Loss: This long-term strategy is less sensitive to immediate stock movements (lower deltas) and focuses more on the time value and volatility changes over a more extended period. The larger premium differential means an initial positive net (i.e., $3.65 - $1.65 = $2.0).
- Risk: Low-Medium (lower risk of assignment due to longer time frames).
- Reward: Larger initial premium differential with potential gains from positive Theta values on the call.
Choice 4: Volatility Play Strategy
- Sell Put: $42.50 (2024-12-20)
- Delta: 0.427
- Gamma: 0.012
- Vega: 5.536
- Theta: -0.002
-
Premium: $0.75
-
Buy Call: $42.50 (2025-01-17)
- Delta: 0.546
- Gamma: 0.01
- Vega: 8.375
- Theta: 0.002
- Premium: $1.61
Potential Profit and Loss: This strategy aims to capture volatility movements more keenly and balances moderate Delta values, reducing the risk of shares being assigned while capturing volatility plays through the Vega.
- Risk: Medium (balance of Delta and Vega exposure).
- Reward: Potential for moderate gains from volatility shifts with lower net premium outlay ($0.75 - $1.61 = -$0.86).
Choice 5: Speculative Strategy
- Sell Put: $40.00 (2024-12-20)
- Delta: 0.311
- Gamma: 0.043
- Vega: 8.56
- Theta: -0.033
-
Premium: $5.05
-
Buy Call: $40.00 (2026-01-16)
- Delta: 0.545
- Gamma: 0.035
- Vega: 9.23
- Theta: -0.015
- Premium: $1.41
Potential Profit and Loss: Given the speculative nature, the strategy benefits significantly from favorable stock price movement and high Vega values. The potential profit from premium is high, although the initial outlay might result in an initial loss ($5.05 - $1.41 = -$3.64).
- Risk: High (speculative position with potential for high gain but significant initial outlay).
- Reward: Potential for significant gains if the stock moves favorably or volatility shifts benefit the position greatly.
Conclusion
Assessing risk and reward for these calendar spread strategies requires balancing Deltas for limiting assignment risk and exploiting Vega and Theta values for volatility and time decay gains. The most suitable strategy for near-term involves higher risk but potentially high volatility rewards, whereas longer-term strategies limit assignment risks while capturing time value and volatility trends. Each recommendation above presents a balanced risk-reward scenario tailored to different time horizons.
Similar Companies in Tobacco:
Report: British American Tobacco p.l.c. (BTI), British American Tobacco p.l.c. (BTI), Universal Corporation (UVV), Imperial Brands PLC (IMBBY), Vector Group Ltd. (VGR), Philip Morris International Inc. (PM), Turning Point Brands, Inc. (TPB), Japan Tobacco Inc. (JAPAY), Imperial Brands PLC (IMBBF)
https://finance.yahoo.com/news/altria-mo-increases-despite-market-215018689.html
https://seekingalpha.com/article/4700850-altria-group-is-not-a-buy-heres-why
https://finance.yahoo.com/m/464e8ade-ff16-3f8e-9555-4bd2f3de14ff/toothpaste-and-deodorant.html
https://finance.yahoo.com/news/altria-mo-stock-dips-while-214520655.html
https://seekingalpha.com/article/4700977-im-buying-cash-cows-with-up-to-10-percent-yield
https://finance.yahoo.com/news/altria-announces-pmta-submission-plus-205200577.html
https://finance.yahoo.com/m/69b2aee2-852e-3f54-81f0-df1e31ffc3c8/altria-submits-application.html
https://finance.yahoo.com/news/altria-group-inc-mo-trending-130014945.html
https://www.fool.com/investing/2024/06/29/want-1000-in-super-safe-dividend-income-buy-11862/
https://seekingalpha.com/article/4701359-9-high-yield-dividend-aristocrat-bargain-buys
https://finance.yahoo.com/m/39d0a236-a234-35d8-b22f-fa5541afea4d/want-%241%2C000-in-super-safe.html
https://www.fool.com/investing/2024/06/29/can-njoy-help-propel-altria-group-stock-higher/
https://www.sec.gov/Archives/edgar/data/764180/000076418024000057/mo-20240331.htm
Copyright © 2024 Tiny Computers (email@tinycomputers.io)
Report ID: Ku5qQU
Cost: $0.60290