Morgan Stanley (ticker: MS)
2024-01-27
 Morgan Stanley (ticker: MS) is a preeminent global financial services firm that provides a wide array of services, including investment banking, securities, wealth management, and investment management. The company, with its headquarters in New York City, has a significant presence in more than 41 countries, serving clients ranging from corporations, governments, institutions to individuals. As of the latest reporting period, Morgan Stanley has demonstrated robust financial performance, exemplified by strong earnings, diversified revenue streams, and strategic acquisitions that expand its wealth and asset management capabilities. In recognition of the evolving financial landscape, Morgan Stanley has also been at the forefront of integrating advanced technology and sustainable finance practices into its service offerings. Notably, the firm's stock (MS) is closely watched by investors who value its historical stability, consistent dividend payouts, and potential for strategic growth in the constantly changing financial sector.
| Full Time Employees | 80,006 | Previous Close | 88.02 | Open | 87.88 |
| Day Low | 87.65 | Day High | 88.4991 | Dividend Rate | 3.4 |
| Dividend Yield | 0.0388 | Payout Ratio | 0.6274 | Five Year Avg Dividend Yield | 2.88 |
| Beta | 1.413 | Trailing PE | 16.936295 | Forward PE | 11.936055 |
| Volume | 6,276,962 | Average Volume | 8,763,645 | Average Volume 10days | 12,349,480 |
| Market Cap | 143,992,127,488 | Fifty Two Week Low | 69.42 | Fifty Two Week High | 100.99 |
| Price To Sales TTM | 2.685869 | Fifty Day Average | 86.0212 | Two Hundred Day Average | 84.53465 |
| Trailing Annual Dividend Rate | 3.325 | Trailing Annual Dividend Yield | 0.03777551 | Shares Outstanding | 1,641,309,952 |
| Book Value | 55.084 | Price To Book | 1.5926585 | Profit Margins | 0.16950001 |
| Gross Margins | 0.86474997 | Operating Margins | 0.30009001 | Net Income To Common | 8,529,999,872 |
| Trailing EPS | 5.18 | Forward EPS | 7.35 | PEG Ratio | 1.72 |
| Total Cash | 541,129,015,296 | Total Debt | 379,196,997,632 | Total Revenue | 53,610,999,808 |
| Debt To Equity | 378.599 | Revenue Per Share | 32.931 | Return On Equity | 0.09166 |
| Earnings Growth | -0.332 | Revenue Growth | 0.018 | Current Price | 87.73 |
| Sharpe Ratio | -16.449302859323804 | Sortino Ratio | -266.47386984813613 |
| Treynor Ratio | -0.030543740979822803 | Calmar Ratio | -0.20262230689179342 |
The last day's Technical Analysis provides a critical snapshot into the current sentiment and momentum within the stock under consideration. On the final observed trading day, there was a negative MACD histogram at -0.522682, which can indicate a slowing momentum or a potential bearish shift for the stock. One important technical aspect absent from the provided data is the actual MACD line positions in relation to the signal line, which would offer comprehensive insights into the immediate trend characteristic.
The underlying fundamentals play a significant role, shaping intrinsic value perceptions. The revenue and gross margins suggest relative operational efficiency, but the Piotroski Score of 3 indicates a weak financial position, further substantiated by a low Altman Z-Score of 0.16257378700360178. This signals a potential risk of financial distress. The balance sheet reflects a sizable amount of debt with net debt at 153.469 billion USD, and continued growth in treasury shares suggests an active buyback program may be reducing equity liquidity, potentially providing some upward price pressure.
Risk-adjusted return ratios (Sharpe, Sortino, Treynor, and Calmar) are deeply negative. These measures indicate that on a risk-adjusted basis, the stock has been underperforming relative to both the broader market and its inherent volatility. Such thermometers of portfolio performance highlight an unfavorable investment temperature over the year's horizon.
Analyst expectations reveal a fairly positive future outlook, with projected earnings and revenue growth over the following year. Yet the EPS trends and revisions present a mix of slight downward adjustments for the next year. This indicates that analysts are recalibrating their forecasts, albeit with continued positive growth expectations. Additionally, the anticipated growth rates for the current and following year show that analysts predict robust earnings improvements, which could entice optimistic sentiment.
In conclusion, recent stock price dynamics, coupled with technical indicators such as the negative MACD histogram, suggest a near-term cautious approach is warranted. The high gross margins and projected growth harmonize a more optimistic outlook on fundamental grounds, but the negative risk-adjusted performance ratios and low financial health scores tint this view with realism.
Investors should be mindful of the high debt levels and the risk of financial distress signaled by the Altman Z-Score, even with a sound revenue baseline. With projected earnings growth on the horizon and a positive angle from analysts expectations, the stock may encounter mixed movements in the next months opportunities may arise if the company can leverage its earnings growth while managing its vast debt.
However, given the negative risk-adjusted return ratios and the relatively unfavorable scores that assess financial solvency and operational efficiency, it is recommended to proceed with caution especially for risk-averse portfolios. It is likely that any substantial upside potential will be moderated by the need to carefully navigate through the underlying financial vulnerabilities and debt obligations that characterize the current financial state of the company.
| Statistic Name | Statistic Value |
| Dep. Variable: | y |
| R-squared: | 0.599 |
| Adj. R-squared: | 0.599 |
| F-statistic: | 1,876 |
| Prob (F-statistic): | 1.92e-251 |
| No. Observations: | 1,257 |
| AIC: | 4,423 |
| BIC: | 4,434 |
| Coef of const: | 0.0117 |
| Std err of const: | 0.040 |
| t-value of const: | 0.295 |
| P>|t| of const: | 0.768 |
| Coef of MS: | 1.3037 |
| Std err of MS: | 0.030 |
| t-value of MS: | 43.318 |
| P>|t| of MS: | 0.000 |
| Lower 95% of MS: | 1.245 |
| Upper 95% of MS: | 1.363 |
| Omnibus: | 241.186 |
| Prob(Omnibus): | 0.000 |
| Skew: | 0.853 |
| Prob(JB): | 1.34e-221 |
| Kurtosis: | 7.063 |
| Cond. No.: | 1.32 |
The linear regression model explores the relationship between Morgan Stanley (MS) and the SPDR S&P 500 ETF (SPY), where the SPY ETF represents the broader market performance. Over the observed period, the model's R-squared value of 0.599 indicates that approximately 59.9% of MS's variability can be explained by the changes in the SPY index. With an alpha (constant term) of 0.0117, and its t-value being statistically insignificant with a p-value of 0.768, this suggests that when SPY's returns are zero, MS's returns are not significantly different from zero after considering the effect of the overall market. As a specific measure, alpha represents the return that MS provides over and above (or below) the market return that is not attributed to the market's volatility or movements. With the current alpha value close to zero and statistically insignificant, MS does not seem to provide a return independent of the market's performance.
Furthermore, the model's beta (coefficient of MS) value of 1.3037 indicates a statistically significant positive relationship with the market - for every one percent increase in SPY, MS is expected to increase by about 1.3037 percent, holding other factors constant. The beta represents the stock's sensitivity to market movements, and in this case, MS has a beta greater than one, suggesting it is more volatile than the market. A beta greater than one is associated with greater potential returns, but also higher risk, as the stock would be expected to outperform when the market does well, and underperform when the market does poorly. The high F-statistic and its negligible probability suggest the overall model's validity is highly significant, enabling confident interpretation of the relationship between MS and SPY.
Morgan Stanley Earnings Call Summary:
CEO Remarks (Ted Pick): - Ted Pick is succeeding James Gorman as CEO and commits to maintaining the strategy and transparency established during Gorman's tenure. - Morgan Stanley has evolved significantly over the past 15 years, showing resilience and growth through various economic challenges. - The firm has made strategic acquisitions, including Smith Barney, Solium, E*TRADE, and Eaton Vance, leading to business diversification, and increased client assets and profitability. - In 2023, Morgan Stanley reported revenues of $54 billion, a pretax profit (PBT) of $12 billion, and a return on tangible common equity (ROTCE) of 13%. - Wealth and investment management reached 60% of the firm's revenue and PBT, indicating a strong position for growth, while the institutional securities business continued to invest in its leading franchises. - Ted Pick emphasized Morgan Stanley's role as a trusted advisor and global leader in helping clients manage capital and noted the firm's potential for further growth in client assets, aiming for $10 trillion in total client assets.
Wealth and Investment Management: - Revenues from wealth and investment management have more than doubled since 2010. - Client assets have more than tripled to $6.6 trillion, and the firm aims to reach $10 trillion in assets. - Wealth management has expanded through three channels: advisor-led, self-directed, and workplace. - The firm focuses on growing and deepening its 18 million client relationships, expecting variability in net new asset (NNA) growth due to market conditions but confident in its wealth management offering. - The wealth platform is complemented by investment management, which has added new capabilities such as customization and private markets.
Institutional Securities Group: - The Institutional Securities Group is a leading global franchise offering a wide range of services, including advising on M&A transactions and capital raising. - Over the last decade, the firm has advised on nearly $9 trillion in M&A transactions and raised almost $13 trillion for clients. - The integrated investment bank aims to expand its corporate finance activity to drive growth. - The group focuses on providing a full breadth of capabilities to its global client base, given the high barriers to entry and reduced number of competitors in the investment banking space.
Integrated Firm and Culture: - Morgan Stanley is aiming to function as an integrated firm that efficiently facilitates client opportunities, capital flow, and delivery of firmwide solutions. - The firm covers the needs of corporate clients, individual investors, and small institutions while continuing to invest in financial innovation and growth. - Leadership is prioritizing the integrated firm approach, and the operating and management committees have significant tenure, supporting a differentiated partnership culture. - The firm's success throughout the years highlights the importance of human capital and maintaining a partnership culture.
Financial Capital and Goals: - Morgan Stanley has a strong capital position and expects regulatory requirements to continue to decrease, reflecting business resilience. - The firm is committed to the dividend as a reflection of business model durability and aims to balance growth opportunities, client support, and stock repurchase. - Morgan Stanley has four firmwide goals: reaching $10 trillion in client assets, achieving a 30% wealth management pretax margin, a 70% firmwide efficiency ratio, and 20% returns on tangible equity.
CFO Remarks (Sharon Yeshaya):
- Revenue for 2023 was $54.1 billion with an ROTCE of 12.8% and EPS of $5.18. The efficiency ratio was 77.2%, impacted by notable items totaling nearly $900 million.
- Institutional securities generated $23.1 billion in full-year revenues, influenced by a weak investment banking environment.
- Wealth management revenues were $26.3 billion for the full year with a 24.9% PBT margin, reflecting interest rate rises and associated shifts in client behavior.
- Client assets hit a new high of $5.1 trillion, with full-year fee-based flows of $109 billion.
- Investment management reported full-year revenues of $5.4 billion, with AUM rising year-over-year to $1.5 trillion despite long-term net outflows due to headwinds in active equity growth strategies.
- The firm is maintaining focus on managing expenses, optimizing long-term efficiency, and driving towards performance goals.
Morgan Stanley's SEC 10-Q filing is a detailed report encompassing a range of financial data and disclosures that provide insights into the company's performance for the quarterly period ending September 30, 2023. Within this comprehensive document, the firm reports its financial position, including assets, liabilities, shareholders' equity, and other critical accounting figures that are essential for investors and analysts in determining the firm's economic health.
The filing includes the company's consolidated balance sheets, which offer a snapshot of its financial condition. These statements display the total amounts of assets, both current and non-current, and match them against the company's liabilities and shareholders' equity at a specific point in time. Morgan Stanley meticulously itemizes its various asset classes, such as cash and cash equivalents, securities borrowed, and receivables from clients, brokers, and dealers. On the liabilities side, the company breaks down its obligations into categories such as debt, payables, and other financial liabilities. Shareholders' equity is also dissected into common stock, retained earnings, and accumulated other comprehensive income, providing a clearer picture of the company's financing sources and the accumulated results of its operations over time.
The income statement, another crucial component of the 10-Q filing, reveals the firm's revenues, expenses, and profits or losses. Revenue sources are highlighted, including net interest income, non-interest revenues from trading, investment banking, investment management, and other sources. The firm also declares its expenses, which involve interest on borrowed funds, employee compensation, and business development costs. The final net income figure delineates the profitability of the company for the assessed period, after accounting for all applicable taxes and expenses.
The report expounds on the firm's cash flows for the quarter, documenting the cash produced or used in operating, investing, and financing activities. The operating cash flows reflect the money the firm generates from its regular business operations, net of its operating expenses. Cash flows from investing activities indicate the capital expenditures or proceeds from the sale of assets, investments, or acquisitions. Financing activities' cash flows highlight changes in debt levels, equity financing, dividend payments, and buybacks of outstanding shares.
Additionally, the 10-Q provides extensive notes on the company's financial statements, elucidating accounting policies, contingent liabilities, business risks, and other relevant information that can impact the interpretation of the financial data. These notes may include details on valuation methods, fair value measurements of financial instruments, segment reporting, legal proceedings, and tax-related contingencies that are crucial for a more in-depth analysis of the company's financial conditions and results.
Importantly, this filing offers Morgan Stanley's management discussion and analysis (MD&A), wherein the company's executives analyze the financial condition and results of operations, providing context and management perspectives. This section often accommodates insights into the business environment, market trends, operational strategies, and potential factors affecting future profitability. The MD&A aims to provide investors a view from the helm of the company, often addressing market risks, liquidity concerns, capital resources, and any known trends or uncertainties that could bear on Morgan Stanleys performance.
In summary, Morgan Stanley's SEC 10-Q filing is a rich document designed to communicate the robustness of the company's financial health and business activities in a transparent and detailed manner, as the firm navigates the dynamic economic landscape. It serves as an indispensable tool for stakeholders looking to evaluate the company's past performances and forward-looking statements in making informed investment and business decisions.
As of early 2024, Morgan Stanley has been navigating through a transitional phase with significant leadership changes, coupled with strategic decisions that highlight the company's versatility and foresight in the global financial services sector.
The imminent retirement of James Gorman as CEO marks the end of a significant era for Morgan Stanley. Gorman, credited with steering Morgan Stanley through various market upheavals, including the 2008 financial crisis and the COVID-19 pandemic, has been a pivotal figure in the company's success. His tenure as CEO saw the firm branching out into wealth management, a move that fortified the companys market position, further cemented by the acquisitions of Smith Barney, E*TRADE, and Eaton Vance. Gorman's reflexive leadership and management style, emphasizing accountability and the capacity to make challenging decisions, set a precedent at Morgan Stanley for robust growth and stability. He is set to assume the role of Executive Chairman, where he plans to support incoming CEO Ted Pick (YouTube Interview).
Ted Pick, ascending from within the trading and investment banking divisions, confronts a distinct set of challenges as he takes the helm. One of the imminent tasks is guiding the firms wealth management division, which has flourished under Gormans leadership. Morgan Stanley's wealth management performance notably sets it apart from competitors, such as Bank of America with Merrill Lynch. The success and synergy in this area continue to distinguish Morgan Stanley within the financial landscape (YouTube Video).
Morgan Stanley's ongoing diversification is not just domestic. The companys operations in Japan are anticipating record income, buoyed by a resurgence in the trading environment instigated by policy shifts from the Bank of Japan. This optimistic outlook is substantiated by Alberto Tamura, CEO of Morgan Stanley MUFG Securities Co., underlining the potent collaboration between Morgan Stanley and Mitsubishi UFJ Financial Group (MUFG). Even as there are no immediate plans for a full merger with MUFG, the existing relationships have fostered a strong platform for growth (Zacks.com).
On the corporate governance front, Gorman's extensive experience will become a significant asset to The Walt Disney Company, where he is slated to influence the selection of Disney's next CEO (Proactive Investors).
Amidst the leadership transition, the sophistication of the firm's operations has also been placed into the spotlight. Analysts project that Morgan Stanley, with its disciplined financial practices and aim for strategic efficiency, is journeying well above the $100 mark. This outlook largely feeds off the firm's timely decision to shed unprofitable businesses and streamline operations, marking it as a "lean, mean fighting machine. This fiscal robustness and resilience, especially within the wealth management sector, have affirmed Morgan Stanley's strong prospects in the eyes of investors and analysts (YouTube Video).
The firm's stock performance provides a mixed picture. A recent surge in Morgan Stanley's stock value was observed following signals from the Federal Reserve's potential shift in interest rate hikes. Coupled with expected reductions in funding costs and a promising financial outlook, this was perceived as a bullish sign among investors. Morgan Stanley's stock appreciated by 6.3% in a trading session, signaling robust market confidence (Zacks.com).
Conversely, in the period since December 8th, Morgan Stanley's stock marked a decline of about 12%. Regulatory challenges and the intricacies of the Basel III finalization are among the fiscal complexities that the new leadership will have to tackle. These adjustments, along with the varying challenges tackled by counterparts in different industries, such as Starbucks and Tesla, place a critical emphasis on effective leadership in steering companies in these transformative times (YouTube link).
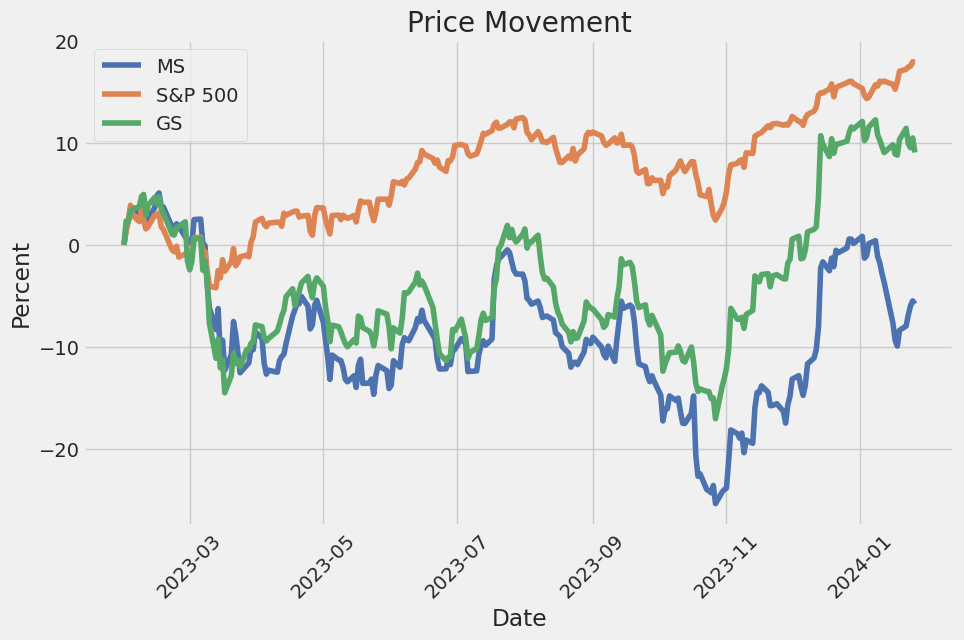
Despite such ebb and flow, Morgan Stanley remains an investor favorite, reflected in the 18% increase in share value compared to the S&P 500's 5.3% change. However, the mixed earnings projections, with the Zacks Consensus Estimate indicating a downward revision for the upcoming quarter, have earned it a Zacks Rank #4 (Sell) (Zacks.com).
Analyst opinions about Morgan Stanley are indeed diversified, with some like Exane BNP Paribas showing caution and others like Oppenheimer echoing a sense of confidence. The mixed shelf filing last month has added another dimension to the firm's capital structure and investment appeal, underscoring the need for a thorough assessment of such strategic maneuvers by investors (Benzinga.com).
Assessing its industry position, Morgan Stanley outperformed with a 20.76% surge in shares, outpacing the Finance sector's and S&P 500's advances. This robust performance and forthcoming earnings announcement indicate a focused watch by the financial community, despite facing a challenging competitive landscape positioned within the bottom 10% of industries (Zacks.com). Analysts project an EPS of $1.15 for the upcoming earning report, with a moderate revenue increase expected (Zacks.com).
In tandem with this financial journey, Morgan Stanley seeks to expand wealth management globally, with Asia and Japan as focal regions. Gorman, reflective of strategic planning and operational wisdom, poisedly comments on the geopolitical spectrum, projecting a softer landing for the Federal Reserve's rates later in the year. Gorman expresses his anticipation for personal endeavors, including furthering his role in academia and involvement with educational institutions like Columbia University (Morgan Stanley Interview).
Overall, Morgan Stanley is at a juncture where past achievements meld with future aspirations, encapsulated in the leadership transition and strategic shifts, both domestically and internationally. This orchestration of factors presents a financial institution that is steadfast in adapting, growing, and staying ahead in an increasingly complex global market.
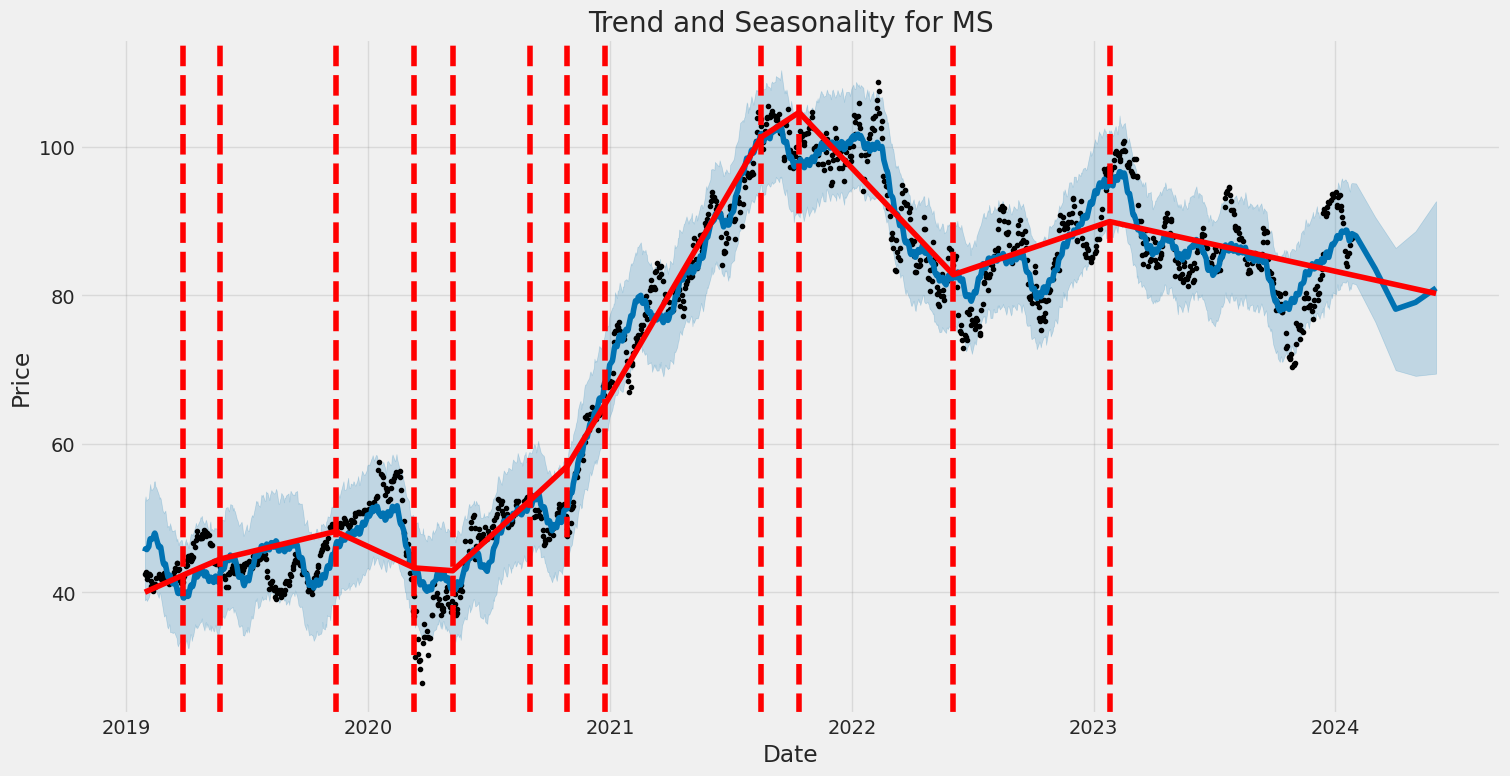
Morgan Stanley (MS) demonstrated a level of volatility over the given period from 2019 to 2024, as measured by an ARCH model, which is a tool used to predict and understand the variance in financial data over time. The ARCH (Autoregressive Conditional Heteroskedasticity) model points to a persistent presence of volatility, with an omega value of 2.9068 indicating a basic level of variance. Additionally, the alpha coefficient of 0.3487 suggests that past volatility has a moderately significant impact on future volatility, reflecting the tendency of volatility to cluster over time.
| Statistic Name | Statistic Value |
|---|---|
| R-squared | 0.000 |
| Adj. R-squared | 0.001 |
| Log-Likelihood | -2,638.67 |
| AIC | 5,281.34 |
| BIC | 5,291.61 |
| No. Observations | 1,257 |
| Df Residuals | 1,257 |
| omega | 2.9068 |
| alpha[1] | 0.3487 |
In analyzing the financial risk of a $10,000 investment in Morgan Stanley (MS) over a one-year period, a two-pronged approach uses volatility modeling and machine learning predictions. Volatility modeling, a statistical technique for forecasting future volatility based on past price data, is a fundamental step in this analysis. By accounting for time-varying volatility and mean-reversion, this method effectively captures the dynamics of Morgan Stanley's stock price movements.
Initial steps involve using historical stock prices of Morgan Stanley to fit the volatility model, allowing for the isolation of periods of high and low volatility. This approach identifies patterns in the fluctuation of returns, which is crucial in assessing the level of risk associated with the investment. The model parameters, once estimated, can be used to simulate future price volatility over the investment horizon.
On the other hand, machine learning predictions involve a sophisticated algorithm trained on historical data to forecast future stock returns. By extracting features from the data such as past price movements, volume, and potentially exogenous variables such as market indices or economic indicators, the algorithm can learn complex patterns and generate predictions about the future direction of Morgan Stanley's stock price. The forecasted returns are a reflection of both the underlying company's performance and market conditions.
Combining the insights from volatility modeling and machine learning predictions helps in constructing a comprehensive view of the dynamic risk profile of the Morgan Stanley investment. This is particularly valuable for evaluating the potential downside, which is often encapsulated in risk metrics like the Value at Risk.
The calculated Value at Risk (VaR) for a $10,000 investment in Morgan Stanley at a 95% confidence interval stands at $267.54. This metric suggests that, given normal market conditions, there is a 95% confidence level that the investor will not lose more than $267.54 over the one-year period. Conversely, there is a 5% probability of experiencing losses exceeding that amount. The use of volatility modeling in this calculation primarily assesses the degree of uncertainty or risk about returns, while machine learning predictions contribute to understanding the direction and magnitude of potential future returns.
This financial risk assessment indicates that while the investor may have confidence in the stability of their Morgan Stanley investment to a large extent, it is nonetheless exposed to potential downside risks, which should be taken into consideration when managing an investment portfolio.
Similar Companies in Capital Markets:
The Goldman Sachs Group, Inc. (GS), Riot Blockchain, Inc. (RIOT), Marathon Digital Holdings, Inc. (MARA), Applied Digital Corporation (APLD), Hut 8 Mining Corp. (HUT), CleanSpark, Inc. (CLSK), Bit Digital, Inc. (BTBT), Bitfarms Ltd. (BITF), Evercore Inc. (EVR), Lazard Ltd (LAZ), Moelis & Company (MC), PJT Partners Inc. (PJT), Stifel Financial Corp. (SF), Netcapital Inc. (NCPL), TOP Financial Group Limited (TOP), Magic Empire Global Limited (MEGL), JPMorgan Chase & Co. (JPM), Report: Bank of America Corporation (BAC), Bank of America Corporation (BAC), Citigroup Inc. (C), Wells Fargo & Company (WFC), The Charles Schwab Corporation (SCHW), BlackRock, Inc. (BLK), UBS Group AG (UBS), Credit Suisse Group AG (CS), Deutsche Bank Aktiengesellschaft (DB)
https://www.youtube.com/watch?v=h17sk1vCzYg
https://www.proactiveinvestors.com/companies/news/1036960?SNAPI
https://seekingalpha.com/article/4658377-sfprd-vs-mspro-better-choice-revisited-plus-1
https://www.youtube.com/watch?v=mqstqZrU2aA
https://seekingalpha.com/article/4659818-2-reits-that-could-soar-in-2024
https://www.youtube.com/watch?v=_bIJuMUToMk
https://www.youtube.com/watch?v=zGsnCfzqWx0
https://seekingalpha.com/article/4660602-my-top-10-high-yield-dividend-stocks-for-january-2024
https://www.zacks.com/stock/news/2204680/morgan-stanley-ms-rises-as-market-takes-a-dip-key-facts
https://www.youtube.com/watch?v=RdVoNlWiTjY
https://www.sec.gov/Archives/edgar/data/895421/000089542123000441/ms-20230930.htm
Copyright © 2024 Tiny Computers (email@tinycomputers.io)
Report ID: GxUsco
Cost: $0.77910