MSCI Inc. (ticker: MSCI)
2024-01-28
 MSCI Inc., identified by the ticker symbol MSCI, operates as a leading provider of investment decision support tools, including indexes, portfolio risk and performance analytics, and ESG (Environmental, Social, and Governance) products for the global financial community. The company's flagship product offerings include the MSCI indexes, such as the MSCI Emerging Markets Index and MSCI World Index, which serve as benchmarks for countless investment funds around the world. Founded in 1969, MSCI has become critical to the financial industry for providing tools that facilitate the construction and management of portfolios, as well as the understanding of risk. The company reaches a broad client base, ranging from asset managers to wealth managers, private banks, and individual investors, by delivering its services through a variety of software applications, data subscriptions, and custom solutions. MSCI's commitment to innovation and meeting evolving client needs has enabled it to maintain a prominent position in the global financial marketplace.
| Full Time Employees | 5,005 | Previous Close | 554.77 | Open | 557.09 |
| Day Low | 544.36 | Day High | 559.33 | Dividend Rate | 5.52 |
| Dividend Yield | 0.01 | Payout Ratio | 44.95% | Average Dividend Yield (5 Years) | 0.87 |
| Beta | 1.124 | Trailing PE | 45.89 | Forward PE | 37.19 |
| Volume | 558,025 | Average Volume | 372,377 | Average Volume (10 days) | 462,700 |
| Bid | 550.51 | Ask | 551.10 | Bid Size | 800 |
| Ask Size | 800 | Market Cap | 43,444,002,816 | 52 Week Low | 451.55 |
| 52 Week High | 573.32 | Price to Sales (TTM) | 17.99 | Fifty Day Average | 538.9474 |
| Two Hundred Day Average | 512.6696 | Trailing Annual Dividend Rate | 5.39 | Trailing Annual Dividend Yield | 0.0097 |
| Enterprise Value | 47,172,112,384 | Profit Margins | 39.76% | Float Shares | 76,585,581 |
| Shares Outstanding | 79,091,200 | Shares Short | 776,906 | Held Percent Insiders | 3.132% |
| Held Percent Institutions | 93.428% | Short Ratio | 1.96 | Book Value | -13.264 |
| Net Income to Common | 960,182,976 | Trailing EPS | 11.97 | Forward EPS | 14.77 |
| PEG Ratio | 2.94 | Enterprise to Revenue | 19.53 | EBITDA | 1,408,222,976 |
| Total Debt | 4,652,827,136 | Quick Ratio | 1.268 | Current Ratio | 1.361 |
| Total Revenue | 2,415,022,080 | Revenue Per Share | 30.309 | Return on Assets | 17.145% |
| Free Cash Flow | 923,180,992 | Operating Cash Flow | 1,162,503,040 | Earnings Growth | 22.0% |
| Revenue Growth | 11.6% | Gross Margins | 82.344% | EBITDA Margins | 58.311% |
| Operating Margins | 56.651% | Target High Price | 640.00 | Target Low Price | 460.00 |
| Target Mean Price | 576.75 | Target Median Price | 600.00 | Current Price | 549.29 |
| Sharpe Ratio | -14.29761584797977 | Sortino Ratio | -229.02734031478371 |
| Treynor Ratio | 0.08824143386921308 | Calmar Ratio | 0.5061368732103264 |
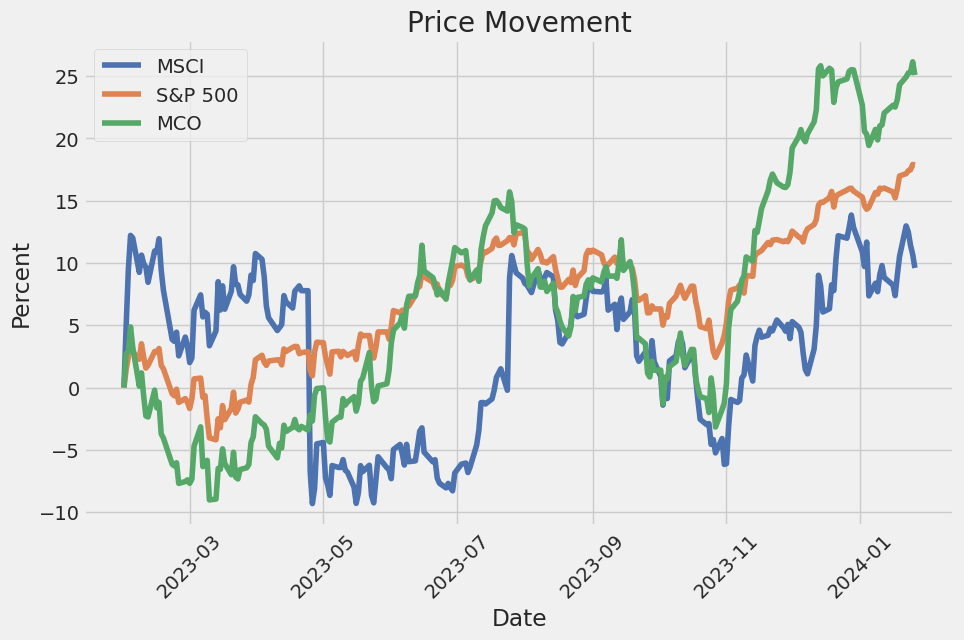
Analysis of the MSCI's stock price movement is multi-faceted, involving a strategic assessment of technical indicators, company fundamentals, risk-adjusted ratios, and analyst expectations.
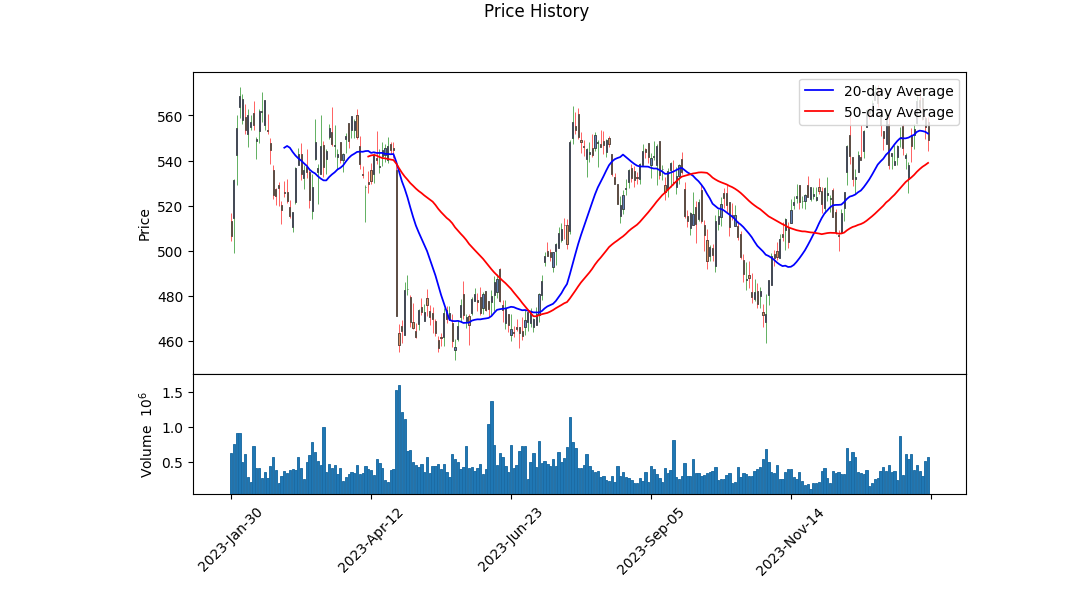
Beginning with technical analysis, MSCI's stock price has demonstrated a positive price movement over the historical range, concluding on an upbeat note on the last trading day. Notably, the OBV (On-Balance Volume) indicator, which tracks volume flow to gauge buying and selling pressure, exhibited a uptick to 0.24390 million by the end of the period after some fluctuations, indicating a net influx of volume on up days, suggestive of accumulating interest among investors.
However, the MACD Histogram, which is utilized to identify potential reversals or trend continuation, presents a less conclusive signal with a reading of -0.478104 on the last trading day. While observing this metric, traders often consider the zero-crossing events; negatives indicate potential bearish reversals, placing emphasis on other indicators and underlying fundamentals to substantiate the trend.
Delving into the provided fundamental data, MSCI boasts strong margins, including a robust gross margin of 0.82344, ebitda margin of 0.58311, and operating margin of 0.56651. These margins reflect operating efficiency and a solid grip on cost management which, when paired with a healthy balance sheet indicating significant net income figures and controlled debt ratios, underpin a strong fundamental backdrop that may support the stock's resilience in the face of market volatility.
Analysis extends to a review of risk-adjusted performance ratios, revealing a highly negative Sharpe Ratio of -14.29761584797977 and an extremely negative Sortino Ratio of -229.02734031478371. These figures indicate that the stock's returns have been substantially lower than the risk-free rate, which when taken standalone, would discourage investment. However, ratios such as Treynor, at 0.08824143386921308, and Calmar, at 0.5061368732103264, suggest that on a risk-adjusted basis, considering market volatility or drawdown, the performance may be more acceptable, yet still indicate that there is notable systemic risk present in the investment.
With respect to analyst expectations, there is a prevailing optimistic sentiment as evidenced by the progressive increase in earnings estimates over the past 90 days and the anticipated sales growth of 12.40%. This optimism is echoed by upward revisions in EPS for the next year, with 11 analysts increasing their estimates over the last 30 days.
Turning to the proprietary Scores Summary, MSCI has an impressive Altman Z-Score of 13.414621393614864, significantly above the threshold for financial distress, and a perfect Piotroski Score of 9, signaling strong financial health and profitability.
Conclusively, while technical indicators present a mixed picture, definitive fundamental strength, solid margins, lucrative analyst outlook, and an excellent financial scorecard collectively tilt the balance toward a positive forecast for MSCI's stock price movement in the forthcoming months. However, the alarmingly negative Sharpe and Sortino ratios remind us that the stock has had a recent period of substantial volatility in returns, which age-old wisdom suggests warrants caution. Skilled market participants are therefore encouraged to weigh all the risk factors, particularly the risk-adjusted performance measures, alongside the positive fundamental and analyst sentiment before reaching an investment decision.
| Statistic Name | Statistic Value |
| R-squared | 0.537 |
| Adj. R-squared | 0.536 |
| F-statistic | 1,454 |
| Prob (F-statistic) | 6.37e-212 |
| Log-Likelihood | -2,332.4 |
| AIC | 4,669 |
| BIC | 4,679 |
| coef (const) | 0.0470 |
| std err (const) | 0.044 |
| t (const) | 1.074 |
| P>|t| (const) | 0.283 |
| [0.025 0.975] (const) | -0.039 0.133 |
| coef (beta) | 1.2653 |
| std err (beta) | 0.033 |
| t (beta) | 38.131 |
| P>|t| (beta) | 0.000 |
| [0.025 0.975] (beta) | 1.200 1.330 |
| Omnibus | 184.174 |
| Prob(Omnibus) | 0.000 |
| Jarque-Bera (JB) | 2,273.309 |
| Skew | -0.175 |
| Prob(JB) | 0.00 |
| Kurtosis | 9.579 |
| Cond. No. | 1.32 |
The linear regression model analyzing the relationship between MSCI and SPY indicates that the MSCI has a significant positive relationship with SPY, as captured by a coefficient (beta) of 1.2653. The model has an R-squared value of 0.537, indicating that approximately 53.7% of the variability in MSCI can be explained by the SPY index. The alpha, a measure of the intercept of the regression equation, represents the expected return of MSCI when SPY is zero. In this model, alpha is 0.04695536540879258, suggesting that if SPY yields no return, MSCI is expected to earn a return of around 4.7%.
Despite the significant relationship, the model's alpha also suggests that MSCI provides a slight positive return over and above the market return represented by SPY. This may be indicative of a small performance edge when the market's influence is stripped away. This performance, however, is not deemed statistically significant according to the P-value for alpha (P>|t|), which stands at 0.283, higher than the conventional threshold of 0.05 for statistical significance. In other words, the observed alpha might very well be due to random fluctuations rather than a systematic, reliable outperformance by MSCI relative to the market.
Earnings Summary for MSCI Inc. Third Quarter 2023:
Introduction: - The conference call was initiated by the operator and hosted by Jeremy Ulan, MSCI's Head of Investor Relations and Treasurer. - A reminder was issued that the call contains forward-looking statements subject to risks and uncertainties. - Non-GAAP measures and operating metrics like run rate and retention rate were mentioned, and the audience was directed to the earnings presentation for details.
Performance Highlights: - Henry Fernandez, MSCI's Chairman, and CEO, emphasized strong financial performance during uncertain times with notable metrics like: - Adjusted EPS growth over 21% - Total revenue growth of 12% - Recurring subscription run rate growth of 12% - Retention rate of 95.4% - MSCI returned significant capital to shareholders through share repurchases and dividends. - The acquisitions of Burgiss and Trove Research were seen as strategic steps enhancing MSCI's offerings in private assets and the voluntary carbon market. - Fernandez posited MSCI's goal to establish standards in the private assets sector and outlined how MSCI was positioned to operate effectively in any economic environment.
Product and Regional Performance: - Baer Pettit, MSCI's President and COO, outlined the integration of Burgiss and highlighted the business potential from the sizable private asset database. - MSCI achieved solid performance across client segments and products, including: - Subscription run rate growth in wealth managers, banks, broker-dealers, hedge funds, insurance companies, and corporates. - Double-digit subscription run rate growth for Index, Analytics, ESG, and Climate products, particularly driven by demand for custom indexes and enterprise risk. - Strong results in the Asia Pacific, with specific growth in real assets and index subscription run rate.
Financial Outlook: - CFO Andrew Wiechmann detailed MSCI's resilient financial model, leading to double-digit growth across key metrics. - Index subscription exhibited robust growth across various modules, including market cap-weighted and custom indexes. - Asset-based fees increased due to substantial inflows and market appreciation. - Wiechmann outlined the financial contribution from Burgiss and Trove, noting the initial minimal impact on adjusted EBITDA but potential margin expansion in the future. - Capital allocation remained opportunistic, with expectations for steady growth despite budget pressures and a focus on investing in the business for sustained profitability.
Q&A Highlights: - Analysts inquired about index sales, expense guidance, capital allocation, and MSCI's competitive dynamics, seeking clarity on how MSCI would maintain growth amid market volatility and strategic acquisitions. - The company re-emphasized its sound financial management and commitment to expansion, especially in ESG and Climate solutions, while realizing new opportunities through acquisitions. - MSCI leadership highlighted their ability to manage costs effectively and reassured investors of their robust capital allocation strategy. - There was a particular focus on Burgiss integration supporting the aim to provide comprehensive portfolio solutions and MSCI's positioning in carbon markets among institutional investors.
Conclusion:
- Fernandez concluded by expressing confidence in MSCI's diversified franchise and growth potential across various product lines despite uncertain global conditions. He looked forward to providing future updates on the company's progress.
Fs linked to MSCI equity indexes, which increased 15.3%, primarily due to growth in average AUM. Run Rate from non-ETF indexed funds linked to MSCI indexes also grew, up by 16.3% primarily due to increases in average AUM and average basis point fees, partially offset by decreases in revenues from exchange traded futures and options contracts linked to MSCI indexes which declined by 12.1%, as volume decreased.
The Analytics segment experienced a 7.0% increase in Run Rate, primarily due to growth in Equity Analytics and Multi-Asset Class products. This increase was somewhat offset by decreases in the cost of revenues expense activity category.
ESG and Climate segment had a significant increase in Run Rate of 25.0%, mainly stemming from growth in Ratings, Climate, and Screening products, reflecting continued high demand for ESG and Climate solutions across institutional investors.
The All Other Private Assets segment had a 9.7% increase in Run Rate, largely due to growth from Index Intel, Property Intel, and Climate Insights products, despite a one-time revenue catch-up in the previous period and unfavorable foreign currency exchange rate movements.
The increase in Run Rate indicates a healthy demand for MSCI's products and services across its segments, suggesting continued revenue growth. The companys focus on innovation, expansion of ESG and climate products, and strategic partnerships likely contributed to its strong performance. These factors, combined with prudent management of operating and non-operating expenses, have positioned MSCI to increase its profitability, as evidenced by a net income increase of 19.9% for the three months ended September 30, 2023, and 13.7% for the nine months ended September 30, 2023. The improved profitability also reflects changes in the rate of growth of Adjusted EBITDA expenses compared to the rate of growth of operating revenues.
Its also important to note that the acquisition of the remaining interest in Burgiss is expected to enhance MSCI's comprehensive data and deep expertise in all private assets, driving further growth in the All Other Private Assets segment.
Given the strong results, the MSCI's Board of Directors declared a quarterly cash dividend, and the companys stock repurchase program remains active, with a considerable amount of authorization remaining, indicating confidence in the company's financial health and commitment to delivering value to shareholders. However, the exact financial impact of certain events and transactions, such as interest rates, foreign exchange rates, trading volumes, and asset values, might vary, potentially affecting future profitability.
MSCI Inc., a leading provider of critical decision support tools and services for the global investment community, continues to show strong performance in the financial industry with its comprehensive range of indices and analytics services. The company has seen robust growth in recurring subscriptions, driven largely by the increasing demand for its custom and factor index modules. This growth reflects a consistent trend, illustrating MSCI's firm market position and pointing to a promising future.
One of the factors contributing to MSCI's success is the burgeoning adoption of its Environmental, Social, and Governance (ESG) and Climate solutions, which are becoming increasingly integral in investment processes. The strategic emphasis on providing such services not only caters to the current market needs but also demonstrates MSCI's proactive stance on contributing to sustainable investing.
MSCI's strategic acquisitions have expanded its capabilities in offering comprehensive climate-risk assessments and supporting investors with climate-risk disclosure requirements. Recognizing the evolving landscape of financial risk management, these acquisitions allow MSCI to meet the demands for enhanced analytics, including those related to municipal bonds and securitized products.
Looking at client engagement, MSCI is amassing significant traction among wealth management firms, banks, and hedge funds. This diversification of clientele is indicative of MSCI's adaptive and innovative approach to the financial services provided, ensuring that various market segments can rely on the company for their analytical and indexing needs.
On the financial front, MSCI has outperformed with consistent earnings beats in the last four reported quarters. The Zacks Consensus Estimate for MSCI's current-year earnings has seen an upward revision by 6.8% in the previous week, reflecting an overall positive signal from analysts. With an expected earnings growth rate of 12% for the current year, MSCI is on track to outpace its industry's expected average.
Moreover, based on reports from Zacks Investment Research and the expected earnings growth rate, MSCI Inc. is looking forward to potentially escalating its stock price. With a Zacks Rank #2 (Buy) and a positive Earnings ESP, there's a heightened probability for an earnings beat.
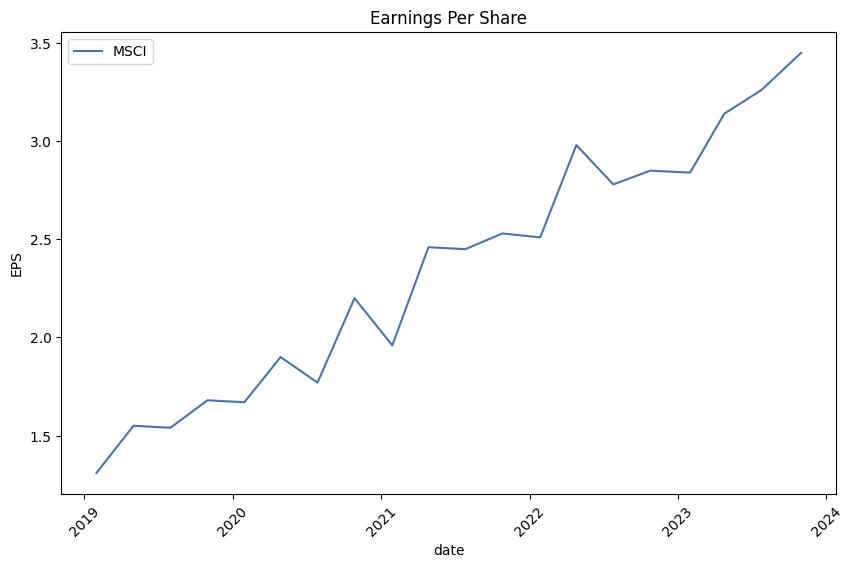
Earnings per share (EPS) growth is a critical driver for investment, and MSCI's historical EPS growth rate shines at 21.2%. Considering the industry average, MSCI's projection for the current year further cements its stature as a stalwart likely to deliver significant returns while outpacing rivals in profitability prospects.
Apart from earnings growth, investors should note MSCI's impressive cash flow growth, a fundamental aspect for any growth stock. The company's year-over-year cash flow growth exceeds that of many of its peers and stands well above the industry average. This financial health enables continued expansion and innovation without reliance on external funding sources.
The momentum behind MSCI is not merely domestic; international economic events such as the stimuli introduced in China and the weakening dollar have also had significant positive impacts on global emerging markets, including Latin American stock markets and currencies. As reported by Yahoo Finance, the liquidity unleashed by China's central bank led to increased commodity prices, benefiting the performance of MSCI's global Emerging Market (EM) and Latin American indexes.
While the Colombian financial community works to avert an MSCI downgrade from an emerging market to a frontier market, MSCI itself shows a remarkable earnings report anticipation. With an expected earnings increase of 15.9% compared to the same period a year prior and projected revenue growth of 14.1%, analysts are optimistic about MSCI's Q4 results. These expectations are buoyed by upward revisions of 1.9% in the consensus estimate for EPS over the past month.
Key financial metrics such as 'Operating Revenues- ESG and Climate' and 'Operating Revenues- Analytics' are projected to show year-over-year growth, indicative of MSCI's broad-based revenue expansion. Furthermore, MSCI's 'Total Run Rate' and 'Adjusted EBITDA' for its Index and ESG and Climate segments are estimated to increase, highlighting the company's continued financial robustness.
Yet, despite some short-term stock price decline over the month leading up to the earnings report, market participants speculate whether MSCI can maintain its impressive record of surpassing expectations. With a Zacks Rank #3 (Hold), the company may perform in line with market expectations in the near term.
As the financial world turns its eyes to Latin America, amidst positive reactions to U.S. inflation trends, MSCI's indexes reflect optimism and recovery in risk-related assets. The moderation in U.S. inflation has lessened the value of the dollar and is causing shifts in monetary policy outlooks, which significantly influences regional assets previously marred by uncertainties.
Amidst this, MSCI Inc.'s challenges in the Chinese market have not gone unnoticed. The MSCI China Index's marked underperformance over the past decade emphasizes the difficulties faced in this region. Mirroring global indices' success, economic and policy hurdles must be addressed to regain investor trust in the Chinese market.
Investors, analysts, and market enthusiasts closely watch MSCI Inc. as they predict the company's potential for an earnings beat in the forthcoming financial release. Factors such as Earnings ESP and Zacks Rank are carefully analyzed to forecast market behavior, underlining MSCI's keenly awaited next earnings report.
For more detailed insights and contextual information regarding MSCI Inc.'s financial outlook and global influence, interested parties are encouraged to review the referenced articles from various financial news platforms such as Yahoo Finance and Bloomberg.
Between January 29, 2019, and January 26, 2024, the volatility of MSCI Inc. indicated by an ARCH model shows that there is no predictable pattern in the average returns over time since the model used does not rely on past means (Zero Mean). The model indicates that volatility is impacted by its own previous values, evident in the significant coefficient for the first lag (alpha[1]). Moreover, the omega parameter is substantial, suggesting the presence of an inherent level of variance in the returns.
| Statistic | Value |
|---|---|
| R-squared | 0.000 |
| Adj. R-squared | 0.001 |
| Log-Likelihood | -2,737.45 |
| AIC | 5,478.91 |
| BIC | 5,489.18 |
| No. Observations | 1,257 |
| omega | 3.3640 |
| alpha[1] | 0.3725 |
To analyze the financial risk associated with a $10,000 investment in MSCI Inc. over a one-year period, a sophisticated approach that combines volatility modeling and machine learning predictions was adopted. The volatility modeling technique, typically used to capture the time-varying volatility of stock returns, is vital in this context for estimating the fluctuation levels of MSCI Inc.'s stock price. This type of model allows us to infer the clustering of volatility over time, a characteristic often observed in financial data, and to forecast future volatility based on the latest market information.
Volatility modeling serves to dissect the dynamic nature of MSCI Inc.'s stock by producing an estimate of the variability that could be expected in the returns over the forecast horizon. This measure of volatility is an essential input for various risk management tools, including the calculation of VaR, which provides an assessed level of potential financial loss.
For the prediction of future stock returns, machine learning predictions were employed, specifically utilizing an algorithm designed for regression tasks. This tool is trained on historical data, extracting patterns and learning the relationships between various market indicators and the stock's performance. In doing so, it generates projections of future stock returns, considering the intricate interactions within the market data that might elude simpler analytical models.
By integrating the outputs from volatility modeling and machine learning predictions, we gain a multi-faceted perspective on the investment's potential risks. The volatility estimate guides us in understanding the degree of uncertainty or risk in the stock's returns, while the predictive modeling provides an insight into the direction and magnitude of potential future stock returns.
The calculated Value at Risk (VaR) for the investment, at a 95% confidence interval, stands at $291.74. This figure signifies that there is a 95% probability that the investment in MSCI Inc. will not lose more than $291.74 over the next year due to market movements. In financial risk management terms, this would mean that the investor should be prepared for a potential downside of up to 2.9174% of the investment value due to adverse market conditions with a 5% chance of exceeding this loss threshold.
It should be noted that while the VaR figure provides a quantifiable risk metric, it does not capture potential losses beyond the 95% confidence level, nor does it account for the shape of the tail of the distribution of returns. Moreover, since both volatility modeling and machine learning predictions are based on historical data, the models rely on the assumption that historical patterns will repeat or continue in a similar fashion, which is not always the case.
By combining these two powerful analytical techniquesvolatility modeling to account for the dynamic nature of market risk and machine learning for forward-looking return predictionsinvestors can garner a more thorough assessment of the financial risks prior to making equity investments like the one considered in MSCI Inc.
Similar Companies in Financial Data & Stock Exchanges:
Moody's Corporation (MCO), Intercontinental Exchange, Inc. (ICE), CME Group Inc. (CME), Nasdaq, Inc. (NDAQ), Report: S&P Global Inc. (SPGI), S&P Global Inc. (SPGI), Morningstar, Inc. (MORN), London Stock Exchange Group plc (LSEG-L), FactSet Research Systems Inc. (FDS)
https://seekingalpha.com/article/4658149-12-stocks-i-hope-to-buy-if-the-market-crashes
https://seekingalpha.com/article/4660666-my-top-15-high-growth-dividend-stocks-for-january-2024
https://finance.yahoo.com/news/3-reasons-why-growth-investors-174506645.html
https://finance.yahoo.com/news/emerging-markets-china-stimulus-weaker-201646903.html
https://finance.yahoo.com/news/top-5-stocks-poised-beat-114200036.html
https://finance.yahoo.com/news/countdown-msci-msci-q4-earnings-141521842.html
https://finance.yahoo.com/news/colombia-moving-fend-off-frontier-153655476.html
https://finance.yahoo.com/news/msci-msci-beat-estimates-again-171011830.html
https://finance.yahoo.com/news/china-stocks-lost-decade-means-100124949.html
https://finance.yahoo.com/news/emerging-markets-latam-stock-forex-203820219.html
https://www.sec.gov/Archives/edgar/data/1408198/000140819823000055/msci-20230930.htm
Copyright © 2024 Tiny Computers (email@tinycomputers.io)
Report ID: ZIMHUe
Cost: $0.64769
https://reports.tinycomputers.io/MSCI/MSCI-2024-01-28.html Home