NextEra Energy Partners, LP (ticker: NEP)
2023-12-17
 NextEra Energy Partners, LP (ticker: NEP) is a growth-oriented limited partnership formed by NextEra Energy, Inc. which is primarily focused on acquiring, managing, and owning contracted clean energy projects with stable, long-term cash flows. It is amongst the leading players in the renewable energy sector, holding interests in a diversified portfolio of wind and solar projects in North America as well as natural gas infrastructure assets. NEP benefits from the expertise and resources of its parent company, allowing it to strategically enhance its renewable energy holdings and pursue expansion opportunities. The partnership aims to provide attractive, risk-adjusted returns to its unitholders through steady cash distributions and the potential for long-term capital appreciation. With renewable energy demand on the rise, NEP is well-positioned to leverage the industry's favorable growth dynamics. Its performance is of particular interest to investors looking for exposure to the renewable energy sector with the added potential for consistent income streams.
| As of Date: 12/17/2023Current | 9/30/2023 | 6/30/2023 | 3/31/2023 | 12/31/2022 | 9/30/2022 | |
|---|---|---|---|---|---|---|
| Market Cap (intraday) | 2.82B | 2.77B | 5.48B | 5.40B | 6.07B | 6.26B |
| Enterprise Value | 8.97B | 8.68B | 10.59B | 10.45B | 10.65B | 11.30B |
| Trailing P/E | 22.68 | 17.78 | 15.72 | 10.81 | 13.74 | 16.36 |
| Forward P/E | 36.63 | 23.47 | 64.52 | 45.25 | 33.56 | 34.60 |
| PEG Ratio (5 yr expected) | - | - | - | 4.53 | 3.35 | 3.46 |
| Price/Sales (ttm) | 2.11 | 2.14 | 4.09 | 4.26 | 4.98 | 5.22 |
| Price/Book (mrq) | 0.80 | 0.78 | 1.61 | 1.62 | 1.78 | 1.94 |
| Enterprise Value/Revenue | 6.98 | 23.65 | 30.25 | 34.73 | 40.04 | 37.40 |
| Enterprise Value/EBITDA | 10.02 | 36.31 | 38.08 | 59.06 | 66.16 | 63.10 |
| Address | 700 Universe Boulevard | City | Juno Beach |
|---|---|---|---|
| State | FL | ZIP | 33408 |
| Country | United States | Phone | 561 694 4000 |
| Website | https://www.nexteraenergypartners.com | Industry | Utilities - Renewable |
| Sector | Utilities | Incorporated | 2014 |
| Headquarters | Juno Beach, Florida | Previous Close Price | $30.56 |
| Open Price | $30.75 | Day's Low | $29.93 |
| Day's High | $31.01 | Dividend Rate | $3.38 |
| Dividend Yield | 11.20% | Payout Ratio | 247.86% |
| Five Year Average Dividend Yield | 4.29% | Beta | 0.904 |
| Trailing PE | 22.68 | Forward PE | 41.32 |
| Volume | 2,180,469 | Average Volume | 3,057,359 |
| Average Volume (10 days) | 1,938,550 | Bid | $30.00 |
| Ask | $30.67 | Bid Size | 800 |
| Ask Size | 900 | Market Cap | $2,817,924,096 |
| 52 Week Low | $20.17 | 52 Week High | $77.21 |
| Price to Sales (TTM) | 2.19 | 50 Day Average | $24.82 |
| 200 Day Average | $47.82 | Trailing Annual Dividend Rate | $3.377 |
| Trailing Annual Dividend Yield | 11.05% | Currency | USD |
| Enterprise Value | $19,855,925,248 | Profit Margins | 9.50% |
| Shares Outstanding | 93,432,496 | Shares Short | 2,545,706 |
| Shares Percent Shares Out | 2.72% | Held Percent Insiders | 1.07% |
| Held Percent Institutions | 82.45% | Short Ratio | 1.19 |
| Short Percent of Float | 2.75% | Book Value | $37.81 |
| Price to Book | 0.80 | Last Fiscal Year End | 2022 |
| Next Fiscal Year End | 2023 | Most Recent Quarter | 2022 Q3 |
| Earnings Quarterly Growth | -32.90% | Net Income to Common | $122,000,000 |
| Trailing EPS | $1.33 | Forward EPS | $0.73 |
| PEG Ratio | -3.22 | Enterprise to Revenue | 15.46 |
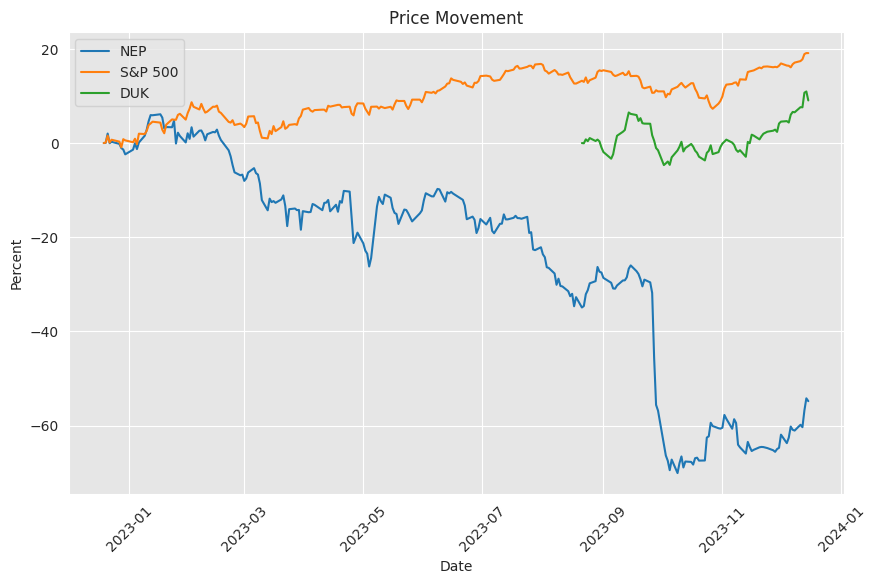
| Enterprise to EBITDA | 26.65 | 52 Week Change | -58.00% |
| S&P 52 Week Change | 23.61% | Last Dividend Value | $0.868 |
| Total Cash | $332,000,000 | Total Cash Per Share | $3.553 |
| EBITDA | $745,000,000 | Total Debt | $6,493,000,192 |
| Quick Ratio | 0.42 | Current Ratio | 0.61 |
| Total Revenue | $1,284,000,000 | Debt to Equity | 45.06 |
| Revenue Per Share | $14.28 | Return on Assets | 0.37% |
| Return on Equity | 0.65% | Gross Profits | $642,000,000 |
| Free Cash Flow | -$856,124,992 | Operating Cash Flow | $717,000,000 |
| Earnings Growth | -38.90% | Revenue Growth | 21.50% |
| Gross Margins | 56.31% | EBITDA Margins | 58.02% |
| Operating Margins | 19.89% | Recommendation Mean | 2.5 (Buy) |
Technical Analysis and Fundamental Outlook for NEP Stock
Technical Indicators: - The Adjusted Closing Price is at $30.16. - MACD is in a bullish phase with a value of 0.912452 and a histogram reading of 0.803116, suggesting a strong upward momentum. - Relative Strength Index (RSI) is at 66.90, nearing overbought territory but still indicative of bullish sentiment. - Bollinger Bands indicate the price is near the upper band at $31.92 with the middle band at $28.57, showing a continuation of the bullish trend. - The 20-day Simple Moving Average (SMA_20) at $25.345 is well below the current price, signaling upward trend strength. - Exponential Moving Average (EMA_50) at $28.729904 supports the continued bullish price action. - The On-Balance Volume (OBV) in the negative millions at -5.68681 reflects some selling pressure despite the price increase. - Stochastic Oscillator's K line (STOCHk_14_3_3) at 92.19 is in the overbought range, which might herald a potential price pullback. - Average Directional Index (ADX_14) at 27.17 denotes a moderately strong trend. - Williams %R (WILLR_14) confirms the overbought condition at -13.507104. - Chaikin Money Flow (CMF_20) at 0.123742 shows some inflow of money into the stock. - The Parabolic SAR (PSAR) is below the price, indicating a bullish phase.
Fundamentals: - Market capitalization has seen a sizable decrease from the previous year, indicating lower valuation or stock price depreciation. - Trailing P/E has increased, whereas Forward P/E has seen substantial upward adjustments, signifying potentially lower earnings expectations in the future. - Price-to-sales (P/S) ratio has decreased, suggesting potential undervaluation relative to sales. - The Enterprise Value/Revenue and Enterprise Value/EBITDA ratios have reduced significantly, indicating a more favorable valuation compared to revenue and earnings before interest, taxes, depreciation, and amortization respectively.
Financials: - Net Income has seen drastic improvement in the past year, showing strong profit generation capability. - EBITDA suggests consistent earnings before interest, taxes, depreciation, and amortization. - Total unusual items indicate some one-off gains that may not be repeatable. - Revenue has been showing a growth trend, positive for the company's top-line performance.
Price Movement Prediction: Considering the bullish MACD, proximity to the upper Bollinger Band, and a relatively high RSI, NEP stock price movement in the next few months appears to be upward. However, the Stochastic Oscillator and Williams %R signal potential short-term overbought conditions that could result in pullbacks or price consolidation. The solid fundamentals, with an increasing market cap and improving financials, likely provide a solid foundation for sustained growth. Revenue growth indicates a healthy business expansion that can support longer-term positive price movements.
It's important to note that while technical indicators show a strong upward trend and the fundamentals present a robust financial health, the elevated Forward P/E suggests that investors may have concerns about future growth prospects, possibly tempering the stock's upward trajectory. A careful watch on the volume trends indicated by OBV, along with the CMF, will help confirm whether the bullish sentiment is backed by strong investor conviction.
To conclude, NEP stock is likely to experience continued bullish momentum over the next few months with potential short-term volatility. Strong earnings and revenue growth will be key factors supporting the positive technical outlook, but attention should be given to signs of overvaluation or sentiment shifts as suggested by various technical indicators and fundamental ratios. Investors should closely monitor the market's reaction to any new fundamental developments to validate the sustained bullish trend.
NextEra Energy Partners, LP (hereafter referred to as NEP) is a growth-oriented limited partnership formed by NextEra Energy, Inc., primarily to own, operate and acquire contracted clean energy projects with stable, long-term cash flows. It is structured as a Master Limited Partnership (MLP) and has differentiated itself in the renewable energy sector with its focus on acquiring high-quality renewable energy projects.
At the heart of NEP's strategy is the acquisition and management of renewable energy assets, predominantly wind and solar, in conjunction with certain natural gas pipeline assets. These energy projects are geographically diverse and spread across North America, including the United States and Canada. This geographic dispersion helps mitigate the risks associated with weather-related disruptions and regulatory changes in any single jurisdiction.
NEP's portfolio is heavily skewed towards renewable energy sources, resonating with the growing global emphasis on clean energy and the shift away from fossil fuel-based power generation. This positions NEP to potentially benefit from numerous federal and state-level policies aimed at fostering renewable energy growth.
An important aspect contributing to NEP's investment appeal is its strong relationship with NextEra Energy, Inc., one of the leading electricity-related services companies in North America. This relationship enables NEP to have a robust pipeline of potential acquisitions. NEP has the right of first offer (ROFO) on a significant portfolio of renewable energy assets from its sponsor, which provides visibility into future growth opportunities.
Regarding NEP's financial performance, it is important to note that NEP generates a majority of its revenue from long-term, fixed-rate power purchase agreements (PPAs) with creditworthy counterparties. These PPAs often come with inflation escalation clauses, offering a degree of protection against inflationary pressures over time. The attractiveness of this business model is the predictable cash flow, which supports NEP's ability to pay consistent and growing distributions.
NEP's distributions have a strong appeal to income-focused investors. The distributions are supported by stable and predictable cash flow streams from NEP's contracted assets. The objective is for NEP to deliver unitholders with a steady, attractive yield combined with the potential for capital appreciation over time. The partnership targets a payout ratio that balances income distribution to unitholders with reinvestment in the business for growth.
To finance its acquisitions and operations, NEP employs both debt and equity issuance. It maintains a conservative financial profile with an emphasis on credit quality and the preservation of capital. The company's use of non-recourse project debt aligns with industry practices and helps to contain risks at the individual project level rather than across the entire enterprise.
One key element of NEP's recent successes has been its ability to utilize innovative financing structures, such as tax equity financing, which enhances the value of its renewable energy investments. This tax-oriented investing structure aligns with the substantial tax benefits associated with renewable energy assets and allows NEP to attract a wide range of investors.
In addition to its robust portfolio of assets, NEP also focuses on operational excellence. This commitment is evidenced by its ongoing investment in state-of-the-art technology and practices to maximize the efficiency and lifespan of its renewable energy assets. The use of predictive analytics and advanced maintenance techniques contributes to reducing downtime and improving the overall performance of its wind and solar facilities.
As climate change continues to shape energy policy and consumer preferences globally, NEP is effectively positioned to capitalize on the increasing demand for clean energy solutions. The partnership's focus on renewable energy, combined with its competitive advantages and operational expertise, positions it to be a significant player in the transition towards a more sustainable energy future.
The role of NEP as part of the broader portfolio of NextEra Energy, Inc. confers additional benefits in terms of economies of scale and operational synergies. Being part of a larger energy conglomerate provides NEP with access to resources, management expertise, and a strong brand that it might not possess independently.
Corporate governance at NEP is taken seriously, with the parent company providing oversight and strategic direction. The governance structure is designed to align the interests of NEP's management with those of its unitholders, thus ensuring that the long-term strategy reflects the best interests of all stakeholders.
NEP continues to monitor the marketplace for potential acquisition targets beyond what is available from the ROFO pipeline with its sponsor. These targets are carefully evaluated for their alignment with the overall growth strategy and their potential to add value for unitholders.
Overall, NEP represents a compelling opportunity within the renewable energy sector, combining growth prospects with a commitment to sustainability and unitholder value. Its strategic acquisitions, financial discipline, and robust sponsorship afford it a unique position in the market, while the transition toward renewable energy sources bodes well for the partnership's long-term success.
Similar Companies in Electric Utilities:
Duke Energy Corporation (DUK), Dominion Energy Inc (D), Report: Southern Company (SO), Southern Company (SO), Exelon Corporation (EXC), American Electric Power Company, Inc. (AEP), Sempra Energy (SRE), Xcel Energy Inc. (XEL), PG&E Corporation (PCG), Edison International (EIX), Public Service Enterprise Group Incorporated (PEG), Consolidated Edison, Inc. (ED)
News Links:
Copyright © 2023 Tiny Computers (email@tinycomputers.io)
Report ID: mPxW3LK
https://reports.tinycomputers.io/NEP/NEP-2023-12-17.html Home