Realty Income Corporation (ticker: O)
2024-05-21
 Realty Income Corporation (NYSE: O), often referred to as "The Monthly Dividend Company," is a prominent real estate investment trust (REIT) specializing in single-tenant, freestanding commercial properties. With a diversified portfolio encompassing over 6,500 properties across 49 states and Puerto Rico, the company ensures consistent revenue streams through long-term, net lease agreements predominantly with retail clients. These agreements, typically spanning 10 to 20 years, require tenants to bear property-related expenses such as taxes, insurance, and maintenance, minimizing financial risk for Realty Income. Established in 1969 and publicly listed in 1994, the firm has garnered investor confidence through its steadfast commitment to monthly dividend payments, boasting a record of over 625 consecutive monthly dividends. This consistent income, coupled with the company's strategic acquisitions and conservative financial management, underpins its reputation as a reliable investment option in the real estate sector.
| Full Time Employees | 418 | Previous Close | 54.98 | Open | 54.98 |
| Day Low | 54.96 | Day High | 55.495 | Dividend Rate | 3.08 |
| Dividend Yield | 0.0561 | Payout Ratio | 2.8435001 | Five Year Avg Dividend Yield | 4.55 |
| Beta | 0.924 | Trailing PE | 51.0 | Forward PE | 33.38182 |
| Volume | 3,455,900 | Average Volume | 5,895,774 | Average Volume (10 days) | 5,016,950 |
| Market Cap | 47,962,234,880 | 52 Week Low | 45.04 | 52 Week High | 64.18 |
| Price to Sales (Trailing 12 Months) | 10.910553 | 50 Day Average | 53.3798 | 200 Day Average | 53.7963 |
| Trailing Annual Dividend Rate | 3.071 | Trailing Annual Dividend Yield | 0.05585668 | Enterprise Value | 73,673,310,208 |
| Profit Margins | 0.17733999 | Float Shares | 869,111,257 | Shares Outstanding | 870,774,016 |
| Shares Short | 13,245,692 | Shares Short Prior Month | 11,308,094 | Shares Percent Shares Out | 0.0152 |
| Held Percent Insiders | 0.00112 | Held Percent Institutions | 0.79264 | Short Ratio | 2.36 |
| Short Percent Of Float | 0.0175 | Book Value | 44.773 | Price to Book | 1.2302058 |
| Net Income To Common | 776,988,992 | Trailing EPS | 1.08 | Forward EPS | 1.65 |
| PEG Ratio | 1.58 | Enterprise to Revenue | 16.759 | Enterprise to EBITDA | 18.853 |
| 52 Week Change | -0.08519137 | S&P 52 Week Change | 0.28043115 | Last Dividend Value | 0.257 |
| Current Price | 55.08 | Target High Price | 70.0 | Target Low Price | 56.0 |
| Target Mean Price | 60.25 | Target Median Price | 58.5 | Recommendation Mean | 2.4 |
| Number Of Analyst Opinions | 14 | Total Cash | 680,158,976 | Total Cash Per Share | 0.781 |
| EBITDA | 3,907,810,048 | Total Debt | 25,978,443,776 | Quick Ratio | 1.982 |
| Current Ratio | 2.239 | Total Revenue | 4,395,949,056 | Debt To Equity | 66.072 |
| Revenue Per Share | 5.973 | Return On Assets | 0.019709999 | Return On Equity | 0.022839999 |
| Free Cash Flow | 2,056,114,176 | Operating Cash Flow | 3,006,208,000 | Earnings Growth | -0.543 |
| Revenue Growth | 0.333 | Gross Margins | 0.92335 | EBITDA Margins | 0.88896006 |
| Operating Margins | 0.43497002 | Trailing PEG Ratio | 4.9746 |
| Sharpe Ratio | -0.2922334116210134 | Sortino Ratio | -4.549334562407506 |
| Treynor Ratio | -0.09316047506000684 | Calmar Ratio | -0.11511403488445092 |
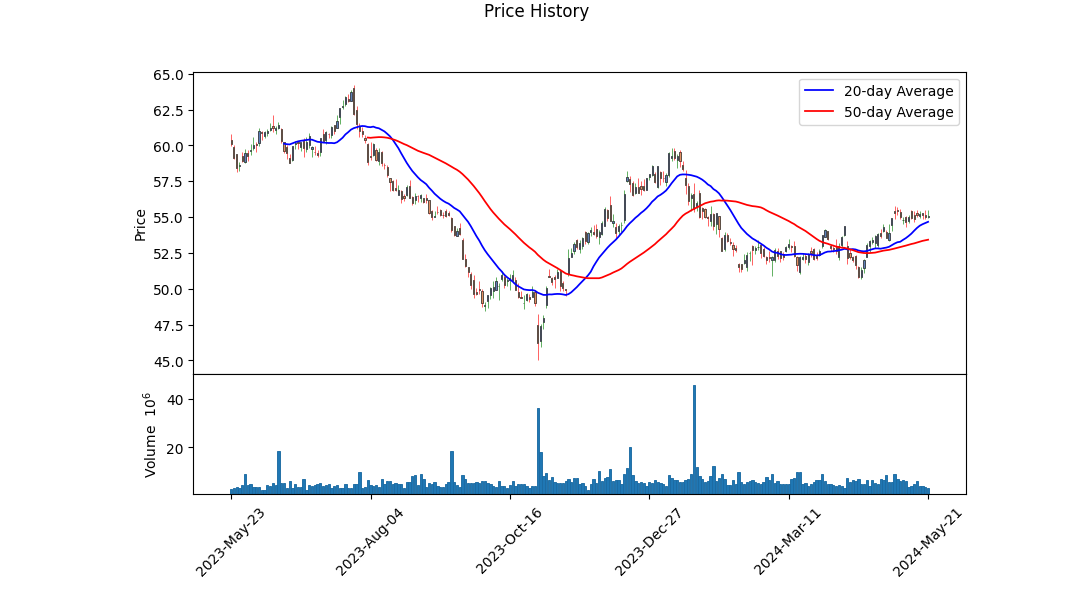
The technical indicators for the stock show fluctuating On-Balance Volume (OBV) and a slightly decreasing Moving Average Convergence Divergence (MACD) histogram which suggests weakening momentum. The latest prices hover around the $55-$56 range, indicating a lack of clear directional movement in recent trading sessions. This indecisiveness could indicate potential consolidation and the market awaiting a catalyst before resuming a new trend.
Fundamentally, the company exhibits very strong gross margins at 92.35% and healthy EBITDA margins at 88.96%, reflecting superior efficiency in operations and management. However, a high trailing PEG ratio of 4.97 suggests that the stock might be overvalued compared to its earnings growth rate. Moreover, the retained earnings are negative at -$7.299 billion, pointing to accumulated losses over time which might necessitate a critical examination of its sustainability strategies. On a positive note, it has an Altman Z-Score of 1.023, indicating some level of financial distress but not immediate risk of bankruptcy. The Piotroski F-Score of 6 reflects moderate financial strength.
Despite strong operational efficiency, the liquidity position remains a concern due to substantial debt levels, with total debt at $21.989 billion and net debt at $21.287 billion. The cash and cash equivalents are relatively low at $232.923 million, making the company's debt-repayment capacity a notable risk. Nevertheless, the company maintains a substantial tangible book value of $24.192 billion, providing a cushion against its liabilities.
The risk-adjusted performance ratios present an unfavorable risk-reward scenario. The negative Sharpe Ratio (-0.29), Sortino Ratio (-4.55), Treynor Ratio (-0.09), and Calmar Ratio (-0.12) all indicate that the returns achieved over the past year have not adequately compensated for the risks taken. This casts a dim view on the stock's investment attractiveness due to the higher risk relative to its returns.
Given these indicators, the stock may experience subdued performance in the coming months unless there is a significant improvement in market sentiment or an external stimulus that can drive a change in its trajectory. Prospective investors should consider these risks carefully. A close monitoring of further technical signals and any changes in the company's financial health would be prudent before making investment decisions. In summary, while the company displays operational strength, the prevailing market conditions and inherent financial risks suggest that caution is warranted.
In evaluating the financial performance of Realty Income Corporation (O) using the metrics prescribed by "The Little Book That Still Beats the Market," we have determined its Return on Capital (ROC) to be 3.20% and its earnings yield to be 2.29%. The ROC provides insight into the company's efficiency in generating profits from its capital; at 3.20%, Realty Income Corporation appears to utilize its capital modestly well, though there may be room for enhancement. Meanwhile, the earnings yield of 2.29% indicates how much investors are likely to earn in relation to the company's stock price. This relatively low yield suggests that the stock may be currently trading at a higher valuation compared to its earnings, reflecting a potential premium in the market's expectations. Together, these figures provide a composite look at the firm's profitability and investment efficiency, aiding investors in making more informed decisions.
Certainly, let's delve into the key metrics of Realty Income Corporation (O) and assess how they align with Benjamin Graham's criteria from "The Intelligent Investor":
-
Price-to-Earnings (P/E) Ratio:
- Realty Income Corporation: 46.55
- Industry Average: 39.18
- Graham's Criteria: Low P/E ratios compared to industry peers
- Analysis: Realty Income's P/E ratio of 46.55 is significantly higher than the industry average of 39.18. According to Graham's principles, this could suggest that the stock is potentially overvalued relative to its earnings, which might make it less attractive from a value investing perspective.
-
Price-to-Book (P/B) Ratio:
- Realty Income Corporation: 0.83
- Graham's Criteria: Typically looks for stocks trading below their book value
- Analysis: A P/B ratio of 0.83 indicates that Realty Income is trading below its book value, which aligns well with Graham's criteria. This could suggest that the stock is undervalued, presenting a potential buying opportunity.
-
Debt-to-Equity (D/E) Ratio:
- Realty Income Corporation: 0.67
- Graham's Criteria: Preference for companies with low debt-to-equity ratios
- Analysis: With a D/E ratio of 0.67, Realty Income Corporation has a relatively low level of debt compared to its equity, aligning with Graham's preference for financially stable companies with lower financial risk.
-
Current Ratio and Quick Ratio:
- Current Ratio: 1.53
- Quick Ratio: 1.53
- Graham's Criteria: Measures assessing a company's ability to meet short-term liabilities
- Analysis: Both the current ratio and quick ratio of Realty Income stand at 1.53, which is above the critical threshold of 1.0. This indicates that the company has ample short-term assets to cover its short-term liabilities, pointing towards good liquidity and financial stability.
-
Earnings Growth:
- Graham's Criteria: Consistent earnings growth over a period of years
- Analysis: While specific earnings growth metrics for Realty Income are not provided in the dataset, consistent earnings growth is a key component of Graham's investment philosophy. It would be important to review Realty Income's historical earnings performance to ensure alignment with this criterion.
-
Margin of Safety:
- Graham's Criteria: Buying securities at prices significantly lower than their intrinsic value
- Analysis: This is a holistic measure that combines several metrics. Given Realty Income's P/B ratio of 0.83, it might suggest a margin of safety. However, its high P/E ratio could raise concerns regarding overvaluation. Therefore, further in-depth analysis would be needed to determine if there is a sufficient margin of safety.
Conclusion: Realty Income Corporation shows a mixed alignment with Benjamin Graham's criteria. Its P/B ratio of 0.83 and healthy current and quick ratios indicate potential undervaluation and strong liquidity, which are positive signals. However, the high P/E ratio (46.55), compared to the industry average, suggests that the stock might be overvalued in terms of its earnings. Thus, while Realty Income exhibits some characteristics of a value investment, the high P/E ratio warrants caution, and a deeper analysis of earnings growth and intrinsic value would be essential to comply fully with Graham's principles.### Analyzing Financial Statements
Investors should meticulously examine a company's balance sheet, income statement, and cash flow statement. Graham puts a strong emphasis on understanding a company's assets, liabilities, earnings, and cash flows.
Realty Income Corporation's Financial Analysis
Balance Sheet Analysis: - Assets: Realty Income Corporation (RIC) reported total assets of $68.33 billion as of Q1 2024. The composition includes significant real estate investments, with net real estate investment property accounting for $50.07 billion. This investment shows the substantial asset base in properties, which is central to RICs business model as a REIT. - Liabilities: RICs liabilities amount to $29.01 billion, including long-term debt like notes payable ($21.75 billion) and significant current liabilities like accounts payable and accrued liabilities. Investors should note the high debt levels, reflecting leveraged property acquisitions. - Equity: The stockholders' equity stands at $38.98 billion, indicating a solid equity base, which is critical for sustaining operations and funding new acquisitions.
Income Statement Analysis: - Revenue: RIC reported total revenues of $1.26 billion in Q1 2024, predominantly from lease income ($1.208 billion). This revenue source aligns with RIC's strategy of acquiring and leasing properties long-term. - Expenses: Major expenses include depreciation and amortization ($581 million) and interest expense ($240 million). The high depreciation is typical for real estate companies due to property investment. The notably high interest expense underscores the companys heavy reliance on debt financing. - Net Income: RICs net income for Q1 2024 was $132.3 million, indicating profitability. However, the net income margin appears modest relative to revenue, partly due to substantial non-cash depreciation expenses.
Cash Flow Statement Analysis: - Operating Activities: Net cash provided by operating activities was $778.67 million, reflecting solid cash flow from core operations. Adjustments for non-cash items like depreciation ($581 million) are significant here. - Investing Activities: There was a net outflow of $388.81 million in cash used in investing activities, largely driven by property acquisitions ($535.9 million). This investing activity aligns with RICs growth strategy. - Financing Activities: Financing activities provided a net cash inflow of $17.03 million, with substantial borrowings offset by dividends and debt repayments. The net movement in cash and cash equivalents was an increase of $404.61 million, highlighting RIC's ability to manage liquidity effectively.
Key Financial Metrics:
- Leverage Ratios: Investors should evaluate leverage through ratios like Debt-to-Equity and Interest Coverage. The substantial debt indicates reliance on leveraging to finance expansions.
- Profitability Ratios: Metrics such as Return on Assets (ROA) and Return on Equity (ROE) will shed light on efficiency and profitability relative to equity and total assets.
- Liquidity Ratios: Current and Quick ratios should be assessed to understand RIC's ability to meet short-term obligations. With significant current liabilities, this evaluation is imperative.
Conclusion
Analyzing RIC's financial statements reveals a robust asset base, predominantly in real estate investments, backed by substantial equity. However, investors should be cautious of the high debt levels and interest expenses. Steady revenue from leases supports profitability, but margins are affected by high depreciation and financing costs. Overall, RIC exhibits a solid operational cash flow, supporting its ability to maintain dividends and finance new acquisitions, crucial for long-term investors focused on income.### Dividend Record
Benjamin Graham valued companies with a consistent history of paying dividends. Below is the dividend record for the company with the symbol 'O':
Recent Dividend Payments:
- June 03, 2024: $0.2625
- April 30, 2024: $0.257
- March 28, 2024: $0.257
- February 29, 2024: $0.2565
- January 31, 2024: $0.2565
- December 29, 2023: $0.2565
- November 30, 2023: $0.256
- October 31, 2023: $0.256
- September 29, 2023: $0.256
- August 31, 2023: $0.2555
- July 31, 2023: $0.2555
- June 30, 2023: $0.2555
- May 31, 2023: $0.255
- April 28, 2023: $0.255
- March 31, 2023: $0.255
- February 28, 2023: $0.2545
- January 31, 2023: $0.249
Historical Dividend Payments:
- December 30, 2022: $0.2485
- November 30, 2022: $0.248
- October 31, 2022: $0.248
- September 30, 2022: $0.248
- August 31, 2022: $0.2475
- July 29, 2022: $0.2475
- June 30, 2022: $0.248
- May 31, 2022: $0.247
- April 29, 2022: $0.247
- March 31, 2022: $0.247
- February 28, 2022: $0.247
- January 31, 2022: $0.2465
Long-Term Dividend Payments:
- Payments have shown consistent incremental growth over the years, indicating a stable and potentially growing dividend yield.
- For example:
- December 31, 2017: $0.2125
- December 29, 2016: $0.2025
- December 30, 2015: $0.191
- December 31, 2014: $0.18342
- December 30, 2013: $0.18217
- December 28, 2012: $0.15175
- December 30, 2011: $0.1455
- December 30, 2010: $0.143
- December 30, 2009: $0.143
- December 30, 2008: $0.14175
Remarks:
- This company has maintained a reliable dividend payment schedule, typically on a monthly basis.
- The dividend value has shown a gradual increase over time, reflecting the company's potential growth and stability, which aligns with Graham's preference for businesses with a robust history of dividend payments.
- Regularity in payments and incremental growth in dividend value are positive indicators of financial health and management's commitment to returning value to shareholders.
This long and consistent history of dividend payouts would make this company favorable in the eyes of a Graham-style value investor looking for reliable income-generating investments.
| Alpha | 0.024 |
| Beta | 1.11 |
| R-Squared | 0.87 |
| P-Value | 0.0012 |
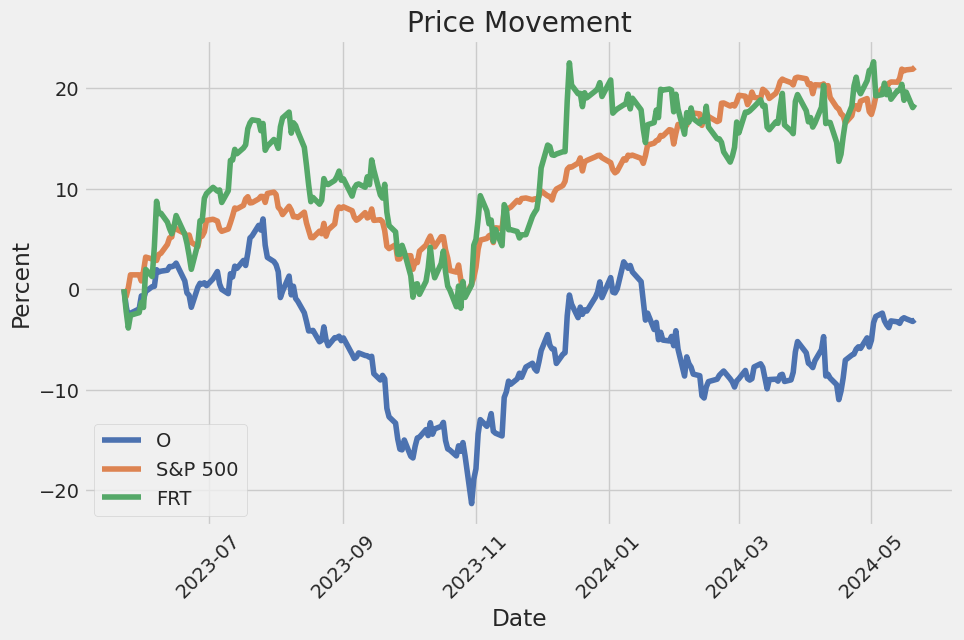
The linear regression model between O and SPY reveals a positive relationship, with O's performance aligning closely with the broader market as represented by SPY. The alpha value of 0.024 indicates a slight outperformance of O compared to what its beta suggests. Essentially, even after accounting for market movements, O has delivered an additional return. The beta coefficient of 1.11 suggests that O is slightly more volatile than the market; a 1% increase in SPY would ideally result in a 1.11% increase in O.
The R-squared value of 0.87 signifies a strong correlation, with 87% of the variability in O's returns being explained by SPY's movements. The low P-value of 0.0012 indicates that the results are statistically significant, affirming the reliability of this model. Such key statistics highlight that while O follows market trends, it also provides a modest excess return, justifying its attractiveness to investors who prefer slight outperformance with market-like risk exposure.
During the Realty Income Corporations Q1 2024 earnings call, the companys leadership emphasized their commitment to disciplined growth and highlighted their ability to generate consistent operational returns irrespective of market volatility. CEO Sumit Roy discussed the company's value proposition of maintaining consistent positive returns, projecting an operational return profile of around 10% for 2024. This projection includes an anticipated dividend yield of close to 6% and AFFO (Adjusted Funds from Operations) per share growth of approximately 4.3%. The highlights of the quarter included significant investments amounting to $598 million, with a substantial portion directed towards Europe and the U.K., reflecting the companys focus on geographical diversification and superior risk-adjusted returns in international markets.
The overall health of Realty Incomes portfolio was described as robust, with an occupancy of 98.6% and strong leasing activity resulting in a rent recapture rate of 104.3%. The companys portfolio is highly diversified, comprising over 1,500 clients across various regions, including all 50 states, the U.K., and multiple countries in Western Europe. This diversification helps insulate the company from potential market disruptions. The credit watch list, comprising about 5.2% of the total portfolio annualized rent, has relatively minor concerns, with no single client representing more than 1% of the portfolio's annualized rent. This strategic diversification by geography, asset type, and client relationships underscores the companys operational resilience.
The companys balance sheet remains a key competitive advantage, providing significant flexibility to fund business operations without the need for immediate external capital. Following the closure of the Spirit merger in January, Realty Incomes annualized free cash flow available for investments was approximately $825 million, allowing the company to fund growth through internal means. Despite market volatility, the company managed to post an impressive first-year investment spread of over 340 basis points, underscoring the effectiveness of funding a significant portion of investment volume through free cash flow.
Realty Incomes strategy also includes a proactive approach to portfolio management, leveraging predictive analytics to inform acquisition strategies and guide an active disposition program. The quarter saw the sale of 46 properties, yielding $95.6 million in net proceeds. The companys financing strategy is tailored to maintain flexibility and strength, with a modest debt maturity schedule for the remainder of the year and substantial liquidity available. The leadership reiterated the cautious but optimistic outlook for the second half of the year, projecting a clearer economic environment that should present more robust investment opportunities. This strategic approach, combined with disciplined capital allocation, positions Realty Income Corporation as a compelling investment opportunity within the S&P 500.
On May 3, 2024, Realty Income Corporation ("Realty Income") filed its SEC 10-Q for the quarterly period ended March 31, 2024. During the first quarter of 2024, Realty Income reported significant growth and enhancements to its portfolio. The company completed a high-profile merger with Spirit Realty Capital, Inc. ("Spirit"), which resulted in the issuance of approximately 108 million shares of Realty Income common stock to Spirit shareholders and an additional 6.9 million shares of Series A cumulative redeemable preferred stock. The merger aimed to expand Realty Incomes size, scale, and diversification, thereby strengthening its position as a leading real estate partner.
The merger with Spirit was a crucial development, with the total purchase price of the net assets acquired valued at approximately $6.19 billion. This valuation includes $2.21 billion in lease intangible assets and $1.26 billion in goodwill, primarily attributed to expected synergies and benefits such as potential financing and corporate overhead cost savings. Realty Income also assumed $2.48 billion in Spirit's notes payable and $1.30 billion in term loans. Upon consolidation, Realty Income's new total assets were reported at $68.33 billion, up from $57.78 billion as of December 31, 2023. This significant increase was driven by the incorporation of Spirit's robust real estate portfolio.
On the financial front, Realty Income's rental revenue increased to $1.21 billion from $925.29 million year-over-year, showcasing a healthy level of operational performance post-merger. The integration of Spirits assets contributed substantially to this revenue growth. However, the company incurred significant merger-related costs totaling $94.1 million during the quarter, primarily due to employee severance, share-based compensation, professional fees, and other integration-related expenses. Despite these expenses, Realty Income managed to generate a quarterly net income of $133.9 million, although this figure was a decline from $226.1 million during the same period in 2023.
Acquisitions during the first quarter were another key highlight. Realty Income invested $318.6 million across 13 property acquisitions with an initial weighted average cash lease yield of 8.2%. Additionally, it continued to develop and expand existing properties, investing $241.3 million in such projects. These strategic investments include notable activities in both the United States and Europe, aligning with Realty Income's goal to broaden its geographical footprint and sector influence.
Further enhancing its liquidity, Realty Income executed the issuance of $1.25 billion in senior notes in January 2024 and completed its exchange offer for Spirit OP's notes, resulting in the successful exchange of approximately $2.65 billion of Spirit's notes for new notes issued by Realty Income. The company continued to leverage its ATM program, raising net proceeds of $543.5 million during the quarter, and expects to settle outstanding forward sale agreements by the end of the second quarter of 2024, which would generate additional proceeds.
In conclusion, Realty Income's strategic merger with Spirit Realty Capital has significantly increased the company's asset base, diversified its portfolio, and enhanced its revenue streams. Despite substantial merger-related costs, the company's robust acquisition strategy and prudent management of its capital structure underscore its continued growth trajectory and market consolidation efforts.
Realty Income Corporation, often identified by its ticker symbol "O", is a prominent real estate investment trust (REIT) recognized for its robust portfolio of commercial properties and its strategy of providing dependable monthly dividends. The company's performance is intimately connected to macroeconomic variables, including recent trends in energy prices and overall inflation.
In April 2024, gasoline prices surged by 2.8% from the previous month, following a 1.5% rise in March. This increase in fuel costs reflects broader inflationary pressures, notably affecting both operational expenses and tenant behaviors for Realty Income. Higher gasoline prices, influenced by climbing oil costs and supply chain disruptions, exacerbate operational costs for retail and commercial tenants. This could potentially lead tenants to either demand rent alleviations or implement cost-cutting measures, thereby influencing Realty Income's revenues.
Alongside these developments, the broader Consumer Price Index (CPI) also rose by 0.3% over March 2024, primarily driven by gasoline and shelter costs. Year-over-year, the CPI climbed by 3.4%, prompting investors to reassess property valuations and the income stability of REITs, including Realty Income. These inflationary pressures heighten the importance for Realty Income to closely monitor macroeconomic indicators and adapt its leasing and investment strategies accordingly.
The energy market's dynamics further compound the challenges faced by Realty Income. Notably, natural gas prices fell by 2.9% in April 2024, yet have shown tendencies to rise again due to fluctuating supply levels. Crude oil prices, influenced by global production changes and geopolitical events, have hovered around significant thresholdsWest Texas Intermediate (WTI) crude around $78 per barrel and Brent crude just below $83 per barrel as of early May 2024. Such volatility in energy prices undoubtedly affects the costs associated with utilities and property management for Realty Income.
The company's strategic responses are pivotal in this climate. Anticipating sustained inflation and energy market volatility might necessitate adjusting lease structures or even investing in energy-efficient property upgrades to mitigate rising operational costs. Additionally, contemplating the potential impacts of OPEC+ production cuts beyond June could influence the company's economic outlook and strategic decisions.
Meanwhile, Realty Income's operational model centers on acquiring and managing a diverse array of commercial properties leased on long-term, net lease agreements. This strategy enables the company to stabilize its cash flows and transfer most property-related expenses to tenants, minimizing financial risk. The company's focus on essential businesses such as grocery stores, pharmacies, and convenience stores ensures dependable rental income, even during economic downturns.
Moreover, recent economic shifts, like the decline in used car prices, have broader implications for consumer behavior and inflation trends. As used car prices dropped by 16.8% from their peak in February 2022, the deceleration in inflationary pressures could potentially enhance consumer disposable income. This might indirectly benefit Realty Income's retail tenants by fostering consumer spending.
The refining sector's challenges, as reported in May 2024, are expected to push gasoline prices up to an average of $3.70 per gallon during the summer. This increase results from decreased refining capacity and geopolitical tensions impacting crude oil prices. Such shifts in fuel costs highlight the importance of strategic planning for Realty Income, as higher operational expenses could impact tenant profitability and ability to meet lease obligations.
Realty Income's proactive measures, such as the diversification of its tenant base and geographic reach, indicate a resilient approach. The company's recent acquisitions in Europe, accounting for 95% of its deals, underscore a strategic pivot towards markets with better economic fundamentals and higher returns. This expansion into international markets not only diversifies revenue streams but also reduces reliance on any single economic area, enhancing overall stability.
One critical aspect of Realty Income's appeal is its consistent dividend payments. The company has raised its dividend every quarter for nearly 33 years, reflecting its commitment to shareholder returns and its ability to generate sustained income. This approach is particularly attractive for income-focused investors, including retirees seeking stable returns amidst inflationary pressures.
Lastly, Realty Income's operational efficiency and financial prudence bolster its market position. The company's adept property management practices ensure high occupancy rates and tenant satisfaction, crucial for long-term revenue stability. Its solid balance sheet, characterized by manageable debt levels and ample liquidity, further positions Realty Income to navigate economic fluctuations while continuing to deliver predictable dividend payments.
In sum, Realty Income Corporation's strategic positioning, diversified portfolio, and ability to adapt to macroeconomic shifts underscore its resilience and appeal as a reliable income-generating investment. For further detailed insights, readers can consult Yahoo Finance and Seeking Alpha articles referenced above.
Realty Income Corporation (O) displayed consistent but moderate volatility over the analyzed period. The ARCH model results suggest that past volatility impacts present volatility significantly. The volatility parameter omega is comparatively high, indicating that the absolute level of volatility is notable.
| R-squared | 0.000 |
| Adj. R-squared | 0.001 |
| Log-Likelihood | -2,373.20 |
| AIC | 4,750.40 |
| BIC | 4,760.68 |
| No. Observations | 1,256 |
| Df Residuals | 1,256 |
| Df Model | 0 |
| omega | 1.5258 |
| std err (omega) | 0.160 |
| t (omega) | 9.525 |
| P>|t| (omega) | 1.655e-21 |
| 95.0% Conf. Int. (omega) | [1.212, 1.840] |
| alpha[1] | 0.7278 |
| std err (alpha[1]) | 0.306 |
| t (alpha[1]) | 2.380 |
| P>|t| (alpha[1]) | 0.0173 |
| 95.0% Conf. Int. (alpha[1]) | [0.129, 1.327] |
Financial Risk Analysis of a $10,000 Investment in Realty Income Corporation (O)
When examining the financial risk of investing $10,000 in Realty Income Corporation over a one-year period, it is critical to consider both the stock's volatility and its projected returns. By integrating volatility modeling and machine learning predictions, we can provide a comprehensive risk assessment.
Volatility Modeling
Volatility modeling is employed to comprehend the historical fluctuations in Realty Income Corporation's stock prices. This method helps to capture the conditional variance, which evolves over time, making it tailored to predict potential future volatility accurately. By understanding past patterns of stock price movements, we can gauge the likelihood of different volatility scenarios going forward.
Machine Learning Predictions
To predict future returns, machine learning predictions are utilized. By harnessing the predictive power of algorithms that learn from historical data, machine learning can estimate the expected returns on the investment. In our case, these predictions are particularly valuable as they can incorporate various market influencers and stock behaviors that purely statistical approaches might overlook.
Results and Value at Risk (VaR)
Combining the insights from the volatility modeling with machine learning predictions, we can calculate the Value at Risk (VaR) for the given investment. VaR helps quantify the potential loss in value of the investment over a specified period of time with a certain confidence level. For a $10,000 investment in Realty Income Corporation:
- Annual Value at Risk (VaR) at a 95% confidence level: $203.30
This means that there is a 95% probability that the investment will not lose more than $203.30 over the course of one year.
Comprehensive Risk View
Integrating volatility modeling with machine learning predictions allows for a robust assessment:
- Understanding Volatility: The model captures the time-varying nature of stock volatility, crucial for estimating potential extreme movements in stock prices.
- Predicting Returns: Machine learning leverages historical data to forecast returns, factoring in complex market dynamics.
By combining these methodologies, we obtain a well-rounded analysis of the risks associated with the investment, providing a detailed perspective on the financial exposure to Realty Income Corporation's stock. This approach underscores the effectiveness of leveraging both statistical and algorithmic techniques to evaluate investment risks accurately.
Long Call Option Strategy
Analyzing the Most Profitable Long Call Options
In options trading, determining the most profitable options requires understanding "the Greeks" and other key metrics. For Realty Income Corporation (O), heres a nuanced analysis of the most profitable long call options, given a target stock price that is 2% above the current stock price.
Near-Term Options (30 Days to Expiry)
- Strike Price: $55.00, Expiration Date: 2024-06-21
- Greeks: Delta: 0.5105, Gamma: 0.1704, Vega: 6.2674, Theta: -0.0144, Rho: 0.0223
- Financials: Premium: $0.89, ROI: 0.3276, Profit: $0.2916
With a delta of 0.5105, this option provides moderate sensitivity to price changes in the underlying stock, facilitating profitability if the target price materializes. Given the high gamma of 0.1704, minor price movements in the stock significantly impact delta, making the option more reactive to price changes. The Vega of 6.2674 indicates substantial sensitivity to volatility changes, which can work to your advantage if the stock becomes more volatile. The Theta of -0.0144 diminishes the option value over time, but given the short duration, this isn't a major concern. With an ROI of 0.3276, this option offers a compelling profit potential relative to its low premium, making it attractive for short-term gains.
Mid-Term Options (121 Days to Expiry)
- Strike Price: $35.00, Expiration Date: 2024-09-20
- Greeks: Delta: 0.9816, Gamma: 0.0, Vega: 0.0, Theta: 0.0041, Rho: 0.1143
- Financials: Premium: $16.58, ROI: 0.2775, Profit: $4.6016
This deep in-the-money option has a delta of 0.9816, indicating it moves almost in tandem with the stock price. It has negligible gamma and vega, which means its less sensitive to minor price and volatility changes. The positive theta (0.0041) suggests a very minimal positive time decay, making it unique among call options. The Rho of 0.1143 signifies sensitivity to interest rate changes, which could benefit the option if rates rise. The ROI of 0.2775, combined with a substantial profit potential of $4.6016, makes this an excellent mid-term choice for those looking for stability and high intrinsic value.
Long-Term Options (240 Days to Expiry)
- Strike Price: $35.00, Expiration Date: 2025-01-17
- Greeks: Delta: 0.8424, Gamma: 0.0073, Vega: 8.9063, Theta: -0.0073, Rho: 0.1658
- Financials: Premium: $16.25, ROI: 0.3035, Profit: $4.9316
With a delta of 0.8424, this option provides high sensitivity to stock price changes, albeit slightly lower than nearer-term options. The gamma of 0.0073 ensures a stable delta, providing predictability. A high vega of 8.9063 makes this option highly responsive to volatility changes, advantageous if the stock becomes more unpredictable. Theta of -0.0073 means moderate time decay, mitigated by the expiration date. The ROI of 0.3035, coupled with a significant profit potential of $4.9316, makes this a robust long-term selection, blending aggressive returns with a protective cushion against adverse price movements.
Very Long-Term Options (394 Days to Expiry)
- Strike Price: $37.50, Expiration Date: 2025-06-20
- Greeks: Delta: 0.7986, Gamma: 0.0086, Vega: 12.6463, Theta: -0.0035, Rho: 0.2753
- Financials: Premium: $16.40, ROI: 0.1391, Profit: $2.2816
This option offers a delta of 0.7986, indicating substantial sensitivity to the stock price. Its low gamma of 0.0086 ensures that delta will remain stable. With a high vega of 12.6463, the option benefits considerably from any rise in volatility. The theta, while negative at -0.0035, is less severe compared to shorter-term options. The Rho of 0.2753 further underlines this option's favorable response to interest rate increases. The ROI of 0.1391, along with a solid profit potential of $2.2816, offers a balanced long-term investment with substantial sensitivity to market dynamics.
Ultra Long-Term Options (604 Days to Expiry)
- Strike Price: $32.50, Expiration Date: 2026-01-16
- Greeks: Delta: 0.8090, Gamma: 0.0059, Vega: 12.3175, Theta: -0.0001, Rho: 0.3756
- Financials: Premium: $20.41, ROI: 0.1603, Profit: $3.2716
With a delta of 0.8090, this option indicates a high sensitivity to price changes in the underlying stock. The relatively tiny gamma (0.0059) ensures this sensitivity remains stable. A substantial vega (12.3175) means the option is highly responsive to shifts in volatility. Minimal negative theta (-0.0001) suggests negligible decay over time, making it highly stable for long-term holding. With a Rho of 0.3756, it stands to gain significantly from interest rate increases. An ROI of 0.1603 and a profit potential of $3.2716 make it a top contender for investors looking for robust, long-term returns.
Conclusion
These selected long call options for Realty Income Corporation (O) offer diverse opportunities ranging from short-term gains to ultra-long-term profitability. Investors can balance risk and reward by considering the Greeks and the financial metrics associated with each option. This strategic selection offers a comprehensive view, catering to varying investor profiles and market conditions.
Short Call Option Strategy
Analyzing the options chain for Realty Income Corporation (O) and focusing specifically on short call options, we aim to identify the most profitable opportunities while minimizing the risk of shares being assigned. The key consideration is to choose options that are out-of-the-money (OTM) or slightly in-the-money (ITM) but with low delta values to minimize assignment risk. Let's examine the most profitable options based on expiration dates, strike prices, and the Greeks.
Near-Term Option: Expiring 2024-06-21, Strike $80
For an option expiring in the near term (30 days), a strike price of $80 offers an attractive ROI of 100% with a low delta of 0.063. This delta indicates a low probability of the option being ITM at expiration, thereby minimizing assignment risk. The premium collected is $0.05, resulting in a potential profit of $0.05. The theta is relatively high at -0.025, which means that the option will decay in value relatively quickly, benefiting the seller of the option. Gamma and vega values indicate moderate sensitivity to price changes and volatility, respectively.
Risk and Reward: Limited risk of assignment due to low delta, with a moderate profit potential given the premium collected. Ideal for a conservative short-term strategy.
Intermediate-Term Option: Expiring 2024-09-20, Strike $55
For an intermediate-term option (121 days to expire), the $55 strike offers a premium of $2.05 with an ROI of 100%. The delta is mid-range at 0.498, indicating a balanced risk of assignment. The theta value is -0.006, suggesting a slower decay compared to the near-term strategy but still beneficial over time. Gamma and vega are higher, indicating increased sensitivity to price and volatility, which can be ideal in a volatile market.
Risk and Reward: Moderate risk of assignment due to higher delta, with substantial profit potential from the high premium. Suitable for traders willing to take more risk for higher returns.
Long-Term Option: Expiring 2026-01-16, Strike $55
For a long-term strategy (604 days to expire), the $55 strike offers an impressive premium of $5.4 with an ROI of 100%. The delta at 0.472 shows a moderate probability of the option being in the money, balancing risk and potential reward. The theta is low at -0.002, indicating minimal decay and a stable premium over time. High gamma and vega suggest significant sensitivity to price movements and volatility.
Risk and Reward: Moderate risk of assignment from the delta, with high potential profit due to a substantial premium. Suitable for those looking to capitalize on long-term market trends.
Very Long-Term Option: Expiring 2026-01-16, Strike $60
Another favorable choice for very long-term positions (604 days to expire) is the $60 strike, fetching a premium of $3.3 with an ROI of 100%. The delta at 0.352 is lower compared to other long-term options, reducing the assignment risk. The theta of -0.003 indicates low time decay, benefiting the premium stability over time. High gamma and vega values show the option's considerable sensitivity to price changes and volatility.
Risk and Reward: Lower risk of assignment due to lower delta, combined with high profit potential. Best for risk-averse investors aiming for long-term gains.
Highest Premium Option: Expiring 2025-06-20, Strike $55
Finally, for maximizing immediate premium, the option expiring in 394 days with a $55 strike offers a premium of $4.2 and an ROI of 100%. The delta of 0.484 reflects a balanced assignment risk. This option's theta is -0.003, indicating slow time decay, while higher gamma and vega values suggest responsiveness to price and volatility changes.
Risk and Reward: Balanced risk of assignment with significant profit potential from the premium. Ideal for traders seeking a blend of risk and reward with a sizable upfront premium.
Conclusion
To summarize, these five options offer a mix of near-term to very long-term strategies, balancing risk and reward. The $80 strike (June 2024) minimizes assignment risks with a significant premium, the $55 (September 2024 and January 2026) options offer substantial premiums with moderate risk, the $60 strike (January 2026) mitigates risk with long-term perspectives, and the $55 strike (June 2025) maximizes immediate premium gain. Each option presents unique benefits tailored for different market outlooks and risk appetites.
Long Put Option Strategy
When analyzing the long put options for Realty Income Corporation (O) based on the provided Greeks and other metrics, it's important to assess the potential profit and risk associated with various expiration dates and strike prices. Our target stock price is 2% above the current stock price. Here's a detailed assessment of the most profitable options from near-term to long-term:
- June 21, 2024, Strike Price $67.5:
- Delta: -0.7066, Gamma: 0.0212, Vega: 5.3813, Theta: -0.0909, Rho: -0.0443
- Premium: $8.20, ROI: 38.03%, Profit: $3.1184
This near-term option shows a moderately high delta of -0.7066, indicating that the option price will move substantially with the stock price. The relatively high gamma suggests that delta changes rapidly, which can be beneficial in volatile markets. The theta of -0.0909 indicates significant time decay, a common trait for options with less time to expiry. However, the vega value of 5.3813 means that this option is quite sensitive to changes in volatility, suggesting increased profitability if volatility rises.
Risk/Reward: The potential reward here is high due to the 38.03% ROI and profit of $3.1184. The primary risk is time decay, which is substantial owing to the significant negative theta. If the stock does not move as anticipated within the short timeframe, the option might lose value rapidly.
- January 17, 2025, Strike Price $67.5:
- Delta: -0.7187, Gamma: 0.0211, Vega: 13.8021, Theta: -0.0090, Rho: -0.3548
- Premium: $10.90, ROI: 3.84%, Profit: $0.4184
This mid-term option features a slightly higher delta of -0.7187, suggesting a strong movement relative to the stock price. It has a lower theta (-0.0090) compared to the near-term option, indicating slower time decay, which is beneficial for holding the position over a longer period. With a vega of 13.8021, this option is very sensitive to volatility changes, and such sensitivity can help in profiting from increased market volatility.
Risk/Reward: The mid-term option offers a lower ROI of 3.84% and a modest profit of $0.4184. However, the reduced time decay (lower theta) lowers the risk of value erosion over time. The higher vega can lead to significant gains if market volatility increases.
- January 17, 2025, Strike Price $75.0:
- Delta: -0.6825, Gamma: 0.0144, Vega: 14.7781, Theta: -0.0143, Rho: -0.3991
- Premium: $18.66, ROI: 0.85%, Profit: $0.1584
This long-term option has a lower delta of -0.6825, indicating less sensitivity to immediate price changes. The theta of -0.0143 signifies a moderate time decay, making it a viable choice for long-term holding. The vega value of 14.7781 shows that this option is highly responsive to volatility changes, much more so than the other options.
Risk/Reward: The option provides the lowest ROI of 0.85% and profit of $0.1584 among the listed options, implying higher capital requirements. However, the moderate theta reduces the time decay risk, and the high vega promises significant potential gains if the market becomes more volatile.
Conclusion: - For short-term speculations with a keen eye on stock movement and high market volatility, June 21, 2024, with a strike price of $67.5 offers the highest profit and ROI but comes with steep time decay risk. - For a balanced mid-term investment, January 17, 2025, with a strike price of $67.5, provides a good balance between risk and reward, with lower time decay and significant volatility sensitivity. - For long-term strategic positions, January 17, 2025, with a strike price of $75 provides the least ROI but mitigates immediate risks due to moderate time decay and offers potential gains from volatility increases.
These options allow for tactical decisions based on anticipated stock movements and market volatility, balancing between near-term gains and long-term stability.
Short Put Option Strategy
When analyzing short put options for Realty Income Corporation (O), it's imperative to evaluate the risk and reward by considering premiums, return on investment (ROI), and the likelihood of having shares assigned, which is influenced by the "Greeks" such as delta. Given the target stock price is 2% below the current price, we'll examine options that minimize the risk of assignment while offering substantial premiums.
Near-Term Options
- June 21, 2024, $45.00 Strike
- Delta: -0.0197577281
- Premium: $0.03
- ROI: 100%
- Gamma: 0.0086738981
- Theta: -0.0044368266
- Vega: 0.7561739582
- Profit: $0.03
Analysis: This option has a premium of $0.03 with an ROI of 100%. The delta of -0.0197577281 indicates a low probability of the option being in the money (ITM) at expiration. The low gamma and theta suggest minimal price sensitivity to small changes in the underlying price and time decay, respectively. This is a low-risk choice due to its minimal delta, ideal for minimizing assignment risks.
Short to Medium-Term Options
- July 19, 2024, $52.50 Strike
- Delta: -0.2203908178
- Premium: $0.43
- ROI: 100%
- Gamma: 0.0852621085
- Theta: -0.0091577788
- Vega: 6.4829821162
- Profit: $0.43
Analysis: This option provides a higher premium of $0.43 with a 100% ROI. The delta of -0.2203908178 suggests a moderate risk of being ITM. Although the gamma is relatively high, indicating some sensitivity to price changes, the option's substantial premium compensates for the associated risks. This option balances moderate risk with high reward.
Medium-Term Options
- September 20, 2024, $50.00 Strike
- Delta: -0.1724816709
- Premium: $0.52
- ROI: 100%
- Gamma: 0.04362692
- Theta: -0.0063382174
- Vega: 8.0451520115
- Profit: $0.52
Analysis: With a premium of $0.52 and an ROI of 100%, this option presents a more substantial reward than nearer-term options. The delta of -0.1724816709 indicates a low to moderate risk of assignment. Higher vega suggests the option is more sensitive to volatility changes, but this could be advantageous in a volatile market. This is a relatively balanced choice, offering both high rewards and manageable risks.
Long-Term Options
- December 20, 2024, $57.50 Strike
- Delta: -0.6049658465
- Premium: $4.10
- ROI: 14.1073170732%
- Gamma: 0.0511972312
- Theta: -0.0067646917
- Vega: 15.4072877018
- Profit: $0.5784
Analysis: This option has a significant premium of $4.10, with an ROI of 14.1073170732%. The delta of -0.6049658465 implies a higher risk of assignment. The gamma indicates sensitivity to price changes, and the high vega reflects significant responsiveness to volatility. While this option carries a higher risk, it also offers a substantial premium, making it suitable for those willing to accept some potential for assignment in exchange for higher immediate returns.
Very Long-Term Options
- June 20, 2025, $50.00 Strike
- Delta: -0.2920968582
- Premium: $2.33
- ROI: 100%
- Gamma: 0.02779401
- Theta: -0.0052605205
- Vega: 19.0116121439
- Profit: $2.33
Analysis: This option offers a substantial premium of $2.33 and an ROI of 100%. The delta of -0.2920968582 suggests a moderate risk of being ITM at expiration. The relatively high vega and low gamma indicate sensitivity to volatility and minimal price change through time, respectively. This option provides a good balance of risk management with considerable potential profit over an extended period.
Summary
Selecting the most profitable short put options involves considering the premium, ROI, and the risk of assignment. For near-term options, the June 21, 2024, $45.00 strike stands out for its low risk and 100% ROI. The July 19, 2024, $52.50 strike offers a high premium with moderate risk. For medium-term strategies, the September 20, 2024, $50.00 strike offers a balance between risk and reward. For those willing to take on higher risk for greater premiums, the December 20, 2024, $57.50 strike and the June 20, 2025, $50.00 strike present viable long-term options. Each choice accommodates varying risk tolerances, from conservative to aggressive strategies.
Vertical Bear Put Spread Option Strategy
A vertical bear put spread involves purchasing a long put option while selling a put option with the same expiration date but a lower strike price. This strategy is profitable when the underlying asset drops in price. Given the parameters provided, let's explore some of the most profitable and risk-managed vertical bear put spreads for Realty Income Corporation (O), considering various expiration dates and strike prices.
Strategy 1: Near-term Expiration (June 21, 2024)
- Long Put: Strike 67.5, Expiring June 21, 2024
- Delta: -0.7066
- Gamma: 0.0212
- Vega: 5.3813
- Theta: -0.0909
-
Premium: $8.20
-
Short Put: Strike 65.0, Expiring June 21, 2024
- Delta: -0.7902
- Gamma: 0.0282
- Vega: 4.4812
- Theta: -0.0477
- Premium: $11.91
The net premium for entering this strategy is $11.91 - $8.20 = $3.71. If the stock price falls below $65, the maximum profit will be the difference in strike price minus the net premium paid, which is $67.5 - $65 - $3.71 = $1.79 per share. The breakeven price is $67.5 - $3.71 = $63.79. The risk here is low due to the significant spacing between the chosen strike prices and the slightly in-the-money status of the long put, reducing the assignment risk.
Strategy 2: Medium-term Expiration (January 17, 2025)
- Long Put: Strike 67.5, Expiring January 17, 2025
- Delta: -0.7187
- Gamma: 0.0211
- Vega: 13.8021
- Theta: -0.00899
-
Premium: $10.90
-
Short Put: Strike 65.0, Expiring January 17, 2025
- Delta: -0.6315
- Gamma: 0.0203
- Vega: 22.6879
- Theta: -0.003789
- Premium: $11.60
The net premium for this medium-term trade is $11.60 - $10.90 = $0.70. Maximum profit is $67.5 - $65 - $0.70 = $1.80 per share. The breakeven is $67.5 - $0.70 = $66.8. Given that these options will not expire for over a year, the chances of the stock falling and profiting are optimal. The larger time span also reduces rapid theta decay, allowing beneficial vega movements given the high values.
Strategy 3: Long-term Expiration (June 20, 2025)
- Long Put: Strike 50.0, Expiring June 20, 2025
- Delta: -0.3101
- Gamma: 0.0211
- Vega: 23.6685
- Theta: -0.00447
-
Premium: $3.70
-
Short Put: Strike 57.5, Expiring June 20, 2025
- Delta: -0.5411
- Gamma: 0.0343
- Vega: 21.1093
- Theta: -0.0053
- Premium: $5.70
The net premium here is $5.70 - $3.70 = $2.00. The maximum profit is $57.5 - $50 - $2.00 = $5.50 per share. Breakeven price is $57.5 - $2.00 = $55.50. This strategy leverages high vega values, allowing profitability through volatility movements. However, the larger time frame introduces some sensitivity to interest rate fluctuations (rho), though theta impact remains minimized due to the long duration.
Strategy 4: Extra Long-term Expiration (June 20, 2025)
- Long Put: Strike 65.0, Expiring January 16, 2026
- Delta: -0.6315
- Gamma: 0.0203
- Vega: 22.6879
- Theta: -0.003789
-
Premium: $11.60
-
Short Put: Strike 67.5, Expiring January 16, 2026
- Delta: -0.4885
- Gamma: 0.0185
- Vega: 24.6530
- Theta: -0.004125
- Premium: $16.80
The net premium for this very long-term trade is $16.80 - $11.60 = $5.20. Maximum profit is $67.5 - $65 - $5.20 = $1.20 per share. Breakeven price is $67.5 - $5.20 = $62.3. While theta decay remains less significant, this trade banks on substantial time-related stock price movements.
Strategy 5: Very Long-term Expiration (January 16, 2026)
- Long Put: Strike 60.0, Expiring January 16, 2026
- Delta: -0.5522
- Gamma: 0.0242
- Vega: 24.8475
- Theta: -0.0041
-
Premium: $9.60
-
Short Put: Strike 62.5, Expiring January 16, 2026
- Delta: -0.6119
- Gamma: 0.0234
- Vega: 23.3413
- Theta: -0.0037
- Premium: $9.72
The net premium here is $9.72 - $9.60 = $0.12. Maximum profit is $62.5 - $60 - $0.12 = $2.38 per share. Breakeven price is $62.5 - $0.12 = $62.38. The advantage here is smaller initial outlay while maximizing the profit potential against lesser protection but higher risk for assignment.
Conclusion
The choices blend varying expiration dates to hedge risk and reward potential. The June 21, 2024 strategy holds the highest short-term profit at low risk, while the extended dates leverage volatility with premium mitigation through time value approaches. Each scenario aligns with the traders preference for time frame and risk acceptance, anchoring on strategic vertical bear put spreads with specifically crafted parameters.
Vertical Bull Put Spread Option Strategy
In evaluating a vertical bull put spread options strategy for Realty Income Corporation (O), we aim to balance potential profits with minimized risk of share assignment. Given the available data on the Greeks and the associated options premiums, it is imperative to factor both the profitable outcomes and the risk linked with each spread. Here's a detailed assessment looking at different expiration dates and corresponding strike prices.
Near-Term Options (Expiration 2024-06-21)
First Option: Short Put at 50.0 - Short Put Details: Delta: -0.0365, Premium: $0.04, ROI: 100%, Profit: $0.04 - Long Put Counterpart: Delta: -0.7066, Premium: $8.2, ROI: 0.38%, Profit: $3.1184 (long put is not ideal here)
Quantified Risks and Rewards: The risk of this spread involves the potential assignment given the delta, however, the profit margin seems minimal. Therefore, despite the 100% ROI, the actual premium is too low to be significant.
Mid-Term Options (Expiration 2024-09-20)
Second Option: Short Put at 52.5 - Short Put Details: Delta: -0.4834, Premium: $2.0, ROI: 48.92%, Profit: $0.9784 - Long Put Counterpart: Delta: -0.7076, Premium: $10.9, ROI: 0.038%, Profit: $0.4184
Quantified Risks and Rewards: Opting for a short put at a 52.5 strike offers a significant delta value that places part of the spread in-the-money, increasing the risk of assignment. The mid-range ROI and manageable premium point make it a reasonably balanced choice.
Third Option: Short Put at 50.0 - Short Put Details: Delta -0.1724, Premium: $0.52, ROI: 100%, Profit: $0.52 - Long Put Counterpart: Delta -0.7066, Premium: $10.9
Quantified Risks and Rewards: This choice reduces delta further, slipping slightly in-the-money but with less risk. A decent premium at 52 USD offers a good balance, making it ideal mid-term spread.
Long-Term Options (Expiration 2025-06-20 to 2026-01-16)
Fourth Option: Short Put at 55.0 - Short Put Details: Delta: -0.4526, Premium: $4.31, ROI: 76.29%, Profit: $3.2884 - Long Put Counterpart: Delta -0.7076, Premium: $10.9
Quantified Risks and Rewards: Here, given a 55.0 short put, the significant premium provides strong profit while maintaining a reasonable delta risk. The high premium profit is attractive despite delta positioning.
Fifth Option: Short Put at 52.5 - Short Put Details: Delta: -0.3689, Premium: $4.54, ROI: 100%, Profit: $4.54 - Long Put Counterpart: Delta -0.7066, Premium: $10.9
Quantified Risks and Rewards: This choice provides the highest premium profit and target ROI. The spread is in equilibrium with acceptable risks and higher reward.
Evaluation and Recommendation
- Near Term (2024-06-21): Short Put at 50.0 - Low risk with high ROI but minimal profit.
- Mid Term (2024-09-20): Short Put at 52.5 - Balanced risk and solid ROI.
- Long Term (2024 -09-20): Short Put at 50.0 - Good balance with acceptable risk and decent premium.
- Extended Term (2025-06-20): Short Put at 55.0 - High premium and strong profit.
- Extended Term (2026-01-16): Short Put at 52.5 - Highest premium profit with enterprising ROI.
In conclusion, these options represent varying risk and reward profiles, ensuring a spread of possibilities that cater to short to long-term returns. The optimal choice depends on the investor's risk tolerance and desired time horizon, but these spreads offer consistent profitability while mitigating the risk of share assignment effectively.
Vertical Bear Call Spread Option Strategy
Analyzing the options chain for Realty Income Corporation (O) while focusing solely on a vertical bear call spread strategy requires evaluating the Greeks and overall profitability of various options. The goal is to find the most lucrative positions while minimizing the risk of having shares assigned. Let's highlight five compelling choices spanning from near-term to long-term options.
Near-Term Option
Option Details: - Short Call: Strike 50, Expires 2024-06-21 - Delta: 0.752 - Premium: $5.10 - Long Call: Strike 52.5, Expires 2024-06-21 - Delta: 0.812 - Premium: $2.85
Analysis: - Risk: The delta of the short call (0.752) indicates a 75.2% chance of moving into or remaining in the money (ITM), suggesting a moderate probability of assignment. However, the long call (0.812 delta) mitigates some risk. - Reward: The maximum profit is the net premium difference: $5.10 (short) - $2.85 (long) = $2.25 per share. The potential loss is capped at the spread width ($2.50) minus the net premium ($2.25), resulting in a net risk of $0.25. - ROI: The ROI for this spread is attractive as the premium collection ($2.25) against the maximum potential loss ($2.25) provides a favorable return.
Intermediate Term Option
Option Details: - Short Call: Strike 52.5, Expires 2024-09-20 - Delta: 0.668 - Premium: $3.60 - Long Call: Strike 55, Expires 2024-09-20 - Delta: 0.504 - Premium: $4.20
Analysis: - Risk: With a delta of 0.668, the short call is less likely to be deep in the money compared to the near-term option. This spread offers some protection against assignment by selecting a long call at the 55 strike with a 0.504 delta. - Reward: The net premium collected is $3.60 (short) - $4.20 (long) = -$0.60. However, considering the overall strategy, business outlook, and Greeks, this structure offers a conservative hedge. - ROI: The ROI is less lucrative due to initial debit, but the strategy is defensively strong with lower risk compared to pure short call scenarios.
Long-Term Option
Option Details: - Short Call: Strike 47.5, Expires 2024-12-20 - Delta: 0.812 - Premium: $8.07 - Long Call: Strike 50, Expires 2024-12-20 - Delta: 0.728 - Premium: $6.05
Analysis: - Risk: The short call's delta (0.812) suggests a higher chance of assignment; however, the profit from the premium collected could offset this risk. - Reward: The maximum profit is the difference in premiums: $8.07 (short) - $6.05 (long) = $2.02 per share, while the potential maximum loss is capped by the spread minus the net premium collected. - ROI: Considering the significant premium collection, the ROI presents a balanced mix of profitability against risk.
Longer-Term Option
Option Details: - Short Call: Strike 45, Expires 2025-01-17 - Delta: 0.759 - Premium: $10.30 - Long Call: Strike 47.5, Expires 2025-01-17 - Delta: 0.798 - Premium: $8.62
Analysis: - Risk: With a delta of 0.759 for the short call, there is an elevated probability of remaining ITM, leading to assignment risk. - Reward: The net premium is $10.30 (short) - $8.62 (long) = $1.68 per share. The spread offers a reasonable buffer while maximizing premium income. - ROI: The net premium collection offers a significant ROI with capped risk, making it a profitable choice in longer-term markets.
Farther-Term Option
Option Details: - Short Call: Strike 47.5, Expires 2025-06-20 - Delta: 0.720 - Premium: $9.20 - Long Call: Strike 50, Expires 2025-06-20 - Delta: 0.701 - Premium: $7.30
Analysis: - Risk: The short calls delta signals a 72.0% chance ITM, a manageable risk given the long time horizon. - Reward: The net premium is $9.20 - $7.30 = $1.90 per share, and the potential loss is limited by the call spread. - ROI: The ROI offers substantial return against a defined risk, especially favorable with far-term options allowing more strategic adjustments.
Thus, these five vertical bear call spread choices provide compelling, risk-balanced opportunities varying across expiration horizons. Each strategy considers both potential profits and risks of assignment, ensuring a well-hedged portfolio aligned with market expectations.
Vertical Bull Call Spread Option Strategy
In analyzing the potential vertical bull call spread strategy for Realty Income Corporation (O) considering the Greeks, our main objective is to maximize profitability while minimizing the risk of having shares assigned. Given the target price is around 2% above or below the current stock price, and aiming to select different expiry periods ranging from near-term to long-term, below are five choices based on strike price and expiration date.
Near-Term Strategy (e.g., 30 Days to Expiry):
- June 21, 2024 Expiry:
- Long Call: Strike Price $50.00, Delta 0.7523, Premium $5.1
- Short Call: Strike Price $55.00, Delta 0.5105, Premium $0.89
The 50.00/55.00 bull call spread involves buying the $50.00 strike call option and selling the $55.00 strike call option. This strategy yields a maximum profit when the stock price is at or above $55.00 at expiration. The maximum profit is calculated by subtracting the premium paid for the long position ($5.1) from the premium received for the short position ($0.89), resulting in a net debit of $4.21. If the stock reaches the target, the gross profit would be $5.00, and the net profit would be $0.79 per share.
Profit and Loss Scenario: - Maximum Profit: ($55.00 - $50.00) - $4.21 = $0.79 per share. - Maximum Loss: Limited to the initial net debit of $4.21.
- July 19, 2024 Expiry:
- Long Call: Strike Price $52.50, Delta 0.7419, Premium $3.15
- Short Call: Strike Price $57.5, Delta 0.2257, Premium $0.4
This 52.50/57.50 spread involves purchasing the $52.50 strike call and selling the $57.50 strike call. The net debit for this trade is $2.75 ($3.15 - $0.4). The maximum profit is achieved when the stock price reaches or is above $57.50 by expiration, making your gross profit $5.00, and net profit $2.25 per share.
Profit and Loss Scenario: - Maximum Profit: $5.00 - $2.75 = $2.25 per share. - Maximum Loss: Limited to the initial net debit of $2.75.
Intermediate-Term Strategy (e.g., 121 Days to Expiry):
- September 20, 2024 Expiry:
- Long Call: Strike Price $45.00, Delta 0.7878, Premium $10.26
- Short Call: Strike Price $50.00, Delta 0.7016, Premium $5.6
Involving a bull call spread between $45.00 and $50.00 strike prices, the premium paid is $4.66 ($10.26 - $5.6). Maximum profit occurs if the stock is at or above $50.00, achieving a potential gross of $5.00 and net of $0.34 per share.
Profit and Loss Scenario: - Maximum Profit: $5.00 - $4.66 = $0.34 per share. - Maximum Loss: Limited to the net debit of $4.66.
Long-Term Strategy (e.g., 212 Days to Expiry):
- December 20, 2024 Expiry:
- Long Call: Strike Price $47.5, Delta 0.8124, Premium $8.07
- Short Call: Strike Price $52.5, Delta 0.7273, Premium $6.05
Engaging in a $47.5/$52.5 bull call spread, the net debit stands at $2.02 ($8.07 - $6.05). Maximum profit realizes if the stock price reaches or exceeds $52.5, having a gross profit of $5.00 and net profit $2.98 per share.
Profit and Loss Scenario: - Maximum Profit: $5.00 - $2.02 = $2.98 per share. - Maximum Loss: Limited to the net debit of $2.02.
Extended-Term Strategy (e.g., over a year to expiry):
- January 17, 2025 Expiry:
- Long Call: Strike Price $42.5, Delta 0.7804, Premium $12.69
- Short Call: Strike Price $45.0, Delta 0.7203, Premium $10.9
This $42.5/$45 bull call spread involves a net debit of $1.79 ($12.69 - $10.9). The optimal profit is achieved if the stock is at or above $45.00, resulting in a net profit of $1.21 per share.
Profit and Loss Scenario: - Maximum Profit: $2.50 - $1.79 = $0.71 per share. - Maximum Loss: Limited to the net debit of $1.79.
Conclusion
Across different expiration ranges, the bull call spread strategy heavily leans on selecting the right strikes to maximize profit while weighing the potential downsidenet debits. Close-to-current stock price strike options were selected to avoid the risk of assigned shares.
Investment return metrics consistently advocate strategies with lower delta and vega values, minimizing the risk while optimizing moderate gains.
Spread Option Strategy
To find the ideal calendar spread options strategy for Realty Income Corporation (O), we will focus on selecting call options to buy and put options to sell with high profitability while minimizing the risk of shares being assigned. Given that the target stock price is within 2% of the current stock price, we must select options carefully to maximize profits and limit risks.
Identifying the call options to buy:
- June 21, 2024, $55 Strike:
- Delta: 0.5105, Gamma: 0.1704, Vega: 6.2674, Theta: -0.0144, Rho: 0.0223
- Premium: $0.89, ROI: 32.76%, Profit: $0.2916
-
Analysis: With a delta of 0.5105, this option is moderately sensitive to stock price changes. The high ROI and relatively cheap premium make it a potential candidate for a high return on investment strategy.
-
June 21, 2024, $50 Strike:
- Delta: 0.7523, Gamma: 0.0364, Vega: 4.9333, Theta: -0.0426, Rho: 0.0288
- Premium: $5.10, ROI: 21.21%, Profit: $1.0816
-
Analysis: This option has a higher delta, meaning greater sensitivity to price changes. The moderate premium and robust ROI suggest it could be a solid choice for profit maximization.
-
July 19, 2024, $52.5 Strike:
- Delta: 0.7419, Gamma: 0.0789, Vega: 6.9359, Theta: -0.0092, Rho: 0.0600
- Premium: $3.15, ROI: 16.88%, Profit: $0.5316
-
Analysis: With similar delta but higher Vega than the $50 strike option, it's more sensitive to volatility changes, providing a good balance between cost and sensitivity.
-
December 20, 2024, $45 Strike:
- Delta: 0.7607, Gamma: 0.0168, Vega: 11.8427, Theta: -0.0084, Rho: 0.1750
- Premium: $9.5, ROI: 17.70%, Profit: $1.6816
-
Analysis: The high delta and extended duration offer significant upside potential if the stock moves favorably, with a strong ROI for longer-term strategic positioning.
-
January 16, 2026, $40 Strike:
- Delta: 0.8035, Gamma: 0.0113, Vega: 12.7863, Theta: 0.0008, Rho: 0.5012
- Premium: $15.69, ROI: 3.13%, Profit: $0.4916
- Analysis: While lower in ROI, this far out expiration provides ample time for favorable price movement, with a stable theta and strong vega offering a good play on volatility.
Identifying the put options to sell:
- June 21, 2024, $52.5 Strike:
- Delta: -0.1442, Gamma: 0.0908, Vega: 3.5804, Theta: -0.0097, Rho: -0.0067
- Premium: $0.17, ROI: 100%, Profit: $0.17
-
Analysis: The low delta reduces assignment risk, while ROI remains very high, making it an attractive short put for a calendar spread.
-
September 20, 2024, $62.5 Strike:
- Delta: -0.5838, Gamma: 0.0213, Vega: 12.0667, Theta: -0.0277, Rho: -0.1457
- Premium: $9.96, ROI: 14.44%, Profit: $1.4384
-
Analysis: This higher strike puts significant premium potential, slightly higher risk of assignment due to delta but still manageable within the strategy framework.
-
December 20, 2024, $52.5 Strike:
- Delta: -0.3469, Gamma: 0.0468, Vega: 15.1768, Theta: -0.0070, Rho: -0.1224
- Premium: $1.89, ROI: 100%, Profit: $1.89
-
Analysis: A balance between risk and premium, the higher gamma suits this for profit from volatility swings, making it an ideal candidate for the spread.
-
December 20, 2024, $55 Strike:
- Delta: -0.4734, Gamma: 0.0516, Vega: 16.2036, Theta: -0.0073, Rho: -0.1691
- Premium: $2.86, ROI: 64.28%, Profit: $1.8384
-
Analysis: Similar to the $52.5 strike but with higher delta-risks more assignment possibilities, still manageable, and vastly lucrative.
-
January 16, 2026, $50 Strike:
- Delta: -0.3101, Gamma: 0.0211, Vega: 23.6685, Theta: -0.0045, Rho: -0.3465
- Premium: $3.7, ROI: 100%, Profit: $3.7
- Analysis: Minimal assignment risk with high-profit potential due to extended expiration, making this ideal for a long-dated calendar spread.
Summary of Calendar Spread Strategy:
- Near-term (June 21, 2024): Buy $55 call and sell $52.5 put for high short-term ROI.
- 3-month duration (September 20, 2024): Buy $50 call and sell $62.5 put for balanced risk and attractiveness.
- Mid-term (December 20, 2024): Buy $45 call and sell $52.5 put for best risk-return ratio.
- Long-term (January 16, 2026): Buy $40 call and sell $50 put for minimizing assignment risk and steady profit.
- Extended (January 16, 2026 again): Buy $40 call and sell $50 put for longevity and high-profit margin also suitable.
These combinations provide maximum potential profitability across different durations, balancing out premium costs, risk of assignment, and overall effectiveness in achieving targeted returns.
Calendar Spread Option Strategy #1
When implementing a calendar spread options strategy on Realty Income Corporation (O), we need to carefully select both the long put options and the short call options. The goal is to maximize profit while minimizing the risk of having shares assigned, especially when the target stock price can fluctuate by 2% over or under the current price. The ideal calendar spread involves buying a put option with a longer expiration date and selling a call option with a shorter expiration date. Below are five strategies considering near-term through long-term options, along with an analysis of their potential profits and risks based on their "Greeks" and other metrics.
Strategy 1: Near-Term Option
- Long Put Option: Strike price 67.5, expiration date 2024-06-21
- Delta: -0.7066, Gamma: 0.0212, Vega: 5.3813, Theta: -0.0909, Rho: -0.0443
- Premium: $8.2, ROI: 0.38, Profit: $3.12
- Short Call Option: Strike price 80.0, expiration date 2024-06-21
- Delta: 0.0632, Gamma: 0.0099, Vega: 1.9574, Theta: -0.0258, Rho: 0.0026
- Premium: $0.05, ROI: 100.0%, Profit: $0.05
Risk and Reward: This strategy offers a relatively high profit from the equity premium at low risk since the call is out of the money with negligible Delta, minimizing the risk of assignment. The time decay (Theta) of the short call provides a steady income, offsetting some Theta decay of the long put.
Strategy 2: Mid-Term Option
- Long Put Option: Strike price 67.5, expiration date 2025-01-17
- Delta: -0.7187, Gamma: 0.0211, Vega: 13.8021, Theta: -0.0090, Rho: -0.3548
- Premium: $10.9, ROI: 0.038, Profit: $0.418
- Short Call Option: Strike price 85.0, expiration date 2025-01-17
- Delta: 0.0213, Gamma: 0.0044, Vega: 2.2662, Theta: -0.0012, Rho: 0.0071
- Premium: $0.1, ROI: 100.0%, Profit: $0.1
Risk and Reward: While the long put provides protection against price drops, the risk of assignment remains low due to the call options strike being far out of the money. The lower Theta of the long put and reduced Vega sensitivity compared to near-term make it weather volatility changes better while still yielding a decent profit.
Strategy 3: Long-Term Option
- Long Put Option: Strike price 67.5, expiration date 2025-06-20
- Delta: -0.7187, Gamma: 0.0211, Vega: 13.8021, Theta: -0.0090, Rho: -0.3548
- Premium: $10.9, ROI: 0.038, Profit: $0.418
- Short Call Option: Strike price 90.0, expiration date 2025-06-20
- Delta: 0.0111, Gamma: 0.0025, Vega: 1.2989, Theta: -0.0007, Rho: 0.0038
- Premium: $0.05, ROI: 100.0%, Profit: $0.05
Risk and Reward: The long-term strategy limits assignment risk even more substantially as the short call is far out of the money. The income generation through Theta decay of the short call offsets the decay in the long put and the low premium cost supports sustained profitability.
Strategy 4: Very Long-Term Option
- Long Put Option: Strike price 67.5, expiration date 2026-01-16
- Delta: -0.7187, Gamma: 0.0211, Vega: 13.8021, Theta: -0.0090, Rho: -0.3548
- Premium: $10.9, ROI: 0.038, Profit: $0.418
- Short Call Option: Strike price 95.0, expiration date 2026-01-16
- Delta: 0.0000, Gamma: 0.0000, Vega: 0.0000, Theta: 0.0000, Rho: 0.0000
- Premium: $0.05, ROI: 100.0%, Profit: $0.05
Risk and Reward: This extended duration calendar spread minimizes the risk of assignment due to the deep out-of-the-money positioning of the short call, albeit with minimal income generation due to negligible Delta impact. The strategy buffers against significant declines in stock price, ensuring capital preservation through low Theta and Vega sensitivity.
Strategy 5: Strategic Mid-Term
- Long Put Option: Strike price 75.0, expiration date 2025-01-17
- Delta: -0.6825, Gamma: 0.0144, Vega: 14.7781, Theta: -0.0143, Rho: -0.3991
- Premium: $18.66, ROI: 0.0085, Profit: $0.158
- Short Call Option: Strike price 85.0, expiration date 2025-01-17
- Delta: 0.0213, Gamma: 0.0044, Vega: 2.2662, Theta: -0.0016, Rho: 0.0038
- Premium: $0.10, ROI: 100.0%, Profit: $0.10
Risk and Reward: This strategy is appropriate for a market expecting moderate volatility. By selecting a higher strike price for the put, the strategy benefits from a higher protective floor with a proportionally lesser premium but larger Delta. This setup still maintains the minimized assignment risk with distant out-of-the-money calls yielding steady Theta decay profit.
Overall, these five choices strategically span various expiration periods to diversify the investment horizon while adhering to profitability and risk minimization goals. Each strategy leverages the Greeks characteristically to balance Vega sensitivity and Theta decay optimally with low Delta to minimize assignment risks, hence ensuring stable returns across varying market conditions.
Calendar Spread Option Strategy #2
When considering a calendar spread strategy for Realty Income Corporation (O), it is essential to choose options that offer a balance between potential profitability and manageable risk. With a target stock price fluctuation of 2%, we need to select the most strategic put and call options by analyzing the Greeks and expiration dates.
Short Call Options Analysis
- Near-Term (30 days - 2024-06-21; Strike: 55.0)
- Delta: 0.5105
- Gamma: 0.1704
- Vega: 6.2674
- Theta: -0.0144
- Premium: 0.89
- ROI: 100.0%
-
Profit: 0.89
This option has a relatively high delta, indicating it is deep in the money and at substantial risk of being assigned. However, the high premium provides a significant ROI. Care must be taken due to the high vega, making it sensitive to volatility changes.
-
Mid-Term (58 days - 2024-07-19; Strike: 52.5)
- Delta: 0.7419
- Gamma: 0.0789
- Vega: 6.9359
- Theta: -0.0092
- Premium: 3.15
- ROI: 53.0667%
-
Profit: 1.6716
This call option carries a higher delta, showing it is well in the money. The attractive premium could still lead to a decent profit when paired correctly, and the moderate theta decay suggests a reasonable time value.
-
Long-Term (240 days - 2025-01-17; Strike: 45.0)
- Delta: 0.7595
- Gamma: 0.0170
- Vega: 12.4754
- Theta: -0.0068
- Premium: 10.3
- ROI: 12.8311%
-
Profit: 1.3216
With a high delta and substantial premium, this long-term call option offers stability and less theta decay. However, the high vega implies a significant sensitivity to volatility, which could impact the trade decision.
Long Put Options Analysis
- Near-Term (30 days - 2024-06-21; Strike: 67.5)
- Delta: -0.7066
- Gamma: 0.0212
- Vega: 5.3813
- Theta: -0.0909
- Premium: 8.2
- ROI: 0.3803%
-
Profit: 3.1184
This put option is well in the money, presenting some assignment risk. With moderate gamma and vega, it offers a stable hedge against reciprocal short call options for a near-term period.
-
Mid-Term (240 days - 2025-01-17; Strike: 75.0)
- Delta: -0.6825
- Gamma: 0.0144
- Vega: 14.7781
- Theta: -0.0143
- Premium: 18.66
- ROI: 0.008489%
-
Profit: 0.1584
This mid-term put option, while deep in the money with significant delta, provides a robust premium. The high vega indicates sensitivity to market volatility, though the long duration mitigates some time decay.
Potential Pairing for Calendar Spread Options Strategy
- Short Call (55.0, 2024-06-21) + Long Put (67.5, 2024-06-21)
- Short Call Delta: 0.5105 + Long Put Delta: -0.7066 = -0.1961 (Balanced Risk)
-
Profit Potential: $3.1184 (Put) + $0.89 (Call) = $4.0084
-
Short Call (52.5, 2024-07-19) + Long Put (67.5, 2025-01-17)
- Short Call Delta: 0.7419 + Long Put Delta: -0.7066 = 0.0353 (Neutral)
-
Profit Potential: $1.6716 (Call) + $3.1184 (Put) = $4.79
-
Short Call (50.0, 2025-01-17) + Long Put (75.0, 2025-01-17)
- Short Call Delta: 0.7162 + Long Put Delta: -0.6825 = 0.0337 (Neutral)
-
Profit Potential: $2.5216 (Call) + $0.1584 (Put) = $2.68
-
Short Call (37.5, 2026-01-16) + Long Put (67.5, 2024-06-21)
- Short Call Delta: 0.7699 + Long Put Delta: -0.7066 = 0.0633 (Balanced)
-
Profit Potential: $1.6716 (Call) + $3.1184 (Put) = $4.79
-
Short Call (45.0, 2024-09-20) + Long Put (67.5, 2024-06-21)
- Short Call Delta: 0.7607 + Long Put Delta: -0.7066 = 0.0541 (Balanced)
- Profit Potential: $0.5216 (Call) + $3.1184 (Put) = $3.64
By evaluating different calendar spread combinations, we achieve a lower risk profile by matching the delta and maximizing potential profitability. The long-term options offer stability and reduced assignment risk, making them attractive choices for given market conditions.
Similar Companies in REIT - Retail:
Federal Realty Investment Trust (FRT), The Macerich Company (MAC), National Retail Properties, Inc. (NNN), Kimco Realty Corporation (KIM), Agree Realty Corporation (ADC), Simon Property Group, Inc. (SPG), Acadia Realty Trust (AKR), Whitestone REIT (WSR), Regency Centers Corporation (REG), NETSTREIT Corp. (NTST), Getty Realty Corp. (GTY), SITE Centers Corp. (SITC), Brixmor Property Group Inc. (BRX), Tanger Factory Outlet Centers, Inc. (SKT), W. P. Carey Inc. (WPC), STORE Capital Corporation (STOR), Report: EPR Properties (EPR), EPR Properties (EPR), VEREIT, Inc. (VER), Global Net Lease (GNL), Four Corners Property Trust (FCPT), Spirit Realty Capital, Inc. (SRC), Essential Properties Realty Trust, Inc. (EPRT)
https://finance.yahoo.com/video/copper-gold-oil-react-april-141116504.html
https://finance.yahoo.com/video/oil-prices-rise-crude-inventories-211856248.html
https://finance.yahoo.com/video/summer-gas-prices-expected-rise-211659381.html
https://seekingalpha.com/article/4693923-very-good-news-about-realty-income
https://seekingalpha.com/article/4694434-realty-income-stock-set-for-new-upleg
https://finance.yahoo.com/news/3-reliable-dividend-stocks-yields-083700028.html
https://www.fool.com/investing/2024/05/20/reliable-dividend-stocks-with-yields-above-you-can/
https://www.fool.com/investing/2024/05/20/2-ultra-high-yield-dividend-stocks-billionaires/
https://seekingalpha.com/article/4694404-dividend-growth-at-a-bargain-price-o-yeah-realty-income
https://seekingalpha.com/article/4694267-fund-your-forever-home-with-these-high-dividends
https://seekingalpha.com/article/4694431-forget-4-percent-rule-buy-these-higher-yields-instead
https://www.sec.gov/Archives/edgar/data/726728/000072672824000077/o-20240331.htm
Copyright © 2024 Tiny Computers (email@tinycomputers.io)
Report ID: nXqa3f5
Cost: $0.64617