Oceaneering International, Inc. (ticker: OII)
2024-02-17
 Oceaneering International, Inc. (ticker: OII) stands as a prominent global provider of engineered services and products primarily to the offshore oil and gas industry, with a focus on deepwater applications. The company, headquartered in Houston, Texas, extends its service portfolio to include remotely operated vehicles, built-to-order specialty subsea hardware, deepwater intervention and manned diving services, non-destructive testing and inspections, and engineering and project management. Oceaneering has effectively diversified its operations by venturing into sectors such as renewable energy, aerospace, material handling, and entertainment industries, leveraging its technological expertise and operational capabilities. This diversification strategy not only mitigates the risks associated with the cyclical nature of the oil and gas industry but also positions Oceaneering for sustainable growth in emerging sectors. Its commitment to safety, innovation, and execution excellence has enabled Oceaneering International, Inc. to establish a robust market presence and foster strategic partnerships globally, underscoring its pivotal role in the energy and technology landscapes.
| Statistic Name | Statistic Value | Statistic Name | Statistic Value | Statistic Name | Statistic Value |
|---|---|---|---|---|---|
| Full Time Employees | 9,200 | Previous Close | 21.79 | Open | 21.76 |
| Day Low | 21.35 | Day High | 22.26 | Volume | 761,843 |
| Average Volume | 739,167 | Average Volume 10 Days | 634,780 | Market Cap | 2,220,986,112 |
| 52 Week Low | 14.99 | 52 Week High | 27.46 | Price to Sales (TTM) | 0.96300834 |
| Enterprise Value | 2,700,293,376 | Profit Margins | 0.03295 | Shares Outstanding | 100,725,000 |
| Shares Short | 4,246,468 | Book Value | 5.619 | Price to Book | 3.9241858 |
| Earnings Quarterly Growth | 0.629 | Net Income to Common | 76,002,000 | Forward EPS | 1.62 |
| Total Cash | 556,427,008 | Total Debt | 1,029,660,992 | Quick Ratio | 1.465 |
| Total Revenue | 2,306,299,904 | Debt to Equity | 179.905 | Return on Assets | 0.051960003 |
| Return on Equity | 0.14482 | Free Cash Flow | 121,395,504 | Operating Cash Flow | 216,606,000 |
| Earnings Growth | 0.611 | Revenue Growth | 0.135 | Gross Margins | 0.16625999 |
| EBITDA Margins | 0.12286 | Operating Margins | 0.0912 | Current Price | 22.05 |
| Target High Price | 34.0 | Target Low Price | 23.0 | Target Mean Price | 26.0 |
| Target Median Price | 24.5 | Number of Analyst Opinions | 6 | Total Cash Per Share | 5.524 |
| EBITDA | 283,359,008 | Current Ratio | 1.822 | Revenue Per Share | 22.933 |
| Statistic Name | Statistic Value | Statistic Name | Statistic Value |
| Sharpe Ratio | 0.3524321039447644 | Sortino Ratio | 5.274919962903367 |
| Treynor Ratio | 0.13264304312578354 | Calmar Ratio | 0.343495152049902 |
Analyzing the provided data for OII, a comprehensive approach, merging both technical and fundamental assessment, is employed to predict the stock's price movement in the forthcoming months. A detailed evaluation of the technical indicators, alongside an in-depth analysis of the financials, cash flows, analyst expectations, and the companys financial health as indicated by ratios such as the Altman Z-Score and Piotroski Score, forms the basis of this analysis.
Technical Analysis Overview: The technical indicators exhibit a progression towards improvement. The MACD histogram values presented for the last five days reveal an ascending trend, indicative of growing bullish momentum. The closing prices, after a period of decline, show signs of stabilization and potential reversal, as evidenced by the uptrend witnessed in the latter part of the dataset.
Financial Health and Fundamental Analysis: The fundamentals show a strong footing, with operating margins and gross margins indicating a healthy cost management and profitability aspect of the company. The balance sheet speaks of a robust financial condition, highlighted by a significant decrease in net debt from 2020 to 2022, and an impressive cash position, asserting financial flexibility. Moreover, indications from analyst expectations and growth estimates project an optimistic outlook for the company, with expected sales growth and a significant improvement in EPS estimated for the current and subsequent year.
Market Sentiment and Ratios: The Altman Z-Score of 3.0797 and Piotroski Score of 7 suggest a stable financial state and low bankruptcy risk, endorsing the company's operational success and fiscal prudence. The encouraging growth estimates, particularly the dramatic surge anticipated in the next quarter and year, align with this sentiment, indicating potential stock appreciation driven by the company's operational and financial performance.
Performance Measures: The risk-adjusted performance measures, including the Sharpe, Sortino, Treynor, and Calmar ratios, elucidate a scenario of reasonable risk-adjusted returns. Despite the Sharpe Ratio showing a lower value, implying moderate performance per unit of total risk taken, the astonishingly high Sortino Ratio highlights an exceptional performance concerning the downside riskan essential factor for risk-averse investors.
Outlook: Given the foundational strength depicted by the financials, progressive optimism echoed by analyst expectations, and the technical indicators hinting at a bullish momentum, the stock of OII seems poised for a potential uptrend in the forthcoming months. The technical forecasts, augmented by solid fundamentals, suggest that the company is navigating in a direction conducive to growth. Investors may consider these elements, acknowledging the substantial upside depicted by the Sortino and Calmar ratios, emphasizing the stock's attractive proposition for both conservative and aggressive investment strategies. The amalgamation of improving technicals, strong financial health, and positive analyst sentiment lays a compelling groundwork for prospective upward price movements in the near term.
In our rigorous application of the principles outlined in "The Little Book That Still Beats the Market," we've meticulously evaluated Oceaneering International, Inc. (OII), focusing on two critical indicators: Return on Capital (ROC) and Earnings Yield. Our analysis reveals a ROC of -25.30%, signaling that OII is currently generating negative returns on its capital investments. This is a crucial red flag as it indicates that the company is not efficiently utilizing its capital to generate profit, a situation that might concern value investors who prioritize efficient capital allocation and profitability. On the other hand, the Earnings Yield stands at 117.91%, an exceptionally high figure that suggests the company's earnings are significantly higher than its stock price, indicative of a potentially undervalued stock or a distortion due to extraordinary items affecting earnings. While the high earnings yield may capture the attention of investors looking for income or value opportunities, the negative return on capital raises questions about the long-term sustainability of the company's operations and profitability. In sum, while Oceaneering International, Inc. presents an intriguing case with its high earnings yield, the negative ROC warrants a cautious approach, encouraging a deeper dive into the company's operational efficiencies, sector performance, and future growth prospects before making investment decisions.
In assessing the suitability of Oceaneering International, Inc. (OII) as an investment following the principles outlined by Benjamin Graham in "The Intelligent Investor," we observe the following key metrics in relation to Graham's criteria:
Price-to-Earnings (P/E) Ratio: The P/E ratio for OII is reported as -12.65. Given Graham's preference for companies with low P/E ratios relative to their industry peers, a negative P/E ratio indicates the company has negative earnings. This deviates from Graham's criterion, as he typically looked for profitable companies with low P/E ratios compared to their industry. Without a comparison to the industry P/E ratio (not available in the provided data), it's challenging to draw a thorough conclusion, yet the negative earnings are a red flag within Graham's framework.
Price-to-Book (P/B) Ratio: OII has a P/B ratio of 1.09, which indicates that the stock is trading slightly above its book value. Graham often looked for stocks trading below their book value as an indicator of undervaluation. While OII's P/B ratio is above this threshold, it's relatively low, suggesting only a slight premium above the company's book value and potentially a minor deviation from Graham's strict criterion.
Debt-to-Equity Ratio: The debt-to-equity ratio for OII is 1.37. This indicates that the company has higher debt levels compared to its equity, deviating from Graham's preference for companies with low debt-to-equity ratios. Such a level of debt suggests a higher financial risk, which Graham cautioned against.
Current and Quick Ratios: Both the current and quick ratios for OII are 2.28, indicating strong liquidity. These ratios suggest that the company can comfortably cover its short-term liabilities with its short-term assets. This aligns well with Graham's emphasis on financial stability and is a positive sign from a value investing perspective.
Earnings Growth: The provided data does not include information on earnings growth. Given Graham's emphasis on consistent earnings growth over several years as an indicator of a company's financial health and potential for long-term success, the lack of this information makes it difficult to fully assess OII according to Graham's criteria.
In conclusion, Oceaneering International, Inc. presents a mixed picture when evaluated through the lens of Benjamin Graham's investment principles. The company's strong liquidity positions, as indicated by its current and quick ratios, align with Graham's criteria for financial stability. However, its negative earnings (as evidenced by a negative P/E ratio), relatively high debt-to-equity ratio, and P/B ratio slightly above 1 present challenges when aligning with Graham's strict investment checklist. Without evidence of consistent earnings growth, these factors might caution a Graham-inspired investor against considering OII as a prime candidate for investment. As always, investors should consider these aspects as part of a broader, thorough analysis involving more detailed financial data and future growth prospects.### Analyzing Financial Statements: A Deep Dive into Oceaneering International Inc.
In examining the financial health and performance of Oceaneering International Inc. (OII) through its quarterly and annual filings, pivotal insights can be drawn from key financial metrics and statements including the balance sheet, income statement, and cash flow statement. These financial documents provide a comprehensive view of the company's operational efficiency, financial stability, and growth potential.
Financial Stability and Asset Management
As of the third quarter of 2023, Oceaneering International Inc. reported a robust balance sheet with assets totaling approximately $2.31 billion. A significant portion of these assets is held in property, plant, and equipment (net), highlighted at about $421.82 million, demonstrating the company's substantial investment in its operational capabilities. The current assets stand at a strong $1.46 billion, inclusive of cash and cash equivalents of about $556.43 million, which indicates solid liquidity and the ability to meet short-term obligations.
The company maintains a diversified asset base, including a noteworthy amount of goodwill ($34.02 million), underscoring the value derived from its acquisitions. Moreover, inventory management appears efficient with a net inventory value of $208.2 million, supporting operational continuity.
Liabilities and Equity Analysis
The total liabilities reported amounted to approximately $1.66 billion, with current liabilities at about $0.8 billion. This includes a considerable portion of long-term debt pegged at around $0.57 billion, indicating the company's leverage and future financial obligations. Despite this, Oceaneering International Inc. exhibits a healthy equity position with total stockholders' equity summing up to $566.27 million. This indicates a sound financial structure capable of supporting expansion and absorbing potential shocks.
Revenue Streams and Profitability
The revenue reported for the nine months ending September 30, 2023, stood at approximately $1.77 billion, against the cost of goods and services sold amounting to $1.48 billion, yielding a gross profit of $293.34 million. This demonstrates effective cost management and the ability to generate substantial markup on its offerings. The operational income reached $133.88 million, further attesting to the companys operational efficiency.
Interest expense and income tax obligations, noted at $28.6 million and $61.56 million respectively, signify the financial expenses the company incurs and its compliance with tax laws, impacting its net profitability. The net income of $52.87 million, alongside basic and diluted earnings per share of $0.53 and $0.52 respectively, underscores the company's profitability and return to shareholders.
Cash Flow Insights
The cash flow statement reveals critical insights into the financial health and operational efficiency of Oceaneering International Inc. The net cash provided by operating activities was reported at $57.14 million, reflecting positive operational cash flow and the company's ability to convert earnings into cash effectively.
Capital expenditures of $66.68 million indicate the company's investment in long-term assets to sustain and grow its operations. Financing activities showed a net cash used figure of $5.14 million, delineating the company's financial strategy in balancing debt, equity, and dividends.
Conclusion
Oceaneering International Inc. exhibits a solid financial standing with robust asset management, healthy liquidity, and prudent liability management. The financial statements articulate a company with efficient operations, strong revenue generation capabilities, and strategic investments fostering long-term growth. Whilst maintaining vigilance on its debt levels and operational costs, OII is poised for sustained financial health and shareholder value creation.Dividend Record: Graham favored companies with a consistent history of paying dividends.
The historical dividend record provided showcases a company that has consistently paid dividends over the years, aligning with Benjamin Graham's investment principles. This company, with the symbol 'OII', has been paying dividends regularly since at least 2011, showing a commitment to returning value to shareholders.
The dividend payments have varied subtly over the years. Starting with a dividend of 0.075 in June 2011, the company gradually increased its dividend payout to 0.15 by February 2012 and further up to 0.27 by August 2014, maintaining that rate for several years before a slight decrease to 0.15 by February 2017. This fluctuation in dividend payments may reflect the company's financial health and policy in different economic conditions, but the ongoing commitment to paying dividends underscores a reliable dividend record that would likely appeal to investors following Graham's investment philosophy.
Notably, the regularity of these dividend payments, alongside their adjustments, suggests a company that is not only committed to providing shareholder returns but also responsive to its financial standing and market conditions. This balance is crucial, as it indicates a company that manages its resources wisely, opting to return profits to shareholders without compromising its stability or growth potentialtraits highly valued in Graham's conservative investing approach.
For investors who prioritize dividend income and stability as per The Intelligent Investor's advice, this company's track record could be seen as attractive. It demonstrates not only a steady hand in financial management but also a consistent approach to shareholder value, elements that align well with the principles of prudent, long-term investing espoused by Benjamin Graham.
| Statistical Measure | Value |
| R-squared | 0.209 |
| Adjusted R-squared | 0.209 |
| F-statistic | 332.5 |
| Prob (F-statistic) | 4.41e-66 |
| Log-Likelihood | -3637.8 |
| AIC | 7280. |
| BIC | 7290. |
| Const Coefficient (Alpha) | 0.0414 |
| Beta Coefficient | 1.7040 |
The linear regression model illustrates a relationship between OII and SPY, focusing on the interaction through coefficients that describe how variations in the SPY (Stock Market) predict changes in OII's returns. With an alpha () value of approximately 0.0414, the model suggests a slight positive offset of OII's performance against the baseline SPY represents. This alpha indicates that OII, on average, marginally outperforms the market baseline when the markets movements are neutral, providing a constant despite fluctuations. However, the significance of this alpha value is debatable given its p-value, hinting that the alpha might not be statistically significant to rely upon for predictive purposes.
Further, the beta () coefficient, established at 1.7040, manifests OII's volatility in relation to the market represented by SPY. A beta greater than 1 suggests that OII is more volatile compared to the broader market. In essence, OII's returns are seen to amplify movements in the SPY, indicating a higher level of risk and potential return. The R-squared value of 0.209 implies that around 20.9% of the variance in OII's returns can be explained by the movements in SPY, leaving a substantial portion of the variance attributed to factors not included in this model. This underscores the complexity of predicting OIIs performance based solely on market movements.
Oceaneering International, Inc. (OII) hosted its third quarter 2023 earnings conference call, highlighting its performance and future outlook. The call was led by Mark Peterson, Vice President of Corporate Development and Investor Relations, with Rod Larson, President and Chief Executive Officer, delivering the primary comments. The company introduced its 2024 earnings guidance, projecting an EBITDA range of $330 million to $380 million, representing a significant improvement over the adjusted EBITDA midpoint guidance of $285 million for 2023. This optimistic forecast is attributed to anticipated growth across Oceaneering's traditional offshore energy businesses, an increasing order backlog, expansion in the Aerospace and Defense Technologies (ADTech) segment, and improvements in non-energy manufactured products businesses. Larson also drew attention to the company's positive free cash flow expectations for 2024, building on the robust foundation of current business fundamentals.
For the third quarter of 2023, Oceaneering reported stronger than anticipated results, underscored by a free cash flow of $53.7 million and adjusted consolidated EBITDA of $84.1 million, positioning at the top end of their guidance and surpassing consensus estimates. These results were primarily driven by heightened global offshore activity, which notably improved operations in their Subsea Robotics (SSR) and Offshore Projects Group (OPG) segments, along with expected advancements in their ADTech segment. Detailed performance analysis of business operations, including SSR's increased revenue and operating income due to ROV pricing improvements and higher survey and tooling activity, were discussed. Additionally, a notable order intake during the quarter was highlighted, contributing to a backlog increase to $556 million, further testifying to the company's growing business prospects.
Looking ahead to the fourth quarter of 2023, Oceaneering anticipates a slight decline in EBITDA on relatively stable revenue compared to the third quarter, attributing the outlook to a seasonal slowdown. Nevertheless, the expectation is for continued healthy activity in offshore markets. In terms of segment specifics, slight variations in revenue and operations are anticipated across different segments, with adjustments made for projected seasonal impacts and other factors influencing performance. For the overall year of 2023, the company narrowed its adjusted EBITDA guidance to $275 million to $295 million and reaffirmed its positive free cash flow forecast, underscoring ongoing business momentum and operational efficiency.
In concluding the call, Larson provided a comprehensive overview of Oceaneering's strategic focus heading into 2024, emphasizing the solid business fundamentals across all operating segments and highlighting the anticipated activity increase and performance improvements in SSR and OPG. The guidance accounts for the potential impact of a continued strong U.S. dollar on international business earnings, especially in Norway, the UK, and Brazil. Reflecting on the favorable supply-demand dynamics, national security priorities, and growing demand for robotic solutions, Larson expressed confidence in the company's growth trajectory and its capacity to generate significant cash flow from operations. The commitment to maintaining financial discipline, a strong safety culture, and a focus on strategic growth initiatives was reiterated as key to positioning Oceaneering for success during the energy transition and beyond.
a)/15d-14(a) Certification of Principal Executive Officer * 31.02 Rule 13a-14(a)/15d-14(a) Certification of Principal Financial Officer * 32 Section 1350 Certifications ** 101.INS XBRL Instance Document * 101.SCH XBRL Taxonomy Extension Schema Document * 101.CAL XBRL Taxonomy Extension Calculation Linkbase Document * 101.DEF XBRL Taxonomy Extension Definition Linkbase Document * 101.LAB XBRL Taxonomy Extension Label Linkbase Document * 101.PRE XBRL Taxonomy Extension Presentation Linkbase Document *
- Filed herewith. ** Furnished herewith.
Oceaneering International, Inc. (OII) has marked a significant milestone in expanding its market presence by securing multiple contracts valued at roughly $200 million in the final quarter of 2023. This impressive achievement, as reported by Zacks Equity Research on Yahoo Finance, underscores OII's growing importance in the global offshore energy sector. These contracts, awarded to OII's Manufactured Products segment, highlight the company's advanced capabilities in providing solutions to international oil and gas operators and marine construction companies. Among these, a substantial greenfield development project in the Gulf of Mexico stands out, for which OII has pledged to deliver electro-hydraulic, steel tube umbilicals covering approximately 34 kilometers, with production planned in Panama City, FL, and Houston, TX, expecting final delivery in the third quarter of 2026.
Further enhancing OII's portfolio is another significant contract for a staged development in the Black Sea, involving the delivery of around 45 kilometers of electro-hydraulic, steel tube dynamic and static umbilicals, with production set to commence in 2024 at the Rosyth, Scotland facility. This project is slated for completion by the third quarter of 2025, reinforcing OII's operational breadth and technical proficiency in subsea distribution hardware provision.
Additionally, within the same timeframe, OII secured agreements to supply subsea production umbilicals and umbilical termination hardware, emphasizing the diversity and scope of its product offerings in the offshore energy sector. Rod Larson, the company's president and CEO, expressed strong confidence in these contracts, highlighting their strategic importance in stabilizing global offshore energy production. Larson's remarks underscore OII's commitment to leveraging its extensive expertise, fostering its position as a leading provider of integrated products and services in the energy and non-energy sectors alike.
The strategic acquisition of these contracts not only signifies OII's competence and reliability but also underscores the ongoing demand for innovation and stability in the global offshore energy realms. These achievements propel OII towards a promising trajectory of future growth and potential new projects, affirming its dedication to excellence, safety, and timely delivery across its operations.
Amidst this backdrop of strategic victories, Oceaneering International has also witnessed slight movement in its stock price, reflecting a minor uptick to $20.25, which, despite underperforming in comparison to broader market indices, indicates a stable investor confidence in the company's growth potential. Investors and analysts alike are keenly anticipating the company's upcoming earnings announcement, with expectations set at an earnings per share of $0.23, depicting a substantial year-over-year growth. This optimism is further bolstered by revenue projections of $631.99 million for the quarter, signifying a robust increase from the previous year.
The positive outlook on OII is also mirrored in the Zacks Rank system, which currently places the company at a #1 (Strong Buy), reflecting a strong potential for future stock performance. Additionally, the company's trading at a Forward Price-to-Earnings (P/E) ratio of 13.33 aligns with the industry average, suggesting a balanced valuation in the context of its sector.
This period of strategic growth and positive market anticipation places OII in a favorable position to capitalize on the evolving market demands, particularly within the offshore energy sector. As the company continues to secure substantial contracts and expand its operational footprint, its commitment to delivering cutting-edge solutions and fostering innovation remains evident. OII's accomplishments and strategic direction underscore its capability to make significant contributions to the global offshore energy landscape, setting a robust foundation for sustained growth and operational excellence.
Oceaneering International, Inc. (OII) experienced notable volatility in its asset returns from February 2019 to February 2024, as indicated by the ARCH model analysis. The omega value at 17.4815 points toward a high level of baseline volatility, suggesting that the asset's returns were subject to significant fluctuation during this period. Furthermore, the alpha[1] coefficient of 0.3375 highlights the persistence of volatility, indicating that past volatility had a substantial impact on future volatility levels.
| Statistic Name | Statistic Value |
|---|---|
| Mean Model | Zero Mean |
| Vol Model | ARCH |
| Log-Likelihood | -3739.06 |
| AIC | 7482.13 |
| BIC | 7492.40 |
| No. Observations | 1,258 |
| omega | 17.4815 |
| alpha[1] | 0.3375 |
The analysis of the financial risk associated with a $10,000 investment in Oceaneering International, Inc. (OII) over a one-year period involves a sophisticated approach that integrates both volatility modeling and machine learning predictions. This dual-faceted analysis helps in understanding the inherent risks and projecting future returns with a higher degree of confidence, thereby providing a well-rounded assessment of the investment's risk profile.
Volatility modeling plays a crucial role in this analysis by quantifying the stock's price fluctuations over time. This method is particularly effective in capturing and predicting the conditional variance in Oceaneering International, Inc.'s stock price series, offering insights into the level of risk associated with the stock due to market dynamics. By meticulously analyzing historical price data, volatility modeling enables the estimation of future volatility, which is essential for risk assessment in financial investment. This approach is instrumental in determining how the price of the stock might fluctuate in the future, based on past trends and patterns, thus offering a predictive insight into potential price volatility.
On the other hand, machine learning predictions contribute significantly by leveraging historical data to forecast future returns. The adoption of a machine learning algorithm, in this case, facilitates the prediction of stock prices by learning from a multitude of features that influence stock movements. This method excels in capturing complex, non-linear relationships between various market factors and the stock price, thereby providing a nuanced forecast of future stock performance. In the context of this analysis, machine learning predictions complement volatility modeling by offering a forward-looking perspective, predicting future returns based on historical data trends and patterns.
Combining these two approaches yields a comprehensive understanding of both the risks and potential returns from investing in Oceaneering International, Inc., thus offering a more complete risk assessment framework. Specifically, the calculated Value at Risk (VaR) at a 95% confidence interval stands at $465.46 for a $10,000 investment over a one-year period. This metric is particularly insightful, as it quantifies the maximum expected loss from the investment, under normal market conditions, providing a clear indicator of the financial risk associated with the investment. By integrating the insights derived from volatility modeling's focus on stock price fluctuations and the forward-looking returns forecasts provided by machine learning predictions, investors are equipped with a nuanced understanding of both the volatility and potential return profiles of their investment, enabling more informed decision-making.
When analyzing the profitability of call options for Oceaneering International, Inc. (OII), we need to consider various factors, including the options' Greeks: delta, gamma, vega, theta, and rho, as well as their strike prices, expiration dates, premiums, return on investment (ROI), and potential profit. Given a target stock price increase of 5% over the current stock price, we aim to identify the most profitable call options that align with this criterion.
Firstly, let's discuss the importance of the Greeks in our analysis: - Delta measures how much the price of an option is expected to move based on a $1 move in the underlying stock. Higher delta values suggest the option's price will move more in line with the stock price, which can be advantageous in bullish scenarios. - Gamma refers to the rate of change in delta over time or for one unit change in the price of the underlying stock. A higher gamma indicates that the delta could increase rapidly, beneficial for long positions in a rising market. - Vega measures sensitivity to volatility. Higher vega indicates the option's price is more sensitive to changes in the volatility of the underlying asset. - Theta is the rate at which an options value declines over time, known as time decay. A less negative theta suggests that the option retains more value as it approaches expiration. - Rho measures an option's sensitivity to a change in interest rates. Higher rho values suggest a greater sensitivity, which can be important in environments of changing interest rates.
Given these considerations and our target stock price, two particularly attractive options emerge from our analysis:
-
$17.5 strike price, expiring on 2024-03-15: This option has a delta of 0.828, signaling a strong correlation with the stock price movement. With a relatively high gamma of 0.03965, this option's delta could increase quickly as the stock price moves upward. The vega of 1.495 suggests it's moderately sensitive to changes in implied volatility, which could benefit if market volatility increases. The theta of -0.0325 is manageable, indicating it doesnt lose value too quickly over time. Rho is 0.92585, indicating some sensitivity to interest rate changes. The ROI and profit are compelling at 0.395 and 1.6025, respectively, making this option attractive for investors expecting a 5% stock price increase.
-
$20.0 strike price, expiring on 2024-04-19: This option shows a delta of 0.718, which is still positively correlated with the stock's price movement but less aggressively than the first option. It has a higher gamma of 0.06929, suggesting its value could increase quickly if the stock price begins to rise. The significantly higher vega of 3.0352 makes this option very sensitive to changes in volatility, which could be advantageous in a bullish and volatile market. The theta of -0.01461 indicates a slower rate of time decay, beneficial for longer-term speculations. Additionally, the rho of 2.12581 suggests a higher sensitivity to interest rate changes. With an ROI of 0.3415 and profit of 0.8025, this option could also be a profitable consideration for a more volatility-sensitive strategy.
Comparing these options, the first one ($17.5 strike, expiring 2024-03-15) offers a higher immediate ROI and profit with substantial delta and gamma, making it more suitable for investors expecting a direct and more immediate increase in the stock's price. However, for investors who anticipate greater volatility and are willing to accept a slightly lower immediate ROI for potentially higher gains due to increasing volatility, the second option ($20.0 strike, expiring 2024-04-19) might be more appropriate.
In conclusion, the choice between these options depends on the investor's expectations regarding stock price movement, volatility, and their tolerance for time decay. Both options present opportunities for profitability but cater to slightly different investment strategies and outlooks.
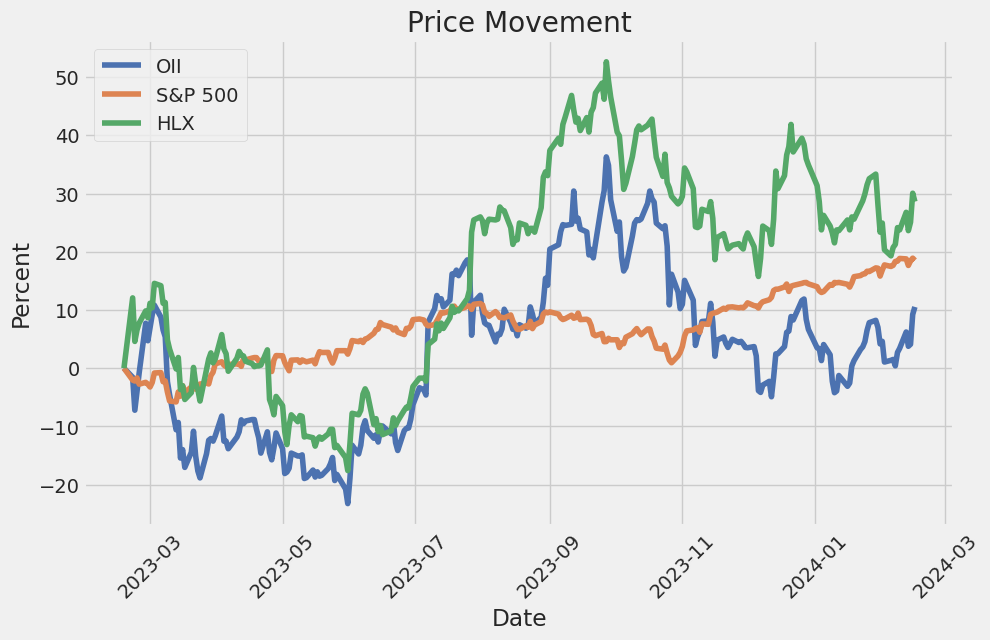
Similar Companies in Oil & Gas Equipment & Services:
Helix Energy Solutions Group, Inc. (HLX), Dril-Quip, Inc. (DRQ), Newpark Resources, Inc. (NR), RPC, Inc. (RES), Oil States International, Inc. (OIS), ChampionX Corporation (CHX), TechnipFMC plc (FTI), NOW Inc. (DNOW), Geospace Technologies Corporation (GEOS), Archrock, Inc. (AROC), Solaris Oilfield Infrastructure, Inc. (SOI), Bristow Group Inc. (VTOL), Subsea 7 S.A. (SUBCY), National Oilwell Varco, Inc. (NOV), Report: Schlumberger Limited (SLB), Schlumberger Limited (SLB), Halliburton Company (HAL)
https://finance.yahoo.com/news/oceaneering-oii-secures-multiple-contracts-175900771.html
https://finance.yahoo.com/news/oceaneering-international-oii-rises-trails-225013478.html
https://finance.yahoo.com/news/suncor-su-faces-penalty-pollution-142700684.html
https://finance.yahoo.com/news/california-resources-crc-snap-aera-135500455.html
https://finance.yahoo.com/news/diamond-offshore-secures-rig-contracts-165700996.html
https://finance.yahoo.com/news/oceaneering-international-oii-rises-yet-225013177.html
https://finance.yahoo.com/news/expro-xpro-boosts-well-construction-133900148.html
https://finance.yahoo.com/news/shell-shel-resumes-supply-boosts-143600365.html
https://www.sec.gov/Archives/edgar/data/73756/000007375623000135/oii-20230930.htm
Copyright © 2024 Tiny Computers (email@tinycomputers.io)
Report ID: 2qYg5e
Cost: $0.70499
https://reports.tinycomputers.io/OII/OII-2024-02-17.html Home