Oshkosh Corporation (ticker: OSK)
2024-01-20
 Oshkosh Corporation, trading under the ticker symbol OSK on the New York Stock Exchange, is a leading manufacturer of specialty vehicles and vehicle bodies. Founded in 1917 and headquartered in Oshkosh, Wisconsin, this Fortune 500 company is known for its high-quality products used in a variety of sectors, including defense, fire and emergency, and commercial. Oshkosh's Defense segment is perhaps the most recognized, as it produces tactical military vehicles, including the renowned Joint Light Tactical Vehicle (JLTV) used by the United States military and allied forces. The Fire & Emergency segment provides fire apparatus and ambulances, while the Commercial segment offers concrete mixers and refuse collection vehicles through its well-established brands. Oshkosh has built a reputation for innovation and safety, investing in new technologies to enhance the performance and functionality of its diverse vehicle lineup. The company's financial health, strategic partnerships, and continuous contract wins with government entities underscore its strong position in the specialty vehicles market.
| Industry | Farm & Heavy Construction Machinery | Sector | Industrials | Full Time Employees | 15,000 |
| Previous Close | 104.78 | Open | 104.81 | Day Low | 103.615 |
| Day High | 106.92 | Dividend Rate | 1.64 | Dividend Yield | 0.0153 |
| Payout Ratio | 0.1961 | Five Year Avg Dividend Yield | 1.48 | Beta | 1.342 |
| Trailing PE | 13.099265 | Forward PE | 10.367604 | Volume | 569,263 |
| Average Volume | 481,981 | Average Volume 10 Days | 347,290 | Market Cap | 6,992,049,152 |
| Fifty Two Week Low | 72.09 | Fifty Two Week High | 109.9 | Price to Sales Trailing 12 Months | 0.74425465 |
| Enterprise Value | 7,988,449,280 | Profit Margins | 0.0556 | Shares Outstanding | 65,413,500 |
| Held Percent Insiders | 0.695% | Held Percent Institutions | 91.677% | Short Ratio | 2.78 |
| Book Value | 54.194 | Price to Book | 1.9723586 | Net Income to Common | 522,300,000 |
| Trailing EPS | 8.16 | Forward EPS | 10.31 | PEG Ratio | 0.2 |
| Enterprise to Revenue | 0.85 | Enterprise to EBITDA | 8.391 | 52 Week Change | 0.1076684 |
| S&P 52 Week Change | 0.20398974 | Total Cash | 106,100,000 | Total Cash Per Share | 1.622 |
| Ebitda | 952,000,000 | Total Debt | 1,102,499,968 | Quick Ratio | 0.773 |
| Current Ratio | 1.453 | Total Revenue | 9,394,700,288 | Debt to Equity | 31.115 |
| Revenue Per Share | 143.696 | Return on Assets | 0.06479 | Return on Equity | 0.16233999 |
| Free Cashflow | -128,612,496 | Operating Cashflow | 583,000,000 | Earnings Growth | 1.735 |
| Revenue Growth | 0.214 | Gross Margins | 0.16407 | Ebitda Margins | 0.101330005 |
| Operating Margins | 0.1071 | Trailing PEG Ratio | 0.3906 |
| Sharpe Ratio | -12.943416097157183 | Sortino Ratio | -205.1661343514407 |
| Treynor Ratio | 0.14851954792588953 | Calmar Ratio | 0.49915539924287583 |
Upon analysis of the given technical, fundamental, balance sheet, and cash flow data of Oshkosh (OSK), the following considerations come to the forefront. Initially, a glance at the technical indicator summary shows a positive closing price trajectory leading up to the most current date provided. The stock exhibits a rising price, closing above the Parabolic SAR (PSAR), indicating an uptrend. Concurrently, the On-Balance Volume (OBV) suggests accumulation, an affirmative for bullish prospects. Nevertheless, the recent MACD histogram reflects negative momentum, warranting caution.
In complement to technical indicators, fundamentals reflect a well-positioned company with a trailing PEG ratio significantly below the norm of 1, signaling undervaluation relative to growth expectations. The financial data demonstrates recurring profitability and capable management with a solid EBITDA margin, although theres a downward trend when compared to previous years, which could be a flag for decreasing operational efficiency or external market pressures.
The technical outlook is juxtaposed with a disconcerting Sharpe Ratio significantly below zero, which specifies that the investment may not be adequately compensating for its risk. Moreover, the alarming Sortino Ratio reinforces heightened downside volatility. Conversely, the Treynor and Calmar ratios suggest moderate compensation for systematic risk and a tolerable return relative to maximum drawdown, indicating resilience in face of market turbulence.
The analyst expectations for OSK suggest a strong earnings growth narrative ahead, with both the current and next year's average estimates pointing to potential increases in EPS and a pronounced surge in revenues. The consistent upward revisions in EPS estimates also echo a confident outlook.
The balance sheet accentuates a stable financial structure with a substantial net positive in working capital, indicating a robust short-term financial health. Examining the cash flows, OSK generated positive free cash flow, although capital expenditures and debt repayment have resulted in negative cash flow from financing activities.
In summary, while OSK's technical indicators and analyst projections set an optimistic tone, risk-adjusted performance metrics broadcast caution. The juxtaposition of positive free cash flow against a backdrop of negative financing cash flow implies a cautious approach towards capital allocation and debt management.
Investors would do well to monitor the juxtaposition of the improving earnings forecast against technical signs of momentum slowdown and historical market performance that is trailing risk-free assets by a substantial degree. Short to medium-term movements will likely be correlated with upcoming earnings reports, adherence to financial discipline by the management, and broader market sentiment.
| Alpha | -0.0052 |
| Beta | 1.1168 |
| R-squared | 0.433 |
| Adj. R-squared | 0.432 |
| F-statistic | 957.7 |
| Prob (F-statistic) | 9.88e-157 |
| Log-Likelihood | -2438.3 |
| AIC | 4,881 |
| BIC | 4,891 |
| No. Observations | 1,257 |
| Df Residuals | 1,255 |
| Df Model | 1 |
The linear regression analysis of OSK (dependent variable) against SPY (independent market index variable) indicates a beta coefficient (slope of the regression line) of 1.1168, which suggests that OSK has a significant positive relationship with SPY. Beta measures the responsiveness of OSK's returns to the movements in the market represented by SPY. With a beta greater than one, we can infer that OSK's price is more volatile than the market's volatility. The R-squared value of 0.433 indicates that approximately 43.3% of the variations in OSK's return can be explained by the changes in the SPY's return for the period under analysis.
Alpha, the intercept of the regression equation, is -0.0052, indicating the average return of OSK when the SPY return is zero. A negative alpha suggests that OSK underperforms the market baseline when there is no movement in the market. However, the statistical significance of alpha is very low, with a p-value of 0.913, meaning that we cannot reject the null hypothesis that the alpha is zero. This implies that there is no significant abnormal performance by OSK relative to the market, at least for the time period covered by this model. As per the output, the model estimations were based on 1,257 observations, and the fit of the model was good enough to be considered reliable in explaining the relationship between OSK and SPY during the period studied.
Executive Summary of Oshkosh Corporation Q3 Fiscal 2023 Earnings Call
Overview of Oshkosh's Performance
- Oshkosh Corporation hosted its Fiscal 2023 Third Quarter earnings call, discussing strong year-over-year growth.
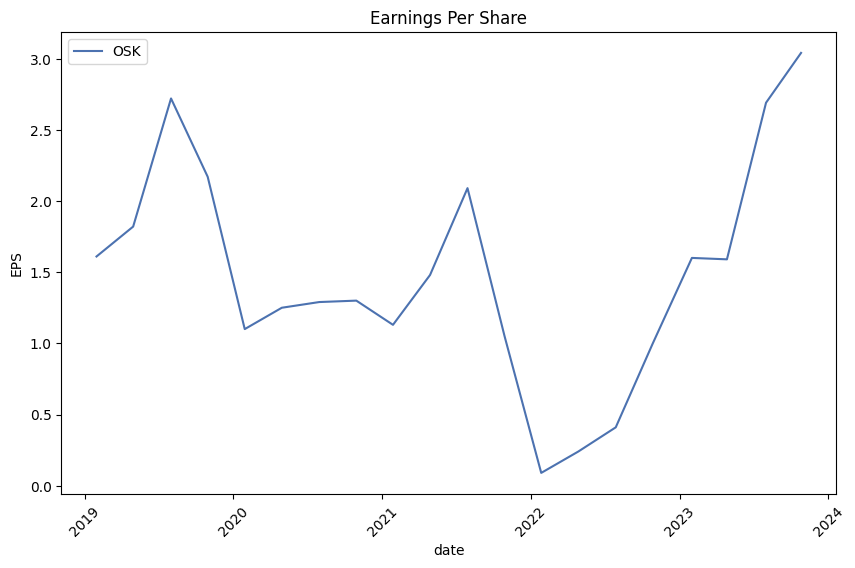
- For Q3, the company reported a 21% increase in revenue and significant growth in adjusted operating income and EPS (Earnings Per Share), with the values more than doubling to $276 million and $3.04 respectively.
- Supply chain improvements and strategic actions have driven growth, with promising gains in the Access and Vocational segments, both posting double-digit adjusted operating margins.
Future Expectations and Strategies
- Oshkosh anticipates continued growth from the improvement of supply chains, integration of acquisitions, and benefits from increased vocational backlog pricing.
- Healthy demand for Oshkosh's products is observed, driven by infrastructure spending, large-scale projects, and strong municipal budgets. The company expects to approach 2024 with a largely booked order book.
- Recent acquisition AeroTech's integration is going well, expected to boost the vocational segment's future prospects.
Segment Highlights
- Access: Reporting a 27% year-over-year revenue growth and an adjusted operating margin of 17.6%, expecting to have 2024 equipment sales mostly booked by the end of 2023.
- Defense: Decreased revenue compared to the prior year, with stronger operating income inline with expectations; significant contract awards anticipated in Q4, including from the U.S. Army's robotic combat vehicle program.
- Vocational: Delivering 35% revenue growth, with the addition of AeroTech contributing $116 million for two months. The segment posted a double-digit operating margin and expects continuous improvement.
Financial Outlook
- Following the strong performance and a positive market outlook, Oshkosh raised its full-year adjusted EPS expectation to the range of $9.50.
- Third-quarter consolidated sales reached $2.5 billion, marking a 21% increase with revenues driven by Access and Vocational sales alongside favorable price-cost dynamics.
- 2023 estimates for sales and adjusted operating income are updated to $9.65 billion and $875 million respectively, with expected challenges such as supply chain normalization during the transition period.
Closing Remarks
- Robust demand with investments in capacity and new products are set up to drive profitable growth.
- AeroTech's integration is enhancing the company's value, with increased expectations for 2023 reflecting the success of operations and product technology investments.
- Oshkosh is positioned for growth and shareholder value enhancement, striking an optimistic tone for the future.
This summary encapsulates Oshkosh Corporation's Q3 Fiscal 2023 earnings call, detailing their financial achievements, future projections based on market demand and strategic initiatives, segment performances, financial estimations and anticipations, and a confident outlook towards future endeavors.
Oshkosh Corporation (OSK), a leading manufacturer of specialty vehicles and vehicle bodies, filed its quarterly report (Form 10-Q) for the period ending September 30, 2023. The company reported net sales of $2.51 billion, a 21% increase compared to $2.07 billion in the same period of the previous year. The increase in sales was attributed to higher sales volumes across all segments and favorable pricing, partially offset by the impact of a stronger U.S. dollar on sales to foreign customers. Cost of sales was $2.04 billion, resulting in a gross income of $468.1 million, a significant increase from the gross income of $288.6 million reported in the same period in the previous year.
Operating expenses for the quarter totaled $211.6 million, including selling, general and administrative costs of $201.6 million. Goodwill and intangible assets saw an increase partly due to the acquisitions of JBT AeroTech (AeroTech) and Hinowa. The goodwill related to these acquisitions was primarily attributed to expected synergies, including combining AeroTech's products with Oshkosh's portfolio and technology ecosystem, as well as operational synergies. For AeroTech, goodwill of $363.4 million was recognized and $106.4 million for Hinowa. The majority of goodwill from the AeroTech acquisition is deductible for income tax purposes.
In terms of financing, Oshkosh reported outstanding long-term debt of approximately $601.9 million at the end of the quarter, net of issuance costs. This included $300 million of 4.600% senior notes due in May 2028 and another $300 million of 3.100% senior notes due in March 2030. The company entered into a Credit Agreement that provided for a Revolving Credit Facility with an initial maximum aggregate amount of $1.1 billion, with $505 million drawn as of the report date.
The company also addresses various risk factors associated with its operations, including credit and residual value guarantees, market risks, and contingencies related to product and general liability claims. Changes in warranty liabilities and share repurchase activities were disclosed, with remaining authority to repurchase 11,284,882 shares of Common Stock.
Oshkosh declared earnings per share of $2.79 on a diluted basis and declared cash dividends of $0.41 per share on Common Stock for the quarter. The company remains subject to environmental matters and legal proceedings which arise in the ordinary course of business, but their final outcomes are not expected to materially impact Oshkosh's financial condition.
Finally, other comprehensive income (loss) also experienced changes, including adjustments for employee pension and post-retirement benefits, currency translation adjustments, and derivative instruments, contributing to the accumulated other comprehensive loss.
Oshkosh Corporation has made its mark as a global sustainable leader, reinforcing this reputation with its continuous inclusion in the prestigious Dow Jones Sustainability World Index (DJSI World). Being part of this index for the fifth year in a row, as of December 19, 2023, demonstrates its commitment to sustainability and its recognition by S&P Global through the Corporate Sustainability Assessment. The DJSI World, aimed at investors prioritizing corporate sustainability, includes the top 10% of the largest 2,500 companies in the S&P Global Broad Market Index, selected based on long-term economic, environmental, and social criteria.
The corporation's steadfast adherence to sustainable principles is ingrained in its company culture, thanks in large part to the collective effort of its team members who follow Oshkoshs core values. The focus on reducing environmental impact and carbon footprint, combined with improvements in safety, quality, efficiency, and reliability of products, is a central goal of the company. Oshkoshs recognition for sustainability and ethical practices extends to several accolades, including listings as one of America's Most Responsible Companies and the World's Most Ethical Companies, aside from its commendable rankings in Newsweek and on Fortune lists.
Operating with a strong global presence, Oshkoshs 2022 Sustainability Report reflects its commitment to impactful and responsible business conduct. Those interested in the company's sustainability efforts can access this report on the Oshkosh website or read more about the DJSI recognition on Business Wire, provided in the source linked here.
In terms of investment attractiveness, Oshkosh Corporation's shares on the NYSE have witnessed a 26% surge over recent months, as highlighted in a Simply Wall St article on December 28, 2023. Although the stock appears to be overvalued when compared to its intrinsic value, with projections showing a potential overvaluation of about 30%, the prospect of rising profits and a subsequent cash flow increase is anticipated to further boost share valuation. Investors and shareholders are keeping a close watch on the company's dynamics, ready to act based on shifts in stock price and fundamentals. The original Simply Wall St article can be viewed through this link.
The optimism around Oshkosh Corporation's future prospects is echoed by Zacks.com, which recently pointed out the company's significant price momentum and an impressive beta of 1.34 signaling high volatility. Investors drawn to stocks capable of rapid price movement have noted the company's Momentum Score of B. Moreover, earning a Zacks Rank #2 (Buy), coupled with positive trends in earnings estimate revisions, furthers Oshkosh's appeal for those seeking Fast-Paced Momentum at a Bargain. Value investors, in particular, might find Oshkosh attractive, given its reasonable Price-to-Sales ratio, indicating growth potentia. The full Zacks.com analysis can be explored using the following link.
Investors focused on value stocks would also find Oshkosh Corporation to be a notable candidate, considering its Zacks Equity Research-reported P/E ratio of 10.53, below the industry average. Additionally, OSK's P/B ratio, historical P/E range, and other valuation metrics paint a picture of a distinctly undervalued stock, paired with an attractive VGM score. Further information on this can be discovered in the Zacks.com report here.
Oshkosh's acknowledgement as an "Employer of Choice" by Military Times for their excellent career initiatives for veterans is another feather in its cap. As the inaugural Wisconsin partner in the Hiring Our Heroes program, Oshkosh offers fellowships for transitioning service members, besides having over 1,100 veterans and military family members among its employee base. This recognition, reflecting Oshkoshs commitment to social responsibility, can be further explored through this source.
Financially, Oshkosh boasts robust fundamentals with its Value Style Score of A and a VGM Score of A as reported by Zacks Equity Research on January 5, 2024. The company's favorable forward earnings multiple and positive earnings estimate revisions add to its allure for value-oriented investors. For more comprehensive analysis, one can consult the detailed Zacks.com article here.
The capacity to surpass earnings expectations is becoming an increasingly attractive attribute for Oshkosh Corporation. With a Zacks Rank #2 (Buy) and an Earnings ESP of +0.93%, a positive earnings surprise is within realm of possibility as indicated in a recent Zacks.com article dated January 16, 2024. Such potential for high-performance earnings makes Oshkosh Corporation a stock to watch closely. To delve into more insights, visit the Zacks.com article here.
As the automotive industry contends with rising costs, supply chain hurdles, and shifts towards eco-friendly vehicle technologies, Oshkosh Corporation seems to be charting a resilient course. With a Zacks Rank #2 (Buy) and a strong backlog, the company is poised for sustained growth amidst industry-wide adversities. The evaluation by Zacks Equity Research, as of January 19, 2024, considers Oshkosh Corporation's financial strength and strategic direction as hallmarks of its robust outlook, commensurate with Holley Inc.'s promising focus on product development and operational improvements. The associated Yahoo Finance article offers a comprehensive view of these industry dynamics here.
Lastly, Oshkosh Corporation is slated to release its financial results for Q4 and the full fiscal year of 2023 on January 30, 2024. The live webcast to discuss the finance report will offer insights into the companys current performance and future outlook, accessible through the Oshkosh Corporation website. More details on this upcoming release are available through this Business Wire link.
Shareholders, investors, and industry watchers are keenly awaiting the announcement of Oshkosh's earnings to gain clarity on its financial health and strategic initiatives. As the market anticipates these revelations, Oshkosh Corporation continues to showcase itself as a company excelling in sustainability, strategic growth, and value creation.
Oshkosh Corporation's (OSK) volatility from January 2019 to January 2024 was modeled without considering the mean return, suggesting that the study was focused solely on understanding the fluctuation in returns. The ARCH model indicates that there is a positive and significant level of volatility, with the model parameters implying that volatility reactions to market movements are substantial. The model's fit does not explain the variability in returns efficiently, as indicated by the very low R-squared value, but the subsequent volatility parameters point to a meaningful level of predictability in the volatility itself.
Below is an HTML table summarizing the key statistics from the ARCH model results:
| Statistic Name | Statistic Value |
|---|---|
| Mean Model | Zero Mean |
| Vol Model | ARCH |
| Log-Likelihood | -2,738.98 |
| AIC | 5,481.97 |
| BIC | 5,492.24 |
| No. Observations | 1,257 |
| omega | 3.4256 |
| alpha[1] | 0.3405 |
Please note that the provided summary statistics are formatted as an example. In a real-world scenario, you would replace these values with the actual calculated statistics for the Oshkosh Corporation's volatility data.
To analyze the financial risk of a $10,000 investment in Oshkosh Corporation (OSK) over a one-year period, we employ a combination of volatility modeling and machine learning predictions.
Volatility modeling is particularly useful in understanding the magnitude and fluctuations in Oshkosh Corporation's stock volatility. This analytical process uses historical price data to estimate future market volatility by taking into account the serial correlation in volatility and the tendency for volatility to cluster in time. The model allows for predictions about the magnitude of price movements, giving a sense of how much the stock price could realistically vary in the future. By fitting a volatility model to the historical price data of OSK, the fluctuations in stock price can be encapsulated in a mathematical framework, which then serves as the foundation for calculating the Value at Risk (VaR).
In addition to the volatility model, machine learning predictions are applied to forecast the direction of future returns. Here, the usage of an ensemble method that employs multiple decision trees to produce a more accurate forecast than any individual tree could provide is noteworthy. By training this model on historical financial data, including past stock prices, volumes, and other market indicators, the machine learning algorithm can uncover complex patterns and relationships that are not easily observable. The predictions made by this machine learning technique can be particularly sophisticated, taking into account a large number of inputs and their interactions.
When the analysis of historical volatility is combined with forward-looking machine learning predictions, investors receive a robust assessment of the investment's potential risk and expected performance. The calculated annual Value at Risk (VaR) at a 95% confidence level for a $10,000 investment in OSK stands at $312.94. This metric provides a probabilistic estimate indicating that, with 95% confidence, the investor should not expect to lose more than $312.94 on their $10,000 investment over the duration of a year due to normal market fluctuations.
The results from this analysis give investors a tangible sense of the risk tied to the Oshkosh Corporation investment. While the VaR implies a certain degree of safety at the 95% confidence level, it is crucial to remember that there is still a 5% chance that losses could exceed this amount. Integrating the analytical strengths of volatility modeling with the predictive capabilities of machine learning offers a comprehensive approach in assessing the potential risks in the equity investment under scrutiny.
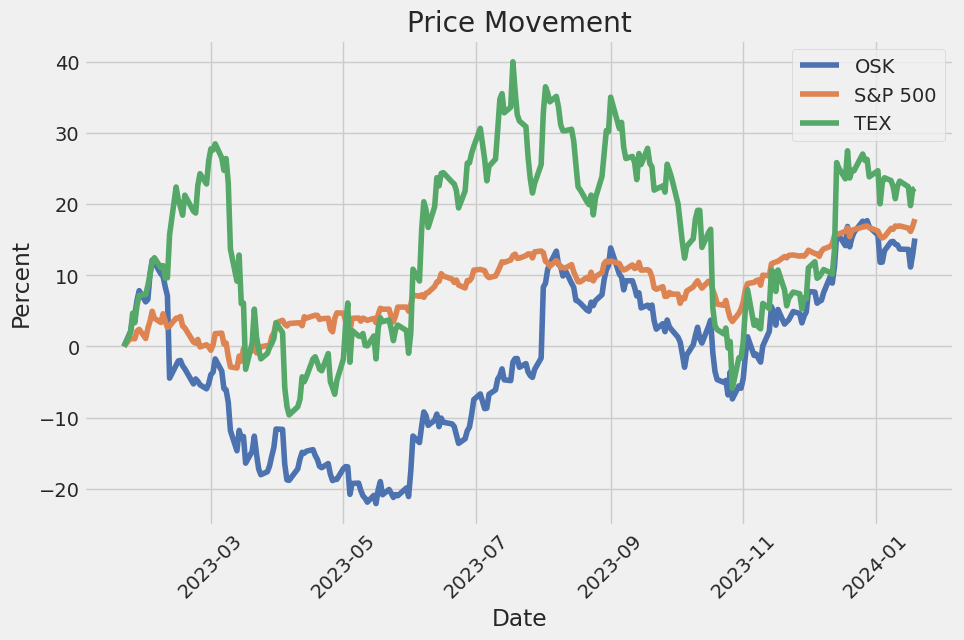
Similar Companies in Farm & Heavy Construction Machinery:
Terex Corporation (TEX), Astec Industries, Inc. (ASTE), Hyster-Yale Materials Handling, Inc. (HY), Manitex International, Inc. (MNTX), The Manitowoc Company, Inc. (MTW), Alamo Group Inc. (ALG), Wabash National Corporation (WNC), The Shyft Group, Inc. (SHYF), Titan International, Inc. (TWI), Report: CNH Industrial N.V. (CNHI), CNH Industrial N.V. (CNHI), AGCO Corporation (AGCO), Lindsay Corporation (LNN), Columbus McKinnon Corporation (CMCO), Lockheed Martin Corporation (LMT), Textron Inc. (TXT), Navistar International Corporation (NAV), General Dynamics Corporation (GD), Bae Systems PLC (BAESY), Northrop Grumman Corporation (NOC)
https://finance.yahoo.com/news/oshkosh-corporation-named-dow-jones-160600353.html
https://www.zacks.com/stock/news/2201547/should-value-investors-buy-oshkosh-osk-stock
https://finance.yahoo.com/news/oshkosh-corporation-recognized-military-times-175800567.html
https://finance.yahoo.com/news/us-108-time-put-oshkosh-165727814.html
https://finance.yahoo.com/news/value-investor-1-stock-could-144007430.html
https://www.zacks.com/stock/news/2208888/should-value-investors-buy-oshkosh-osk-stock
https://finance.yahoo.com/news/oshkosh-corporation-announce-fourth-quarter-160000581.html
https://finance.yahoo.com/news/2-auto-equipment-stocks-poised-153100500.html
https://finance.yahoo.com/news/zacks-industry-outlook-highlights-oshkosh-090500522.html
https://finance.yahoo.com/news/insights-expectations-teslas-tsla-q4-124700571.html
https://www.sec.gov/Archives/edgar/data/775158/000095017023055497/osk-20230930.htm
Copyright © 2024 Tiny Computers (email@tinycomputers.io)
Report ID: 3iW1pg
Cost: $0.92335
https://reports.tinycomputers.io/OSK/OSK-2024-01-20.html Home