Invesco S&P 500 Equal Weight ETF (ticker: RSP)
2024-01-30
 The Invesco S&P 500 Equal Weight ETF (ticker: RSP) is a fund that offers investors the opportunity to gain exposure to the S&P 500 while adopting a unique equal-weight approach. Unlike traditional capitalization-weighted index funds, where larger companies constitute a higher proportion of the investment, RSP assigns an equal weight to each company within the S&P 500 index. This strategy diversifies the risks and potential returns associated with the concentration of larger firms, allowing for a more balanced representation of all sectors. As a result, the performance of RSP can differ from capitalization-weighted S&P 500 funds, potentially outperforming them during certain market conditions where mid-sized companies excel. Invesco's RSP provides a transparent, cost-effective means of achieving a diversified equity portfolio with a single investment vehicle, making it an attractive option for investors looking for an alternative to market-cap-weighted index investing.
| Previous Close | 158.46 | Open | 158.01 | Day Low | 157.85 |
| Day High | 158.84 | Trailing P/E | 20.165594 | Volume | 7,162,605 |
| Average Volume | 6,807,123 | Average Volume 10 Days | 6,523,720 | Bid | 158.37 |
| Ask | 158.58 | Bid Size | 900 | Ask Size | 1,400 |
| Yield | 0.0164 | Total Assets | 49,775,136,768 | 52 Week Low | 133.34 |
| 52 Week High | 158.84 | 50 Day Average | 153.3202 | 200 Day Average | 147.283 |
| Trailing Annual Dividend Rate | 2.01 | Trailing Annual Dividend Yield | 0.012684588 | NAV Price | 158.45 |
| YTD Return | 0.0041825 | Beta 3 Year | 1.0 | Three Year Average Return | 0.0959942 |
| Five Year Average Return | 0.1193988 |
| Sharpe Ratio | 0.2206757639659338 | Sortino Ratio | 3.45560075727755 |
| Treynor Ratio | 0.030812210079808465 | Calmar Ratio | 0.4726003378695054 |
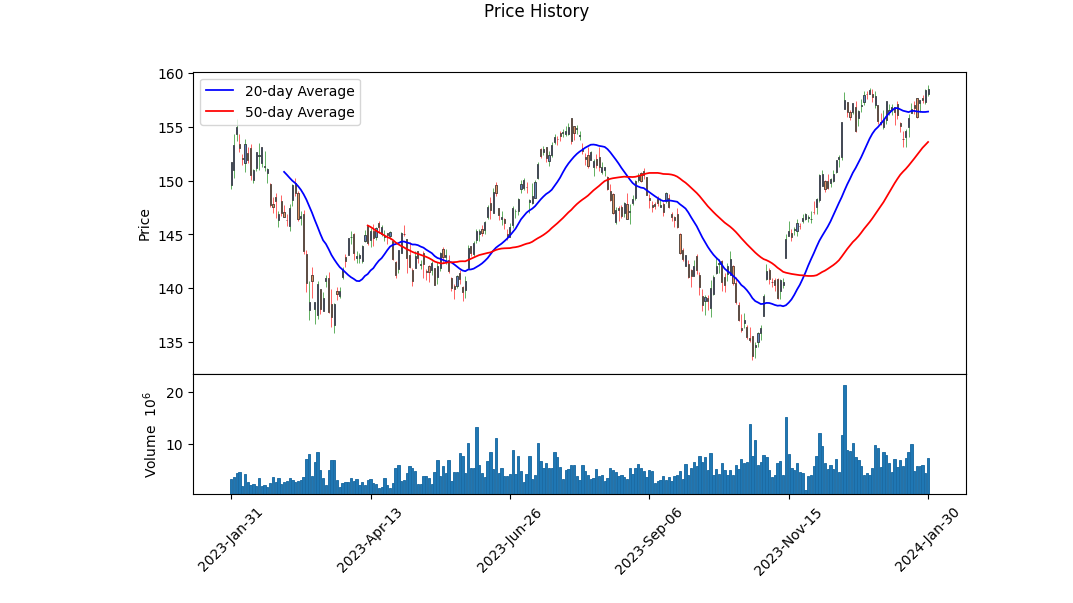
Technical Analysis suggests a neutral to slightly bullish posture for RSP. The price has been exhibiting an uptrend over the past three months, evidenced by rising peaks and troughs in the price chart. A Parabolic SAR (Stop and Reverse) indicator is absent in the early data but later shows that the price is above the PSAR dots, indicating a bullish signal for potential continuation of the uptrend. The On-Balance Volume (OBV) has significantly increased from 0.65791 million to 15.64631 million over the observed period, supporting the upward price movement with associated volume, signaling strong buying pressure.
However, the Moving Average Convergence Divergence (MACD) histogram, another momentum oscillator, showcases a divergence with the price action in the closing stages of the reviewed period. While the price has achieved new highs, the MACD histogram, which moved from negative to just over the zero line, puts forth diminishing momentum that could signal trend exhaustion or a potential reversal.
The fundamentals appear robust, with a reasonable Trailing Price-to-Earnings (P/E) ratio of 20.17 suggesting neither overvaluation nor undervaluation in a vacuum. This is further complemented by a positive Year-To-Date (YTD) return and a stable beta of 1.0, indicating that the fund moves in line with the market. The fund's total asset base is substantial, indicating investor confidence. Moreover, Risk-adjusted return measures Sharpe, Sortino, Treynor, and Calmar ratios are positive, though varied in magnitude. Particularly, the Sortino ratio is strong, implying good returns on bad volatility, an encouraging sign for investors who are risk-averse.
In consideration of all factors, the forecast for RSP is cautiously optimistic. The current technicals and improving performance metrics paint a picture of growth, yet the deceleration indicated by the MACD counsels awareness of a potential correction or consolidation phase in the near term. Investors should be prepared for both a continuation of the current bullish trend, as well as a short-term pullback as part of an overall healthy uptrend. The alignment of the technicals with relatively supportive fundamentals and risk measures tends to favor a continuation of the prevailing trend, though vigilance is warranted given the intricacies of market dynamics.
As an expert on "The Little Book That Still Beats the Market," I should note that calculating the return on capital (ROC) and earnings yield for an exchange-traded fund (ETF) like Invesco S&P 500 Equal Weight ETF (RSP) differs from the process for individual companies. RSP represents a diversified portfolio of companies constituting the S&P 500, with an equal-weight approach rather than market-cap-weighting.
The ROC for an ETF isn't a standard measurement since it generally applies to specific companies and their operational efficiency. However, if we were to consider an analogous metric, we might look at the aggregate or average ROC of the underlying companies, keeping in mind that this would be less meaningful for guiding investment decisions in the ETF compared to individual stock analysis.
Similarly, the earnings yield for RSP would not be directly calculated because the ETF itself doesn't have earnings. Nonetheless, as a proxy, one could look at the composite earnings yield of the underlying companies. This would be the inverse of the ETF's price-to-earnings (P/E) ratio, giving you a sense of the earnings you receive for each dollar invested in the ETF.
For accurate analysis, real-time financial data is necessary. To assess RSP's earnings yield and a conceptual ROC, one would need the current P/E ratio, earnings reports, and other financial data for the ETF and its constituent stocks. Typically, investors rely on the aggregate metrics provided by financial analysts and data platforms that offer insights into the performance of the ETF's components, rather than calculations typically applied to individual stocks as suggested by Joel Greenblatt's strategy in "The Little Book That Still Beats the Market."
| Dependent Variable | y (RSP) |
| R-squared | 0.906 |
| Adj. R-squared | 0.906 |
| F-statistic | 12,080 |
| Prob (F-statistic) | 0.00 |
| No. Observations | 1,256 |
| AIC | 1,448 |
| BIC | 1,458 |
| alpha (Intercept) | -0.01041 |
| beta (Slope) | 1.01359 |
The relationship between RSP (Equal-Weighted S&P 500) and SPY (S&P 500 ETF) represented by this linear regression model is characterized by a high R-squared value of 0.906, indicating a strong positive correlation between the performance of RSP and the broader market as represented by SPY. The adjusted R-squared is equally high at 0.906 which takes into account the number of predictors in the model, reinforcing that the model's explanation of the variance in RSP is robust. The F-statistic is significantly large with a p-value effectively at zero, suggesting that the model fit is statistically significant.
The model's alpha, or intercept, is approximately -0.0104, indicating that when SPY returns are zero, RSP underperforms the SPY by approximately 1.04% (assuming alpha's other interpretations like specific return of RSP not explained by SPY or the expected return when the market's excess return is zero are considered). However, this alpha is not statistically significant, as its p-value is 0.392, which is greater than a common significance level such as 0.05. This means that the alpha value does not provide evidence of RSP's performance deviating from the expected outcomes suggested by the market model within the sample period. The statistically significant beta of 1.0136 suggests that for every percentage point change in SPY, RSP is expected to change by approximately 1.0136 percentage points in the same direction. The confidence interval for beta does not contain the value one, suggesting that RSP exhibits greater than unity sensitivity to movements in the SPY.
The Invesco S&P 500 Equal Weight ETF (RSP) offers a distinctive investment strategy in the landscape of index-based exchange-traded funds (ETFs). Unlike traditional market-cap-weighted indices, RSP assigns equal importance to each constituent of the S&P 500, regardless of the company's size. This approach aims to provide investors with a balanced representation of the U.S. equity market by mitigating the outsized impact that the largest companies might exert in a cap-weighted scheme.
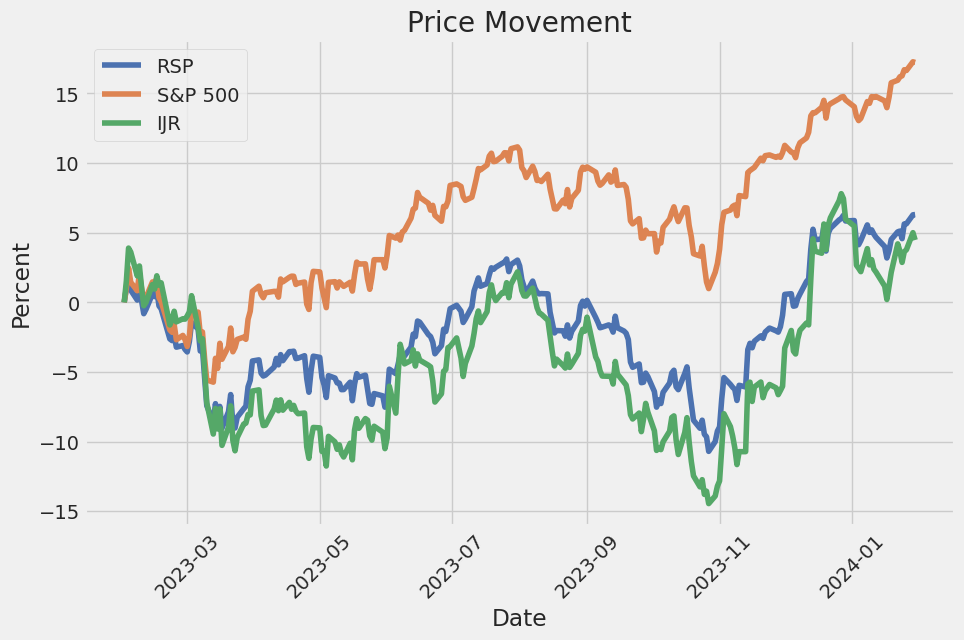
This investment philosophy was put to the test throughout 2023. While technology titanssometimes collectively referred to as the "Magnificent Seven"propelled the S&P 500 to significant gains for the year, RSP demonstrated the effects of equal weighting. Holding no single stock with undue weight meant that RSPs performance was less dependent on the tech sector's heightened valuations. As these leading tech stocks soared, the traditional S&P 500 index experienced profound growth. Conversely, the RSP provided moderate returns, which is reflective of its broad-based approach to the equity market.
As we delve into the constituents of the Invesco S&P 500 Equal Weight ETF, let's take a closer look at its top ten holdings:
| company | symbol | percent |
|---|---|---|
| Enphase Energy Inc | ENPH | 0.24 |
| Ansys Inc | ANSS | 0.24 |
| Align Technology Inc | ALGN | 0.24 |
| Moderna Inc | MRNA | 0.24 |
| Illumina Inc | ILMN | 0.23 |
| Catalent Inc | CTLT | 0.23 |
| Revvity Inc | RVTY | 0.23 |
| First Solar Inc | FSLR | 0.23 |
| Broadcom Inc | AVGO | 0.22 |
| Intel Corp | INTC | 0.22 |
The uniform distribution across these companies indicates RSPs strategic positioning away from concentration risk. Despite the seemingly modest percentages, these holdings remain critical to the ETFs overall structure, as they exemplify its commitment to equal representation.
Interestingly, in the shadow of the traditional S&P 500's downturn as of the beginning of 2024, RSP also experienced a decline, albeit slightly higher than its cap-weighted counterpart. This was captured in detail on the ETF Trends website, which narrated the dip following the S&P 500s end to a nine-week winning streak as of January 5, 2024.
The foundation of RSP lies within the distribution of risk across the array of S&P 500 companies. During market rallies led by a subset of high-performing stocks, the equal-weight ETF may not climb as dramatically as its cap-weighted comparison. However, its resilience during downturns, as seen in the previous year, showcases the balancing act it performs providing stability in the midst of market turbulence. This trade-off between potential gains and a diversified risk profile exemplifies the strategic decision investors make when choosing between cap-weighted and equal-weighted ETF offerings.
The strategic benefits of owning RSP are becoming increasingly acknowledged. Beyond the typical investment in heavy cap stocks or the focus on the "Magnificent Seven," RSP offers an avenue to participate in the broader equity market, including the potential upside from small cap value segments which have shown aggressive movements recently. This strategy appeals to investors seeking a more diversified risk profile and aiming to capture gains across the full spectrum of the S&P 500 companies.
Economic indicators have a direct impact on ETFs like RSP. A report detailed on ETF Trends describes how recent signs of easing inflation and increased consumer spending could affect market dynamics and ETF performance. For instance, lower inflation may lead to less aggressive monetary policy, which could positively influence equity ETFs returns. As these broader economic trends unfold, RSPs performance, like other funds, will inevitably be affected.
Recent labor market data underscores the nuanced nature of the current economic environment. Despite a cooling labor market, job creation showed resilience, potentially informing the Federal Reserve's interest rate decisions. This mix of labor market cooling and robust job additions was captured in reports like the one on January 8, 2024, by ETF Trends, which linked these labor trends to the broader market performance, including that of the RSP.
The condition of the U.S. housing market also presents a significant component in understanding the economic landscape. A report on ETF Trends highlighted the recent downturn in existing home sales alongside positive signs such as builder confidence and building permits. These conflicting signals could foreseeably affect ETFs that track the housing and construction sectors, as well as those like RSP that have exposure to the broader market. The upcoming releases of housing data promise to shed additional light on the state of the economy, hence influencing investment strategies for ETFs.
Against this backdrop, it is clear that the Invesco S&P 500 Equal Weight ETF functions in a complex, ever-evolving financial ecosystem. The nuances of its equal weight strategy provide a contrast to more traditional cap-weighted approaches, underlining the need for investors to carefully consider their risk tolerance and the cyclical nature of markets in their decision-making process. The various economic indicators and market performances present a multifaceted picture that requires constant vigilance and adaptability from investors in the ETF space.
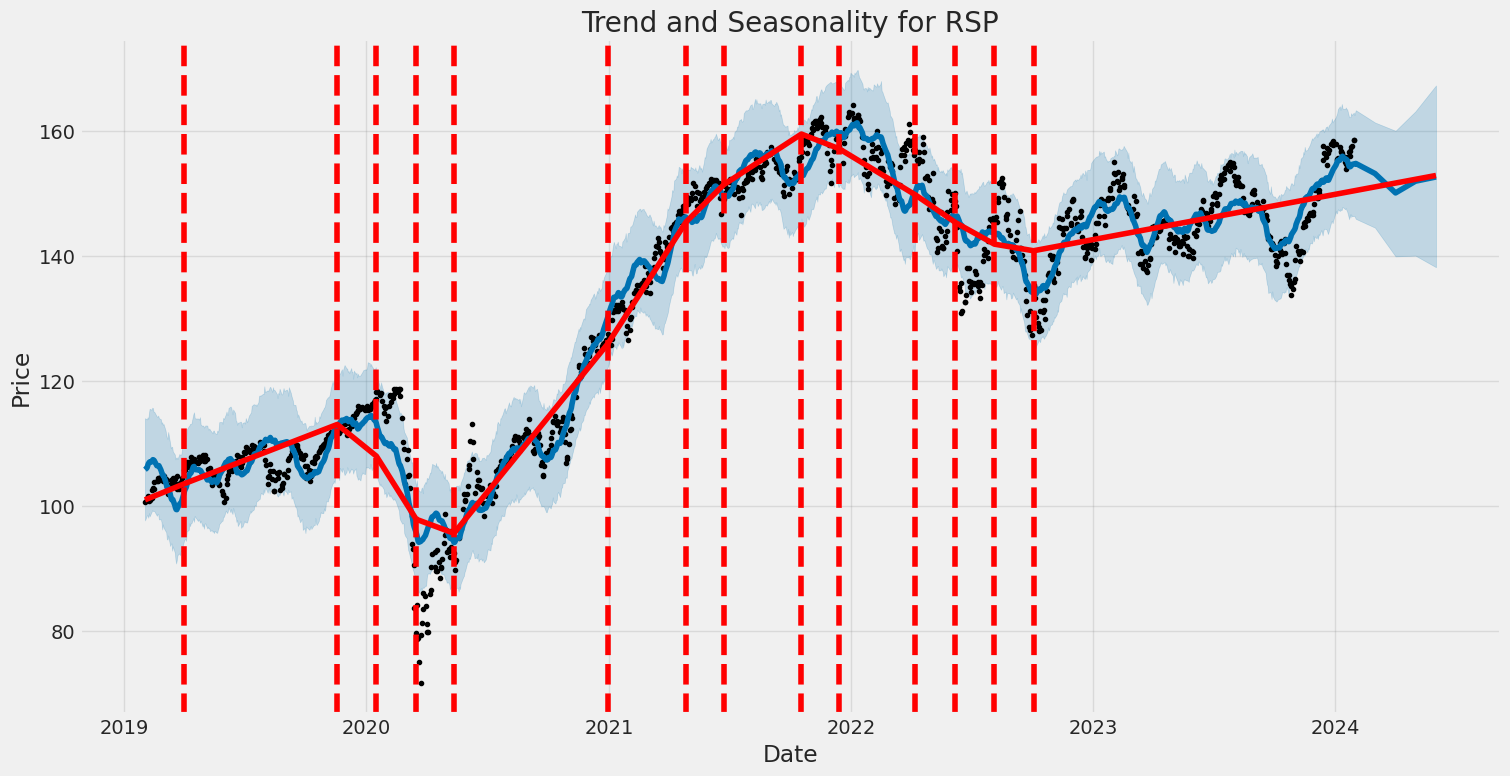
The Invesco S&P 500 Equal Weight ETF (RSP) experienced volatility from February 1, 2019, to January 30, 2024, as summarized by the ARCH model results. The model suggests the ETF's returns do not have a predictable pattern regarding their average value, as indicated by the 'Zero Mean' model with an R-squared close to 0. The volatility of the ETF is primarily influenced by its past squared returns, shown by an omega coefficient of 0.9183 indicating the baseline volatility level and an alpha[1] coefficient of 0.5383 depicting the effect of the last period's return on current volatility.
| Statistic Name | Statistic Value |
|---|---|
| R-squared | 0.000 |
| Adj. R-squared | 0.001 |
| Log-Likelihood | -2005.88 |
| AIC | 4015.76 |
| BIC | 4026.03 |
| No. Observations | 1,256 |
| omega | 0.9183 |
| alpha[1] | 0.5383 |
In analyzing the financial risk associated with a $10,000 investment in Invesco S&P 500 Equal Weight ETF (RSP) over a one-year period, a two-pronged approach involving volatility modeling and machine learning predictions is adopted to gain a comprehensive understanding of potential investment outcomes.
Volatility modeling plays a crucial role in assessing the level of risk in the ETF's stock price fluctuations. By employing a sophisticated time-series model, the variability in returns over time is examined, where periods of high and low volatility are identified. This type of analysis is adept at capturing the 'clustering' effect often observed in financial markets, where volatile periods tend to be followed by more volatility, and periods of tranquility are followed by similar calm. Such modeling captures the dynamic nature of the ETF's risk profile, making it possible to estimate future levels of volatility using historical price information.
Moreover, the adaptation of machine learning predictions, specifically the technique that employs numerous decision trees to forecast future price movements, complements the volatility modeling. This predictive model leverages historical data and patterns to anticipate the direction of future returns, incorporating a wide array of variables that can impact the performance of the ETF. By analyzing past performance and other market indicators, this method builds a nuanced forecast that informs the estimate of potential outcomes for the investment in the ETF.
The relationship between volatility modeling and machine learning predictions is symbiotic. Volatility estimates inform the assessment of risk and potential price movements, which are crucial inputs for the machine learning algorithm. In turn, the predictions generated serve to confirm or adjust the parameters of the volatility model, ensuring that it reflects the subtleties learned from the data.
The results of these analyses are captured in the Value at Risk (VaR) calculation, which quantifies the maximum expected loss at a 95% confidence interval. In the context of the $10,000 investment in RSP, the calculated VaR over a one-year period stands at $140.36. This figure represents the maximum expected loss not to be exceeded in 95% of the scenarios generated by the models. It is noteworthy that this metric consolidates the insights gained from both the volatility and predictive modeling into a single, tangible number that investors can use to gauge the risk of their investment. Despite the inherent limitations of any model-based approach, the VaR provides a useful benchmark for potential investment risk.
By integrating volatility modeling with machine learning predictions, investors gain a layered understanding of both expected returns and the associated uncertainties. These advanced analytical methods provide investors with a robust framework for evaluating the potential risks of equity investments, framed by a nuanced appreciation of the dynamic nature of market behavior.
Similar Companies in Investment Trusts/Mutual Funds:
iShares Core S&P Small-Cap ETF (IJR), Report: iShares Russell 1000 Value ETF (IWD), iShares Russell 1000 Value ETF (IWD), iShares Core S&P Mid-Cap ETF (IJH), iShares S&P 500 Value ETF (IVE), iShares Russell 2000 Value ETF (IWN), State Street Global Advisors (SPY), Vanguard (VOO), BlackRock (IVV), Direxion (RSPY), First Trust (RSPF)
https://seekingalpha.com/article/4658363-rsp-its-on-the-right-track
https://www.etftrends.com/innovative-etfs-channel/early-wrap-up-key-etf-trends-2023/
https://www.youtube.com/watch?v=NMjTD2YTHeU
https://www.fool.com/investing/2023/12/21/are-the-magnificent-seven-stocks-too-risky-for-you/
https://seekingalpha.com/article/4659088-3-dividend-divas-to-help-you-sleep-well-at-night
https://seekingalpha.com/article/4660166-2-dividend-growth-names-for-the-long-term-investor
https://www.etftrends.com/innovative-etfs-channel/sp-500-snapshot-index-finishes-2023-up-24-7/
https://www.etftrends.com/innovative-etfs-channel/sp-500-snapshot-9-week-win-streak-snapped/
https://www.etftrends.com/innovative-etfs-channel/last-weeks-labor-market-insights/
https://www.etftrends.com/innovative-etfs-channel/sp-500-snapshot-index-sits-0-3-below-record-high/
https://seekingalpha.com/article/4663027-5-closed-end-fund-buys-in-december-2023-plus-1-sell
https://www.etftrends.com/innovative-etfs-channel/last-weeks-inflation-numbers/
https://www.etftrends.com/innovative-etfs-channel/sp-500-snapshot-index-rallies-record-high/
https://www.etftrends.com/innovative-etfs-channel/whats-happening-housing-market/
Copyright © 2024 Tiny Computers (email@tinycomputers.io)
Report ID: r0C2lv
Cost: $0.49448
https://reports.tinycomputers.io/RSP/RSP-2024-01-30.html Home