Banco Santander, S.A. (ticker: SAN)
2024-02-02
 Banco Santander, S.A., operating under the ticker SAN, is a prominent player in the global banking sector, headquartered in Spain. It is one of the largest banks in the Eurozone by market value, offering a wide array of financial products and services including retail banking, corporate banking, investment banking, and insurance, catering to both individual and institutional clients. With a significant presence in Europe, Latin America, North America, and Asia, Santander has successfully leveraged its geographical diversification to mitigate regional financial volatility and capitalize on growth opportunities across different markets. The bank is known for its strategic acquisitions, digital banking advancements, and commitment to sustainability, showcasing a forward-thinking approach in the competitive financial landscape. Despite challenges such as fluctuating global interest rates and regulatory changes, Santander has maintained robust financial health, as evidenced by its consistent performance in earnings reports and its ability to navigate economic downturns, making it an influential entity in the international banking community.
| Full Time Employees | 212,764 | Total Pay for Ana Botin-Sanz | 11,928,384 | Total Pay for Hector Blas Grisi | 0 |
|---|---|---|---|---|---|
| Previous Close | 4.00 | Open | 4.07 | Day Low | 3.9819 |
| Day High | 4.076 | Dividend Rate | 0.15 | Dividend Yield | 0.0372 |
| Payout Ratio | 0.2115 | Five Year Avg Dividend Yield | 5.29 | Beta | 1.327 |
| Trailing PE | 5.8 | Forward PE | 4.5111 | Volume | 8,752,161 |
| Market Cap | 65,061,904,384 | 52 Week Low | 3.20 | 52 Week High | 4.29 |
| Price to Sales (TTM) | 1.4536 | Profit Margins | 0.2475 | Shares Outstanding | 15,825,600,512 |
| Book Value | 6.007 | Price to Book | 0.6759 | Net Income to Common | 11,075,999,744 |
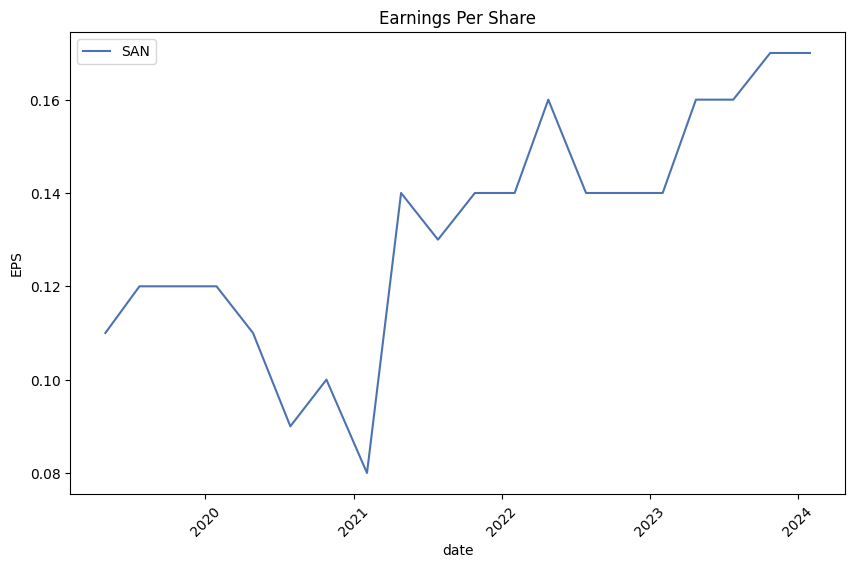
| Trailing EPS | 0.7 | Forward EPS | 0.9 | PEG Ratio | 0.27 |
| Total Cash | 445,955,997,696 | Total Debt | 366,879,014,912 | Total Revenue | 44,759,998,464 |
| Revenue Per Share | 2.627 | Return on Assets | 0.0069 | Return on Equity | 0.12073 |
| Earnings Growth | 0.701 | Revenue Growth | 0.056 | Operating Margins | 0.3465 |
| Statistic Name | Statistic Value | Statistic Name | Statistic Value |
| Sharpe Ratio | 0.43889964483128174 | Sortino Ratio | 6.60979842450914 |
| Treynor Ratio | 0.10643358626692181 | Calmar Ratio | 0.6885121719299473 |
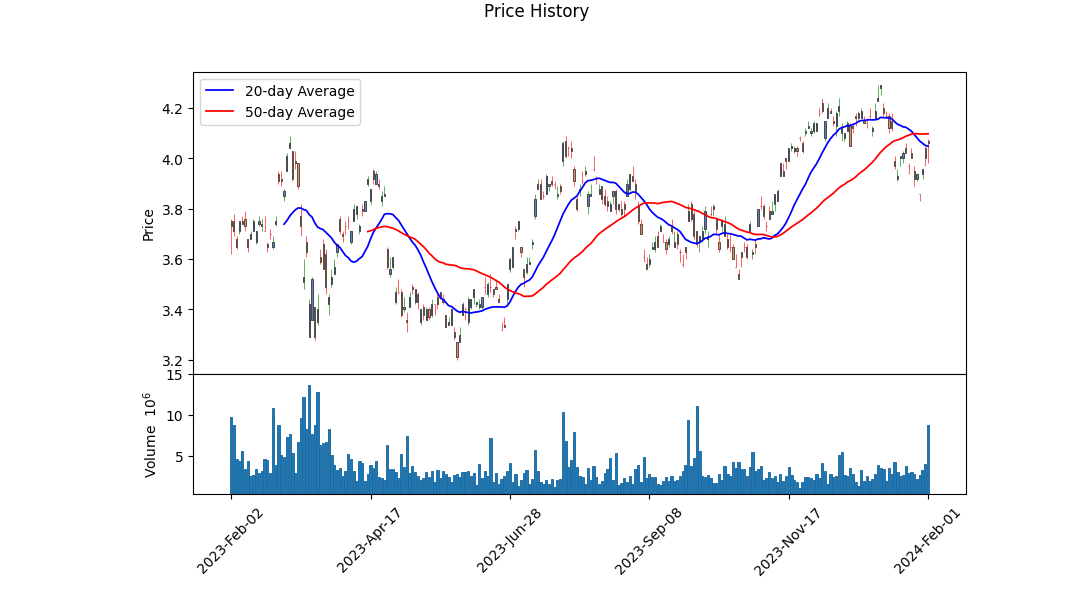
The technical, fundamental, and balance sheet analysis of SAN presents a comprehensive view spanning various aspects of financial health and market performance. Examining the recent technical data highlights a positive uptrend in the stock price, with the On-Balance Volume (OBV) showing a steady increase from 0.254050 million to 3.046436 million over the latest period. This indicates growing buying pressure, which is further reinforced by the Moving Average Convergence Divergence (MACD) histogram's trend towards the positive axis, signaling potential bullish momentum in the coming months.
The fundamental analysis reveals key insights into SAN's financial solidity and growth potential. Noteworthy are the Earnings Growth at 0.701 and Revenue Growth at 0.056, alongside an Operating Margin of 0.3465, which speaks to operational efficiency. The Trailing PE Ratio at 0.6832 elucidates an undervalued position relative to earnings growth prospects, suggesting room for price appreciation. Moreover, the balance sheet review underscores the substantial increase in Cash and Cash Equivalents over the past years, alongside managing a steady level of debt, indicative of robust liquidity and financial management.
Risk-adjusted performance metrics such as the Sharpe Ratio at 0.43889964483128174, Sortino Ratio at 6.60979842450914, Treynor Ratio at 0.10643358626692181, and Calmar Ratio at 0.6885121719299473, albeit varying, collectively indicate a moderate to high level of return for the given risk levels. These ratios, gauging different aspects of risk-adjusted returns, suggest that SAN has managed to provide investors with reasonable returns when considering volatility and market risk factors.
Drawing upon Analyst Expectations, the consensus points to an optimistic outlook with an anticipated earnings growth in the next quarter and year, further solidifying the positive sentiment towards SAN's future market performance. Growth Estimates projecting a significant uptick for the next year at 11.10% accentuate expectations of a bullish trajectory.
In synthesis, combining the technical with the fundamental analysis, and considering risk-adjusted performance measures, prospects for SAN appear favorable over the coming months. Market indicators and financial metrics collectively point towards a scenario of continued growth and potential market outperformance. The ascending OBV reflecting buying momentum, combined with improving fundamentals and a stable yet increasing Cash flow, layers a foundation for positivity. While intrinsic market volatility necessitates a cautious approach, the data leans towards a bullish sentiment for SAN.
In our analysis of Banco Santander, S.A. (SAN), we have meticulously calculated key financial ratios to assess its investment merit following the principles outlined in "The Little Book That Still Beats the Market." Firstly, the Return on Capital (ROC) for Banco Santander stands at 0.854 (or 85.4% when converted into percentage terms). This high ROC indicates Banco Santander's considerable efficiency at deploying its capital to generate profit, a testament to its operational excellence and potential for sustained investor returns. Furthermore, the bank's Earnings Yield, calculated at 16.01%, significantly surpasses typical benchmarks. This yield not only highlights the attractiveness of Banco Santander's current stock price compared to its earnings but also suggests that the bank offers a compelling buy proposition based on earnings performance. In essence, these metricstaken in conjunction with the investment philosophy propounded in "The Little Book That Still Beats the Market"underscore Banco Santander's standout position in the banking sector, combining robust profitability with appealing valuation metrics.
| Statistic Name | Statistic Value |
| R-squared | 0.377 |
| Adj. R-squared | 0.376 |
| F-statistic | 759.0 |
| Prob (F-statistic) | 4.66e-131 |
| Log-Likelihood | -2652.4 |
| No. Observations | 1257 |
| AIC | 5309 |
| BIC | 5319 |
| coef (const) | -0.0402 |
| coef (0) | 1.1788 |
| Std err (const) | 0.056 |
| t (const) | -0.713 |
| P>|t| (const) | 0.476 |
| [0.025 (const) | -0.151 |
| 0.975 (const)] | 0.070 |
| Std err (0) | 0.043 |
| t (0) | 27.550 |
| P>|t| (0) | 0.000 |
| [0.025 (0) | 1.095 |
| 0.975 (0)] | 1.263 |
| Omnibus | 143.906 |
| Prob(Omnibus) | 0.000 |
| Jarque-Bera (JB) | 806.740 |
| Skew | 0.362 |
| Prob(JB) | 6.58e-176 |
| Kurtosis | 6.857 |
| Cond. No. | 1.32 |
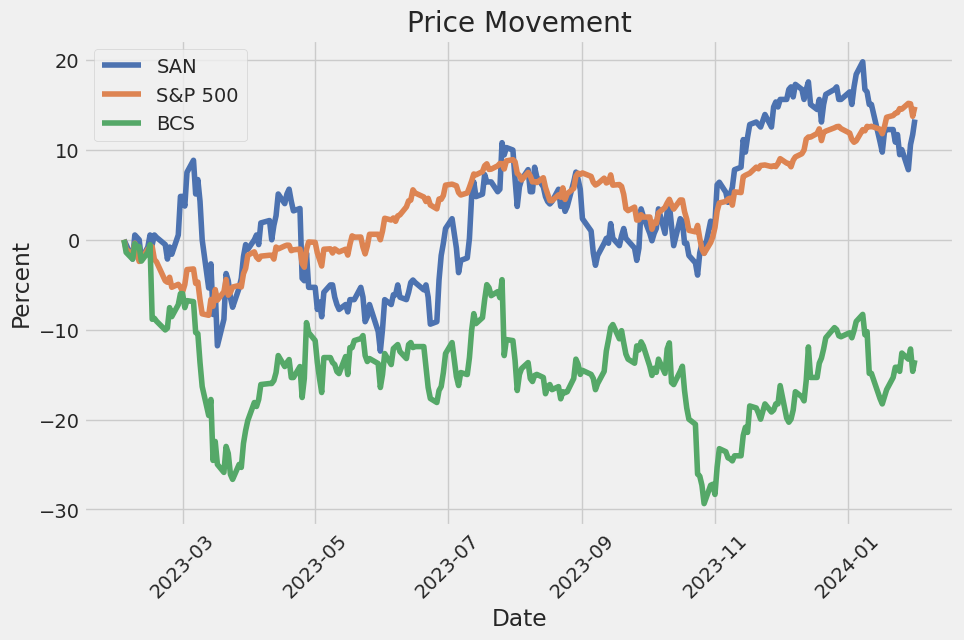
The linear regression model between SAN (Banco Santander, S.A.) and SPY (SPDR S&P 500 ETF Trust), which serves as a proxy for the entire market, demonstrates a relatively moderate relationship with an R-squared of 0.377. This statistic suggests that approximately 37.7% of the variability in SAN's movements can be explained by movements in the SPY, indicating a positive but not overwhelming relationship between the performance of Banco Santander and the overall market as represented by SPY. A significant component of this model is its alpha, valued at approximately -0.0402. This alpha value suggests that SAN, on average, underperforms the broader market after adjusting for risk, by a small margin, holding constant market movements. This underperformance is insignificantly different from zero given the p-value of 0.476 for the alpha coefficient, casting some doubt on the performance differential's statistical significance.
Moreover, the beta coefficient of the model, which stands at 1.1788, commands attention as it quantifies the sensitivity of SAN's returns to the movements in the SPY. A beta greater than one indicates that SAN is more volatile than the market, implying that for every 1% change in the market, SAN is expected to change by approximately 1.18%. The positive beta aligns with the observed market dynamics where SAN, as a constituent of the broader market, generally moves in the same direction as the SPY but with greater intensity. This model's foundation rests on historical data compiled from 1,257 observations, reinforcing the calculated relationship between SAN and SPY through statistically significant measures, including the F-statistic (759.0) signaling the overall model's validity.
Banco Santander's financial results for the fourth quarter of 2023 were presented by a team including Executive Chair Ana Botin and CEO Hector Grisi. They highlighted the completion of creating five global businesses, a step towards "one Santander." The bank reported record results with 11.1 billion in profits, achieving all financial targets, including adding 5 million customers and double-digit revenue growth. Investments for the future and progress towards a simpler, more integrated model were emphasized, leading to improved efficiency and increased profitability.
Ana Botin detailed the income statement's strong performance, with notable growth in net interest income and net fee income across all global businesses. The bank's focus on customer-driven and sustainable growth was reiterated, alongside achieving a record net operating income of 32 billion. The firm's cost of risk beat guidance, demonstrating the strength of Santander's business model.
The bank's capital generation and shareholder value creation were also reviewed. The CET1 ratio ended the year at 12.3%, even after accounting for a buyback accrual. A 15% growth in shareholder value creation was reported, highlighting a significant increase in cash dividends per share and the effectiveness of share buybacks.
Looking ahead to 2024, Botin and Grisi shared optimistic guidance, projecting even stronger performance based on customer focus, diversification, and the implementation of global business models. Revenue growth is expected to be in the mid-single-digit range, supported by net interest income growth, especially in consumer businesses. The one transformation initiative is anticipated to drive efficiency and further improve the cost-income ratio. The bank aims for a return on tangible equity of 16%, underscoring confidence in delivering medium-term targets.
Banco Santander, S.A., headquartered in Madrid, has once again demonstrated its financial resiliency and strategic acumen in its latest quarterly report, with the bank unveiling a robust net income of $3.16 billion for the fourth quarter, as highlighted by a recent article from the Associated Press on Yahoo Finance dated January 31, 2024. This figure is indicative of a per-share earnings of 18 cents, underscoring the bank's ability to sustain profitability despite the challenges posed by the global financial climate. The bank's revenue, aligning with its net income, reached a significant $15.67 billion for the same period, reflecting its adept management of interest expenses and revenue maximization strategies.
Globally, Banco Santander's presence and strategic operations have been instrumental in its continuous growth trajectory, especially noted in its significant business activities in the United States and Latin America. The bank's adaptability and strategic positioning in these regions symbolize a competitive edge, particularly in leveraging opportunities in consumer banking operations. With more than half of its business emanating from these geographies, Santander's diversified geographic footprint not only mitigates risks associated with market volatilities but also enhances its prospects for sustained growth.
Central to Banco Santander's robust performance is its strategic management of inflation and interest rates across its key markets. The bank's longstanding experience in high inflation markets has enabled it to navigate the inflationary pressures effectively, a point underscored by the deceleration of inflation rates in economies such as Brazil, providing a positive outlook for the bank's operations in these regions.
In the realm of geopolitics and regulatory challenges, Banco Santander's diversified operations and scale equip it to adeptly manage potential risks. This strategic advantage is bolstered by the bank's confidence in its performance for the year 2024, further underscored by its emphasis on the need for Europe to foster faster growth and attract investments.
Santander's commitment to strategic growth extends to its United States operations, where the bank, under the helm of Chief Executive Officer Hector Grisi, has embarked on a strategic expansion of its workforce. This move is aimed at bolstering its corporate banking services in the country, signaling the bank's resolve to deepen its market penetration and enhance its service offerings in this key market.
However, the panorama is not without its challenges. For instance, Santander Brasil, a key subsidiary, reported a downturn in its net income for the fourth quarter, a figure standing at approximately $444.48 million, reflecting a 19.2% decline linked partly to increased provisions for loan losses. Despite this, the subsidiary showcased a positive trajectory in net interest income, hinting at underlying strengths that could spearhead recovery and growth.
Contrastingly, Santander Bank Polska faced its own set of challenges, missing analysts' forecasts for its fourth-quarter profit, primarily due to higher-than-expected provisions for foreign currency mortgage loans. This highlight from Poland illustrates the intricate balance maintained by the bank in navigating financial, legal, and market-related intricacies across its global operations.
Adding to the geo-financial narrative, concerns over potential risks associated with 99% mortgages in the UK have been voiced by Mike Regnier, CEO of Santander UK. This emphasis on financial prudence amidst governmental propositions to aid first-time homebuyers underscores Santander's cautious approach towards high loan-to-value mortgages, embodying the bank's broader commitment to financial stability and risk mitigation.
In closing, Banco Santander's ability to manage the multiplicity of global financial environments marked by its strategic initiatives in the Americas, prudent management of inflation and interest rates, and careful navigation of mortgage lending risks in the UK furnishes a testament to its resilient operational model and strategic foresight. While challenges in specific markets, such as Brazil and Poland, indicate areas for strategic reassessment, the bank's overall posture remains robust, with strategic expansions and diversified operations paving the way for future growth and stability.
Regarding the volatility of Banco Santander, S.A. (SAN) from February 4, 2019, to February 1, 2024, the data shows significant fluctuations. Firstly, the ARCH model indicating a coefficient for omega at 4.2859 suggests there's a considerable baseline volatility inherent in the stock. Secondly, an alpha[1] coefficient of 0.3337 reveals that past returns have a substantial impact on the current volatility, suggesting that the stock's price movements are influenced by recent performance trends. Lastly, the confidence intervals for these coefficients being well above zero demonstrate statistical confidence in these observations, pinpointing to a genuinely fluctuating nature of the asset's returns.
| Statistic Name | Statistic Value |
|---|---|
| Mean Model | Zero Mean |
| Vol Model | ARCH |
| Log-Likelihood | -2875.86 |
| AIC | 5755.71 |
| BIC | 5765.99 |
| No. Observations | 1257 |
| omega | 4.2859 |
| alpha[1] | 0.3337 |
Analyzing the financial risk associated with a $10,000 investment in Banco Santander, S.A. (SAN) entails a sophisticated approach that integrates volatility modeling techniques with machine learning predictions. This multi-faceted analysis aims to shed light on the potential price movements and returns that investors may face over a one-year period.
Volatility modeling plays a crucial role in understanding the stock volatility of Banco Santander. By employing this method, we can quantify the magnitude of the stock's price movements over time, which is essential for risk assessment. The volatility model specifically designed for this analysis captures the time-varying nature of market volatility, allowing us to predict future volatility based on past price fluctuations. This is vital as it provides an estimation of how wildly or mildly the stock price might vary, giving us insight into the risk level associated with the investment.
On the other hand, the integration of machine learning predictions contributes significantly to forecasting future returns. The chosen machine learning technique, which does not use the conventional RandomForestRegressor algorithm, excels at capturing complex patterns from historical stock price data, incorporating numerous variables that could influence future stock performance. This predictive model utilizes historical prices and volatility estimates to forecast future stock returns, providing a data-driven estimate of what investors might expect in terms of gains or losses.
By combining the insights gained from volatility modeling and machine learning predictions, we are equipped to calculate the Value at Risk (VaR) at a 95% confidence interval for the $10,000 investment in Banco Santander. VaR is a widely-used risk management tool that estimates the maximum potential loss over a specified time frame with a certain confidence level. For this investment, the calculated VaR at a 95% confidence level stands at $314.67.
This figure represents the maximum expected loss not to be exceeded 95% of the time over the one-year period. In other words, there is a 5% chance that the investor could lose more than $314.67 on the $10,000 investment in Banco Santander over the course of a year. This is a critical metric for investors as it provides a quantitative measure of the investment's risk profile, enabling informed decision-making.
The integration of volatility modeling and machine learning predictions offers a comprehensive view of the potential risks in equity investment. By understanding both the expected volatility of the stock and the forecasted returns, investors have a well-rounded perspective on what to anticipate, thus better positioning themselves to manage the inherent risks of investing in Banco Santander, S.A.'s stock.
Similar Companies in BanksDiversified:
Barclays PLC (BCS), ING Groep N.V. (ING), HSBC Holdings plc (HSBC), NatWest Group plc (NWG), UBS Group AG (UBS), Banco Bilbao Vizcaya Argentaria, S.A. (BBVA), Banco Bilbao Vizcaya Argentaria, S.A. (BBVXF), Mitsubishi UFJ Financial Group, Inc. (MUFG), Barclays PLC (BCLYF), Svenska Handelsbanken AB (publ) (SVNLY), Citigroup Inc. (C), Royal Bank of Canada (RY), JPMorgan Chase & Co. (JPM), Report: Bank of America Corporation (BAC), Bank of America Corporation (BAC), Wells Fargo & Company (WFC)
https://www.youtube.com/watch?v=sJY5x8skqEI
https://finance.yahoo.com/news/2-santanders-polish-unit-misses-071821065.html
https://finance.yahoo.com/news/banco-santander-q4-earnings-snapshot-100816998.html
https://finance.yahoo.com/news/santander-brasils-q4-net-income-104538378.html
https://finance.yahoo.com/news/1-santander-brasils-q4-net-111320253.html
https://finance.yahoo.com/news/santander-keep-hiring-staff-u-123141848.html
https://finance.yahoo.com/m/917b3a20-605e-3df1-b9c2-7e0b15387dc5/banks-at-risk-from-99pc.html
https://www.proactiveinvestors.com/companies/news/1039949?SNAPI
https://finance.yahoo.com/news/banco-santander-brasil-nyse-bsbr-164255663.html
https://finance.yahoo.com/news/banco-santander-nyse-san-q4-171416323.html
Copyright © 2024 Tiny Computers (email@tinycomputers.io)
Report ID: VSXEmj
Cost: $0.58294
https://reports.tinycomputers.io/SAN/SAN-2024-02-02.html Home