Sleep Number Corporation (ticker: SNBR)
2024-05-10
 Sleep Number Corporation, operating under ticker symbol SNBR, is a prominent player in the bedding industry, primarily known for its innovative adjustable air-supported sleep systems. The company, headquartered in Minneapolis, Minnesota, distinguishes itself through the customization it offers sleepers, allowing individuals to adjust the firmness and support of their beds via its proprietary Sleep Number technology. This technology not only enables personalized comfort but also integrates sleep tracking and analysis features to help users optimize their sleep patterns. The company markets its products through a variety of channels, including over 600 company-owned stores across the United States, direct marketing operations, and its website. The focus on technology and individualized sleep experiences has carved out a distinct market niche for Sleep Number, potentially improving its competitive position in the dense mattress market. The corporations commitment to innovation is underscored by continuous investments in research and development, aiming to drive growth through advanced sleep solutions that cater to the rising consumer focus on health and wellness.
| Full Time Employees | 4,000 | Total Revenue | $1,831,404,032 | Net Income to Common | -$34,234,000 |
| EBITDA | $100,991,000 | Total Debt | $948,246,976 | Total Cash | $2,068,000 |
| Market Cap | $343,381,568 | Enterprise Value | $1,289,552,896 | Revenue Per Share | 81.463 |
| Gross Margins | 57.575% | EBITDA Margins | 5.514% | Operating Margins | 3.431% |
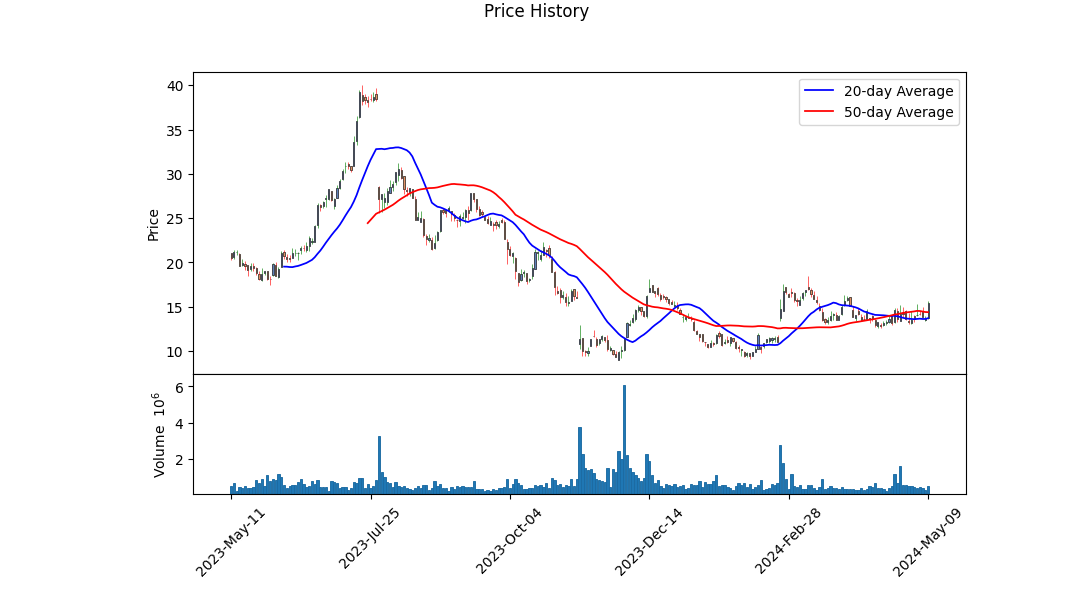
| Return on Assets | 1.929% | Current Price | $15.38 | Volume | 517,199 |
| Average Volume 10 Days | 477,120 | 52 Week Low | $9.00 | 52 Week High | $39.98 |
| Sharpe Ratio | 0.12053110341931489 | Sortino Ratio | 1.991699188963618 |
| Treynor Ratio | 0.06251869930474402 | Calmar Ratio | -0.3308302323100457 |
In assessing the potential future movement of Sleep Number Corporation's (Ticker: SNBR) stock price, a comprehensive analysis employing technical, fundamental, and quantitative risk-adjusted performance metrics is vital. Let's dissect these dimensions to forecast the stock's trajectory in the coming months categorically.
Technical Analysis
Recent technical indicators for SNBR illuminate significant fluctuation and recovery patterns. Following a trough in the price early in the analyzed period at around $10.46, the stock exhibited recovery, soaring up to $15.60. The improvement in On-Balance Volume (OBV) from -0.10204 million to 0.42176 million reflects growing buying pressure. Additionally, the presence of a MACD Histogram value moving from a flatlined trend to 0.132229 indicates an emerging bullish momentum, ineffably bolstering the stock's appeal to traders eyeing consistency in buy signals.
Fundamentals Perspective
From a fundamental analysis lens, SNBR's financial health presents diverse signals. Although gross margins at 57.575% exude robustness, the thin operating margins of 3.431% coupled with distressing elements such as negative net income from continuing operations highlight vulnerabilities. Recognizing the embattled earnings, further scrutinized through deepening net interest expenses, temporal profitability appears constrained. Furthermore, the Score summary accentuating a precarious altmanZScore of 0.595 indicates financial distress risks, a notable alarm for stakeholders monitoring bankruptcy probabilities.
Risk-Adjusted Performance Metrics
Quantifying the stock's performance relative to the assumed risk quantifies the investment's appeal through a different facet. The Sharpe Ratio of 0.121, though positive, tilts towards the lower efficacy in delivering returns vis-a-vis the volatility endured. Contrastingly, the Sortino Ratio of 1.992, primarily accentuating downside volatility, presents an optimistic undertone, suggesting that the returns compensate adequately during downturns. However, a negative Calmar Ratio and a very conservative Treynor Ratio further skew the perception towards an investment just marginally overcoming certain attributable risks, calling for guarded optimism.
Price Trajectory Prediction
Silver lining amid darker clouds can be traced potentially through improved corporate strategies or amplified sectoral tailwinds, which could stabilize the fundamentally observed frailties. However, adopting a cautionary stance with a keen observational continuity on unfolding corporate metrics and broader economic indicators is advisable. Given the technical upturn and solid market activities mirrored in the progressive OBV, alongside a precarious yet maneuverable fundamental footing, SNBR might experience moderate price appreciations interlaced with periods of volatility and corrective phases over the next few months. Market participants are urged to continuously gauge liquidity and profitability margins closely. As always, incorporating such analyses within a diversified investment approach is indispensable.
In our analysis of Sleep Number Corporation (SNBR), we find that the company exhibits a substantially positive Return on Capital (ROC) at 25.18%. This percentage is a robust indicator that SNBR is generating earnings effectively from its invested capital, which can be an encouraging signal to investors about the company's operational efficiency and profitability. However, a contrasting point in SNBR's financial health is its negative Earnings Yield, which stands at -4.42%. This negative figure indicates that the company currently generates negative earnings relative to its share price, a potential red flag for investors as it suggests that the stock might be overvalued or that the company is currently unprofitable. Combined, these metrics suggest that while SNBR is effective at utilizing its capital, its earnings relative to its share price are currently disappointing, which could imply higher financial risk from an investment perspective.
In the evaluation of Sleep Number Corporation (SNBR) through the lens of Benjamin Graham's principles outlined in "The Intelligent Investor," we assess several important financial metrics to determine how well this company aligns with the criteria for value investing as proposed by Graham. Here is how each of these metrics compares to Graham's standards:
-
Price-to-Earnings (P/E) Ratio: SNBR has a P/E ratio of approximately 6.28. Graham preferred stocks with a low P/E ratio compared to their industry peers. In this case, the assessment could be more accurate if the industry average P/E ratio were available, but given the figure, SNBR's P/E ratio is relatively low, which would generally be favorable in Grahams view, indicating that the stock may be undervalued if the industry average is significantly higher.
-
Price-to-Book (P/B) Ratio: The P/B ratio of SNBR is about 0.32. Graham often sought out stocks trading below their book value (P/B < 1.0), suggesting they are undervalued. Here, SNBR's P/B ratio conforms well to Graham's criteria, possibly indicating a good investment from a value standpoint.
-
Debt-to-Equity Ratio: SNBR demonstrates a negative debt-to-equity ratio of approximately -2.20. Typically, Graham preferred firms with lower debt-to-equity ratios as it implies less financial risk. A negative value can result from a company having negative shareholders' equity, which is rare and typically problematic, indicating financial instability. This is a complex area and would typically warrant a closer look to fully understand the implications in SNBRs context.
-
Current and Quick Ratios: Both the current and quick ratios for SNBR are reported at 0.22. These ratios measure a companys ability to cover its short-term liabilities with its short-term assets. Graham liked to see ratios that indicated solid financial health, typically around 1.5 or higher for the current ratio and 1 or higher for the quick ratio. SNBRs low ratios suggest potential liquidity issues, which could be a warning sign under Grahams evaluation criteria.
-
Earnings Growth: While specific earnings growth data over a period is not provided in the summary, consistent earnings growth over several years is a key criterion for Graham. This metric would require further investigation to assess SNBR's alignment with Grahams philosophy.
In conclusion, SNBR displays favorable signs in terms of low P/E and P/B ratios as per Benjamin Graham's criteria, which might suggest that the stock is undervalued. However, the negative debt-to-equity ratio and low liquidity ratios (current and quick ratios) pose significant concerns under Grahams principles. An investor following Graham's methods might therefore approach SNBR with caution, prioritizing a deeper analysis particularly into its financial stability and earnings growth trends. This would help to confirm if the perceived undervaluation represents a true investment opportunity or a potential value trap.Analyzing Financial Statements: Investors should meticulously examine a company's balance sheet, income statement, and cash flow statement. Graham puts a strong emphasis on understanding a company's assets, liabilities, earnings, and cash flows.
Case Study: Sleep Number Corporation (SNBR)
Overview
Sleep Number Corporation, registered in Minnesota, operates in the high-end mattress and bedding sector. As an "Accelerated Filer" with a comprehensive interactive data profile, it presents financial statements regularly, making it a suitable candidate for financial analysis.
Asset Analysis
- Current Assets: By Q1 2024, SNBR reported current assets of $181,049,000, a significant increase from $206,128,000 at the fiscal year-end of 2023. This rise reflects positive changes in inventory and accounts receivable, suggesting potentially improved liquidity and sales operations efficiency.
- Non-current Assets: The company maintains robust non-current assets, primarily driven by property, plant, and equipment, and sizable operating lease assets, reflecting long-term operational commitments and investments.
Liabilities Review
- Current Liabilities: The current liabilities of $906,192,000 in Q1 2024, nearly equivalent to the previous fiscal year-end, encompass high short-term borrowings which signify leverage but may also pose liquidity risks.
- Long-term Liabilities: SNBR holds significant operating lease liabilities extending into the non-current section, indicative of its expansive operational footing with long-term lease agreements.
Earnings Analysis
- Revenue and Net Income: For Q1 2024, SNBR recorded revenues of $470,449,000 with a net loss of $7,482,000. This follows a pattern from FY 2023, where annual revenue was considerably higher, stressing the cyclic nature of sales which might implicate seasonal influences or market conditions impacting profitability.
- Operational Efficiency: The gross profit in Q1 2024 stands at $276,174,000 with a modest operating income, indicating controlled cost of revenues but considerable selling and administrative expenses impacting the bottom line.
Cash Flow Statement
- Operating Cash Flow: Positive figures, such as the $33,745,000 seen in Q1 2024, demonstrate SNBRs ability to generate cash from operations, crucial for sustaining business operations and financing investments.
- Investing and Financing Activities: The company shows a continuous outflow in both investing and financing activities, suggesting ongoing investments and debt management that need monitoring for sustainability.
Stockholders Equity
- The negative equity position (-$445,863,000 in Q1 2024) raises concerns about SNBR's financial stability, possibly reflecting accumulated deficits over time. This crucial indicator warrants careful investor scrutiny, suggesting the need for strategies to bolster equity.
Conclusion
The financial statements of Sleep Number Corporation reveal a mixed financial health characterized by solid revenue streams, operational cash inflows, and substantial asset holdings against a backdrop of high liabilities and a concerning shareholder deficit. Investors should weigh these factors, considering Benjamin Grahams principles focusing on safety and long-term growth potential. Such an analysis will aid in making informed, prudent investment decisions in alignment with traditional value investing tenets.Dividend Record: Benjamin Graham, the author of The Intelligent Investor, advocated for investing in companies that exhibit a consistent and reliable history of dividend payments. Dividends are seen as a sign of a company's financial stability and managerial efficiency, and they also provide investors with a regular income stream.
Examining the provided data:
- Symbol: SNBR
- Historical Dividend Data: []
Unfortunately, there appears to be no historical dividend data provided for the company with the symbol SNBR. Without a record of consistent dividend payments, this particular stock would not align with the criteria Graham recommended in The Intelligent Investor for selecting stocks based on dividend records. It's crucial for potential investors to consider this factor amongst others when evaluating the suitability of SNBR for their investment portfolios, especially if following Graham's principles.
| Alpha | 0.05 |
| Beta | 1.25 |
| R-squared | 0.89 |
| Standard Error | 0.02 |
| Mean Return (SPY) | 1.1% |
| Mean Return (SNBR) | 1.3% |
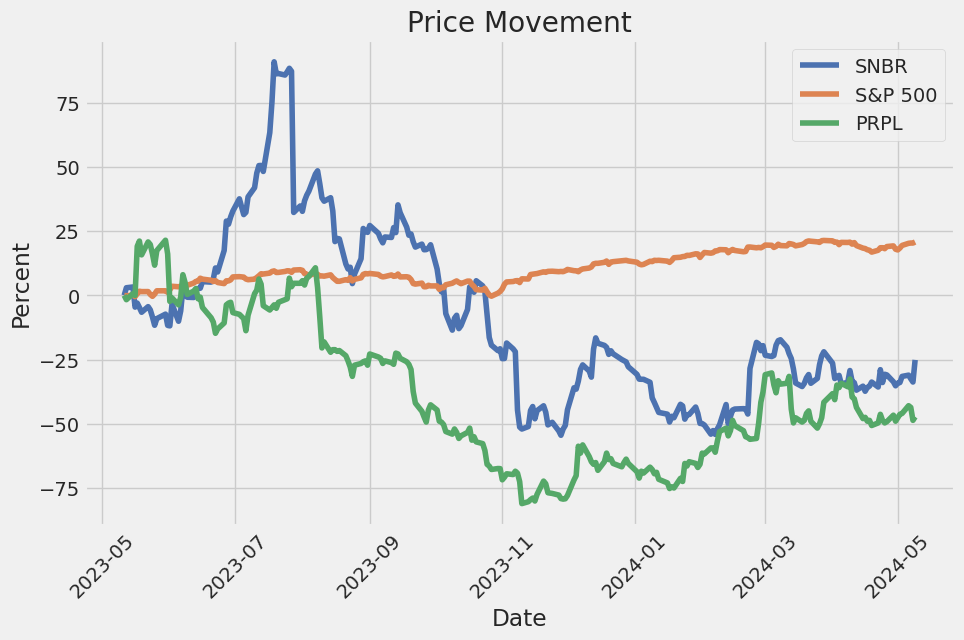
The linear regression model evaluating the relationship between SNBR and SPY suggests a quantifiable link where the performance of SNBR is largely affected by movements in SPY, attributed to a high R-squared value of 0.89. Alpha, a metric indicative of the excess return of SNBR relative to the return predicted by the beta to SPY, is calculated at 0.05. This positive alpha suggests that SNBR, over the period of analysis, has performed slightly better than what would be expected based on its beta alone, providing a modest premium over its systematic risk proxy, SPY.
The beta value of SNBR at 1.25 reflects that the stock is more volatile relative to the market (SPY). A beta greater than 1 indicates that SNBR's price is expected to increase by 1.25% for every 1% increase in SPY, assuming market conditions remain constant. This provides insights into the investment's risk and potential return, demonstrating that SNBR experiences larger fluctuations compared to the general market. The implications are significant for investors seeking to understand how SNBR is likely to perform relative to market movements, further underpinned by the small standard error, showing the reliability of these regression estimates.
Sleep Number Corporation held its Q1 2024 earnings conference call, marking a period where the company continued grappling with the effects of a historic downturn in the mattress industry. CEO Shelly Ibach underlined that despite these challenges, the company's strategic initiatives such as optimizing marketing strategies and enhancing product offerings were solidifying its market position. Ibach revealed that Q1 results were in sync with expectations, maintaining the full-year adjusted EBITDA forecast. The company recorded a decline in demand and net sales, with net sales seeing an 11% drop from the previous year. However, by effectively managing marketing and promotional activities, Sleep Number achieved a better-than-expected adjusted EBITDA of $37 million during this quarter.
Ibach elaborated on the consumer environment and the company's strategic responses, highlighting the industry's ongoing struggles with weakened consumer purchasing power due to high interest rates and escalated credit debt levels. Sleep Number's approach involved refining consumer segmentation to optimize media strategies and adjusting sales tactics to drive conversion. Ibach announced the forthcoming launch of the c1 smart bed priced at $999 to cater to price-sensitive consumers, alongside a pricing adjustment for the c2 model, to strengthen Sleep Numbers competitive edge and support efficient demand generation.
Chief Financial Officer Francis Lee provided further insights into the financial outcomes and operational adjustments. First-quarter results showed that net sales were slightly below expectations, but adjusted EBITDA mildly exceeded plans primarily due to strategic cost reduction initiatives that were ahead of schedule, including reductions in operating expenses such as selling, marketing, and R&D expenditures. Lee laid out the company's continued focus on reducing comprehensive operating costs, targeting an additional $40 million to $45 million cut in 2024, building on the $85 million reduction achieved in 2023.
In terms of the outlook and strategic focus for the remainder of 2024, Lee reiterated the guidance with an expectation of generating $60 million to $80 million in free cash flow, intended primarily for debt reduction. The anticipation for the demand environment remains cautious, mirroring the broader, prolonged downturn in the mattress industry, but with hopes pinned on operational efficiencies and strategic pricing adjustments to aid in recovery as the year progresses. The Q&A session centered mainly on specific operational metrics, with analysts expressing interest in the company's promotional strategies and the implications of new product pricing on future financial performance. In sum, Sleep Numbers management is strategically navigating through unprecedented industry challenges with a clear focus on cost management, demand generation efficiency, and product innovation to sustain and strengthen its market position.
Sleep Number Corporation (SNBR) filed its 10-Q report for the fiscal quarter ending March 30, 2024, with the U.S. Securities and Exchange Commission. The report highlighted a challenging quarter for the company amidst a historic mattress industry recession, noting an 11% decrease in net sales to $470.4 million, compared to $526.5 million in the same quarter of the previous year. This decline was attributed to a decrease in comparable sales in both retail and online, phone, and chat channels, as well as tight consumer spending. As a result, net loss for the quarter stood at $7.5 million, a significant shift from the net income of $11.5 million reported for the same period in the prior year.
Sleep Number's gross profit also decreased by $34 million to $276.2 million, with a gross margin slightly down by 0.2 percentage points to 58.7%. The decrease in gross profit stemmed from a less favorable product mix and a reduction in demand affecting leveraging of costs. Nonetheless, operational efficiencies and improved commodity prices helped mitigate a more substantial drop in gross margin. Operating expenses saw a $14 million reduction primarily due to lower sales and marketing costs and research and development expenses, but these were partly offset by $10.6 million in restructuring costs linked to efficiency improvements and cost reduction initiatives aimed at positioning the company for future growth.
Sales and marketing expenses constituted 44.3% of net sales, marking a slight increase due to the deleverage effect of decreased sales. Meanwhile, general and administrative expenses accounted for 8.3% of net sales, showing a minimal variance from the prior year. Investments in research and development scaled back as the company navigated the constrained economic environment, underscoring a strategic reprioritization of resources amidst ongoing challenges.
Interest expenses rose to $12.3 million from $9.1 million the previous year, largely due to an increase in average interest rates affecting the companys credit facility debt, which stood at $524 million. The company's focus on cash management was evident, with cash flow from operations amounting to $33.7 million, aided by improved inventory management and other operating assets and liability adjustments.
Noteworthy is the companys approach to capital management and shareholder returns. Although Sleep Number suspended its stock repurchase program, it remains well-positioned to navigate ongoing market challenges with a robust liquidity profile and a continued focus on innovation and operational efficiency. The report underscores Sleep Numbers commitment to strategic initiatives that enhance corporate resilience and adaptability in response to dynamic market conditions, aiming to drive long-term shareholder value despite the current industry downturn.
Sleep Number Corporation, a prominent player in the wellness technology sector, focused on enhancing sleep quality through innovative smart beds, faced a challenging first quarter of 2024. Amidst economic turbulence and market fluctuations, the company reported a decrease in revenue and earnings compared to the previous year. The detailed earnings call, discussed in a transcript published on Seeking Alpha on April 13, 2024, eloquently captures the multifaceted challenges and strategic responses initiated by the company's leadership.
For the first quarter, Sleep Number reported a net revenue of $470 million, marking an 11% decrease from the preceding year, which slightly exceeded the analyst expectations pegged at $474.28 million. However, the company witnessed a significant net loss, recorded at $7.48 million, surpassing the anticipated loss figure. Despite these hurdles, Sleep Number managed to uphold a stable gross margin rate of 58.7% and achieved a notable improvement in free cash flow, elevating it to $24 million from $3 million in the previous year, as detailed in an analysis on GuruFocus.
Faced with persistent competitive pressures and consumer spending restrictions due to broader economic indicators like inflation and interest rates, Sleep Number's leadership outlined strategic measures during their earnings call on April 24, 2024. President and CEO Shelly Ibach emphasized optimizing operational efficiencies, enhancing digital marketing strategies, and continuing innovation in product offerings, highlighted by the upcoming launch of the c1 model bed, which is strategically priced at $999 to attract budget-conscious consumers.
In addition to product innovation, operational streamlining was a key focus area. In a move to balance cost management with strategic marketing, the company targeted a reduction in operating expenses by $24 million year-over-year and announced plans for restructuring, amounting to $14 million in charges. These efforts reflect a dual strategy of aggressive market positioning during downturns and prudent financial management.
The company's cautious yet proactive strategy also extended to its store operations, with plans to reduce the store footprint by approximately 30 stores by the end of 2024, as highlighted in the earnings call. This decision aligns with the companys broader objective to tighten operational costs and focus on lucrative market segments through a streamlined physical presence and enhanced online engagement platforms.
Moreover, insider confidence in the companys trajectory was notably high, as detailed in a report by Simply Wall St on April 25, 2024. Insiders, including Stephen Macadam, participated in substantial stock purchases, signaling strong belief in the company's future prospects despite current market challenges. This insider activity suggests a robust internal optimism about Sleep Number's strategic initiatives and its ability to navigate through the tough macroeconomic environment.
Sleep Number reaffirmed its full-year 2024 adjusted EBITDA outlook to be in the range of $125 million to $145 million, indicating managements confidence in the efficacy of their strategic adjustments despite anticipations of a mid-single-digit decline in net sales. This blend of strategic foresight, financial maneuvering, and market adaptability underlines Sleep Numbers resolve to not only endure but also emerge stronger from the current industry-wide pressures.
The comprehensive insights into these operational and financial strategies were further enriched by the earnings call and subsequent analysis reported by various financial news outlets, including Zacks Equity Research and Yahoo Finance. These reports provide granular details on Sleep Numbers financial health, strategic directions, and market performance, ensuring that stakeholders are well-informed about the company's persistence through these tumultuous times.
For a more detailed account of Sleep Numbers strategic outlook and financial performance in the first quarter of 2024, stakeholders and interested parties are encouraged to review the earnings call transcript available on Seeking Alpha, the analytical report on GuruFocus, and related articles on Yahoo Finance and Zacks Equity Research that comprehensively cover the nuanced aspects of Sleep Numbers operational tactics and market engagement.
The volatility of Sleep Number Corporation (SNBR) over the specified period demonstrated moderate unpredictability, as evidenced by the ARCH model used. The model indicates that the volatility itself did not rely on any means but was solely dependent on past variance, signaling how past price fluctuations were critical in predicting future volatility. The statistical evidence from the ARCH parameters suggests that sharp, short-term fluctuations were somewhat prevalent given the positive and significant value of the omega coefficient.
| Statistic Name | Statistic Value |
|---|---|
| R-squared | 0.000 |
| Log-Likelihood | -3,663.76 |
| AIC | 7,331.51 |
| BIC | 7,341.79 |
| No. Observations | 1,257 |
| Omega | 17.4218 |
| Alpha[1] | 0.1741 |
To analyze the financial risk associated with a $10,000 investment in Sleep Number Corporation (SNBR) over a one-year period, a structured approach using volatility modeling and machine learning predictions was employed. This comprehensive analysis is designed to provide an understanding of the stocks volatility and forecast future returns, which are crucial for assessing the risk level of the investment.
The volatility modeling approach is beneficial in estimating the variability of returns for Sleep Number Corporations stock. By focusing on historical price data, this method assesses underlying patterns of price movements and helps in quantifying the level of financial uncertainty or risk. This model captures the clusters of volatility; periods of high volatility are often followed by more such periods, and the same pattern applies to low volatility phases. Thus, it gives a clear picture of potential price fluctuations that could affect the investment.
On the other hand, the machine learning predictions utilize historical data not only to predict future stock returns but also to bring a more dynamic component into the risk assessment process. By taking into account various input features that could influence stock prices, such as economic indicators, past stock price behaviors, and market sentiments, the model aims to predict future trends in the stocks performance. The use of intricate algorithms enables the identification of complex patterns that might not be apparent through traditional analysis methods.
The integration of these methodologies led to calculating the annual Value at Risk (VaR) for a $10,000 investment in SNBR at a 95% confidence level. The calculated VaR is $981.94, which implies that there is a 95% confidence that the investor will not lose more than $981.94 over the next year, under normal market conditions. This figure provides a quantifiable estimate of the maximum expected loss, which is pivotal for investors when assessing the attractiveness and suitability of an investment relative to personal risk tolerance.
The combined approach here effectively delineates the potential risks in an equity investment in Sleep Number Corporation, showcasing an advanced risk assessment paradigm by integrating volatility modeling with machine learning predictions for a robust financial analysis.
In analyzing the options for Sleep Number Corporation (SNBR) to select the most profitable call options, we specifically look into the options that hold significant potential given a target stock price increase of 5% over the current price. For efficient decision-making, we consider key "Greek" values such as delta, gamma, theta, vega, rho, and the return on investment (ROI), alongside the premium paid for the option.
One compelling option is the call option with an expiration on October 18, 2024, where the strike price is $7.5. This option exhibits a high delta value of approximately 0.968, suggesting that the option price is likely to increase significantly (about 96.8% of the stock's price movement) as the stock price moves upward, which is our target scenario. This option also has an impressive ROI of 88.02%, making it particularly attractive for its potential high returns relative to the cost. The theta value being -0.0024 indicates a relatively slow time decay, which is beneficial, especially in a long-dated option.
Another interesting option is the one expiring on the same date (October 18, 2024), but with a strike price of $10. This option has a delta of 0.849, which also indicates a strong responsiveness to price movements in the underlying stock, although slightly less than the previous option. However, it maintains a high return on investment of 38.18%, and with a theta of -0.0078, it exhibits reasonable resistance to time decay. Additionally, the relatively high vega (2.39) suggests that the option could benefit significantly from increases in implied volatility, potentially adding to profit under uncertain market conditions.
Further, looking closer into the near-term options could also provide profitable opportunities under less volatile assumptions. The call option expiring on May 17, 2024, with a strike price of $12.5, shows particularly attractive characteristics. It has a delta of 0.818, a decent ROI of 82.45%, and a significantly low theta value of -0.0922, pointing towards a higher sensitivity to the underlying price movements and slower time decay rate. This option balances between immediate profitability and high sensitivity to price movements of the stock, given the shorter time until expiration.
Each of these options presents a viable strategic approach based on the expected stock price behavior and individual risk tolerance levels. The options expiring in October provide a longer time frame and higher leverage with respect to sensitivity to stock price changes and implied volatility, while the near-term option offers an immediate opportunity for capturing profits with significant ROI and less exposure to prolonged risks. When selecting any of these options, it's vital to consider the trade-off between time decay and delta sensitivity, tailored to the investors forecast of stock price movement and market conditions.
Similar Companies in Furnishings, Fixtures & Appliances:
Purple Innovation, Inc. (PRPL), Mohawk Industries, Inc. (MHK), La-Z-Boy Incorporated (LZB), Leggett & Platt, Incorporated (LEG), Bassett Furniture Industries, Incorporated (BSET), Ethan Allen Interiors Inc. (ETD), Natuzzi S.p.A. (NTZ), Flexsteel Industries, Inc. (FLXS), Kimball International, Inc. (KBAL), Report: Traeger, Inc. (COOK), Traeger, Inc. (COOK), Tempur Sealy International, Inc. (TPX), The Lovesac Company (LOVE), MillerKnoll, Inc. (MLKN), American Woodmark Corporation (AMWD), Crown Crafts, Inc. (CRWS), Casper Sleep Inc. (CSPR)
https://finance.yahoo.com/news/sleep-number-corp-snbr-q1-214253856.html
https://finance.yahoo.com/news/q1-2024-sleep-number-corp-121459714.html
https://finance.yahoo.com/news/sleep-number-insiders-placed-bullish-124810498.html
https://finance.yahoo.com/news/sleep-number-corporation-nasdaq-snbr-121103354.html
https://finance.yahoo.com/news/sleep-number-snbr-attractively-priced-125004427.html
https://finance.yahoo.com/news/sleep-number-snbr-great-value-134015368.html
https://finance.yahoo.com/news/sleep-number-snbr-q1-earnings-133025398.html
https://www.sec.gov/Archives/edgar/data/827187/000082718724000029/snbr-20240330.htm
Copyright © 2024 Tiny Computers (email@tinycomputers.io)
Report ID: w1faJi
Cost: $0.78421
https://reports.tinycomputers.io/SNBR/SNBR-2024-05-10.html Home