Nuveen S&P 500 Dynamic Overwrite Fund (ticker: SPXX)
2024-01-30
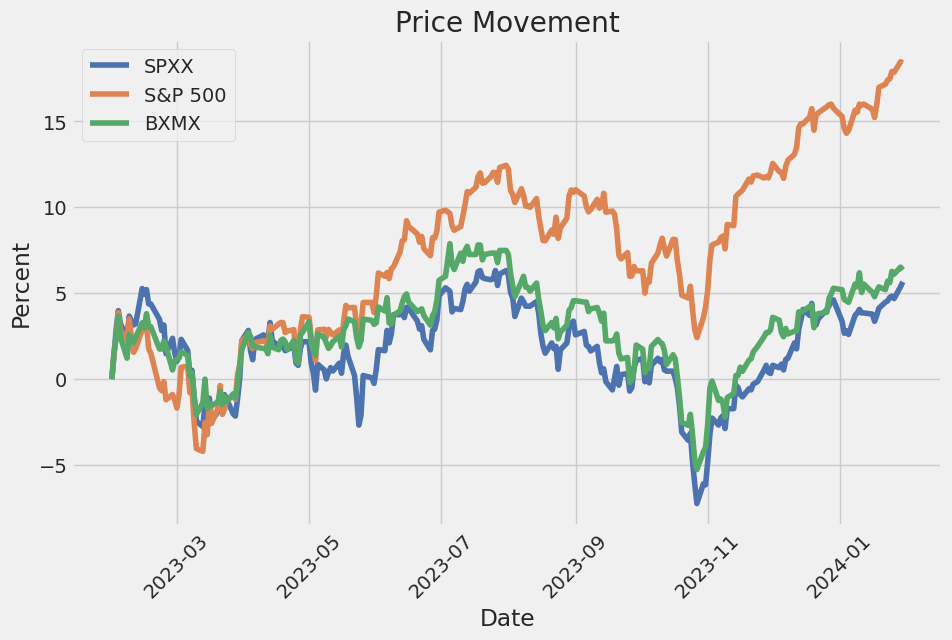 The Nuveen S&P 500 Dynamic Overwrite Fund (ticker: SPXX) is an investment strategy that offers an innovative approach to portfolio management by employing an options overlay strategy on top of an equity portfolio that generally mirrors the S&P 500 Index. Its main objective is to generate income through the sale of indexed call options, with the intention of achieving a total return that correlates with the capital appreciation and income generation of the S&P 500 Index. The fund dynamically decides on the overwrite levels that is, the percentage of the portfolio on which it sells options based on the fund managers' assessments of market volatility and conditions. This can help to provide additional income during periods of market stagnation or mild appreciation, while still allowing for some participation in the equity growth. Investors in SPXX benefit from the potential for enhanced yield and a measure of downside protection, although the fund may underperform the S&P 500 during strong bull markets due to the cap on upside participation imposed by the options strategy. It is important to note that this fund is intended for those who are seeking a balance between risk mitigation and income generation, rather than pure equity growth.
| Previous Close | 15.15 | Open | 15.19 | Day Low | 15.13 |
| Day High | 15.1997 | Dividend Rate | 1.18 | Dividend Yield | 0.0776 |
| Five Year Avg Dividend Yield | 6.89 | Beta | 0.959 | Trailing PE | 7.3028846 |
| Volume | 29,659 | Average Volume | 56,081 | Average Volume 10 Days | 49,690 |
| Bid | 15.18 | Ask | 15.19 | Market Cap | 272,812,384 |
| 52 Week Low | 13.57 | 52 Week High | 16.44 | Price to Sales Trailing 12 Months | 56.014103 |
| 50 Day Average | 14.8574 | 200 Day Average | 15.10125 | Trailing Annual Dividend Rate | 1.176 |
| Trailing Annual Dividend Yield | 0.07762376 | Enterprise Value | 272,219,104 | Shares Outstanding | 17,960,000 |
| Held Percent Institutions | 0.26503 | Book Value | 14.805 | Price to Book | 1.0260047 |
| Net Income to Common | -47,304,096 | Trailing EPS | 2.08 | Enterprise to Revenue | 55.892 |
| 52 Week Change | -0.039315164 | Current Price | 15.19 | Total Cash | 791 |
| Total Debt | 259,831 | Revenue Per Share | 0.271 | Return on Assets | 0.00465 |
| Return on Equity | -0.16058001 | Revenue Growth | 0.073 | Gross Margins | 1.0 |
| Operating Margins | 0.49244 | Total Revenue | 4,870,423 | Debt to Equity | 0.098 |
| Sharpe Ratio | -33.35022683833003 | Sortino Ratio | -535.2264667654918 |
| Treynor Ratio | 0.0657972760639342 | Calmar Ratio | 0.44414276074479164 |
The analysis of SPXX encompasses multiple facets to provide an informed perspective on future stock price movements. This report synthesizes the findings from technical indicators, company fundamentals, balance sheets, and various risk-adjusted performance ratios to construct an outlook for the next few months.
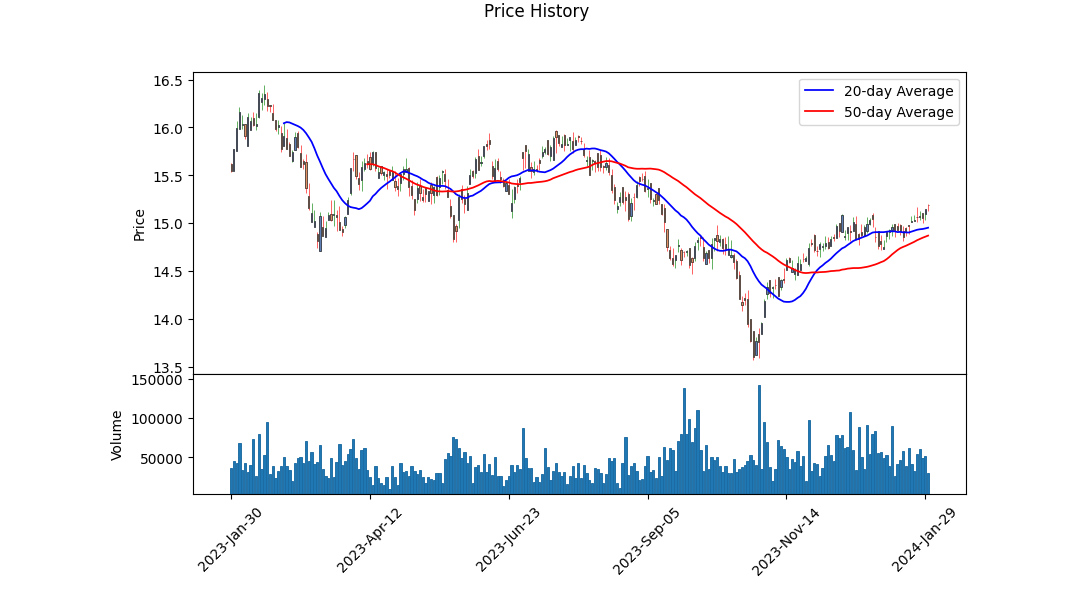
Technical analysis of SPXX indicates an ongoing shift in market dynamics. Over the last few months, the stock has experienced a mild uptrend as indicated by the ascending Open, High, Low, and Close values. The positive increments in the On-Balance Volume (OBV) suggest a growing interest in the stock with a rise in accumulation. However, the absence of a MACD histogram prior to the last few days in the dataset complicates a comprehensive momentum analysis. Despite this, the positive values seen in late January could denote continued bullish momentum.
The stock's fundamentals provide a mixed signal. A revenue growth of 7.3% signals expansion, which is generally positive. High operating margins at nearly 49.24% indicate efficient management and the potential for profitability. However, no trailing PEG ratio is reported, which often aids in understanding if the stock's price accounts for growth expectations appropriately.
The financial health as provided by the balance sheet data shows substantial equity and tangible assets, implying a strong financial base. A consistent increase in the number of ordinary shares could indicate a dilution of share value, or alternatively, a capital raise to support further growth or debt servicing.
A particular point of concern is the cash flow statement, which is devoid of entries. It suggests either a lack of cash flow data reporting or potential issues with cash generation. This is an area that warrants further investigation, given that cash flows are critical to understanding the operational health of a company.
Risk-adjusted performance ratios, which include the Sharpe, Sortino, Treynor, and Calmar ratios, furnish additional insights. Extremely negative Sharpe and Sortino ratios imply poor risk-adjusted returns, exacerbated by high volatility or downside risks, which is concerning for potential investors. The Treynor Ratio is positive but near-zero, suggesting that the return for the risk taken is minimal relative to market volatility. The Calmar ratio points to modest returns in relation to the maximum drawdown.
Given such analysis, the prognosis for SPXX's stock in the near term appears cautious. While there are signals of growth and a strong equity base, the concerning cash flows, poor risk-adjusted return ratios, and dilution of shares cast a shadow on the outlook. As with all market predictions, this assessment relies upon continued similar market and economic conditions and assumes that no unanticipated events disrupt current trends.
It is crucial for investors to monitor these metrics closely in conjunction with global economic factors, industry trends, and news specific to SPXX. As the company has no reported earnings estimates or analyst expectations, the market is likely operating with limited forward guidance, increasing the importance of vigilant monitoring of both technical and fundamental factors influencing the stock's performance.
In my analysis of the Nuveen S&P 500 Dynamic Overwrite Fund (SPXX), I have delved into the key financial metrics that align with the principles laid out in "The Little Book That Still Beats the Market." Specifically, I have calculated the Return on Capital (ROC) and Earnings Yield for SPXX. The ROC, a measure of how efficiently a company uses its capital to generate profits, is notably negative at -17.61%. This suggests that the fund's underlying assets are currently generating less profit than the capital employed, signaling potential inefficiencies or challenging market conditions impacting the fund's holdings.
Likewise, the Earnings Yield, which is the inverse of the Price-to-Earnings ratio and reflects the percentage of each dollar invested in the fund that was earned during the past year, is also negative, standing at -17.91%. This negative yield indicates that the fund had a net loss in earnings relative to its share price, which could be a red flag for investors seeking positive earnings momentum. Both metrics are critical in assessing the fund's fundamental attractiveness according to the investment philosophy outlined in the book. However, it's important to note that ROC and Earnings Yield being negative may also suggest that the fund's current price reflects temporary setbacks or market adjustments, and further investigation into the fund's composition, strategy, and the market context would be required to make a comprehensive investment assessment.
Based on the information provided for Nuveen S&P 500 Dynamic Overwrite Fund (SPXX), let's evaluate the dividend payment consistency and growth and compare other key metrics to the criteria outlined by Benjamin Graham:
Dividend History: From the historical data, it appears that SPXX has paid dividends consistently over time. Starting from January 2006 through the latest entry in December 2023, there is no interruption in dividend payments, and dividends are paid quarterly. A closer look reveals that there has also been some growth in the dividend amounts over this period. The dividend amount was $0.135 in early 2006, with gradual increases over the years, to $0.294 per quarter in the most recent entries of 2023. This indicates a commitment to returning value to shareholders, aligning with Graham's preference for companies with a consistent and growing dividend record.
PE Ratio: The PE ratio provided is 78.56, which is quite high. Benjamin Graham preferred stocks with low PE ratios compared to their industry peers, as a low PE ratio may indicate that the stock is undervalued. A PE ratio of 78.56 would likely be considered too high by Graham's standards, potentially signaling an overvalued stock or a company with earnings that are not sufficient to justify its current share price.
PB Ratio: The PB ratio is 1.0158, which indicates that the stock is trading at a slight premium to its book value. Graham often sought stocks trading below their book value for the margin of safety, although a PB ratio close to 1 could still be considered reasonable depending on other factors including industry standards, asset composition, and company prospects.
Debt-to-Equity Ratio: The debt-to-equity ratio for SPXX is 0.0, which means that the fund does not have any debt. This aligns perfectly with Graham's criteria, as he preferred companies with low or no debt to mitigate financial risk.
Other Metrics: Unfortunately, without data on the earnings growth, current and quick ratios, and other financial statement analysis, it is not possible to fully evaluate the fund based on Graham's methods for stock screening. However, based on the provided information, we can say that the fund maintains a consistent and growing dividend record and has no debt, both of which are in line with Graham's principles. The high PE ratio, on the other hand, would likely be a point of concern, implying that the price of the fund may not offer a sufficient margin of safety as per Graham's conservative investment philosophy.
When preparing a research report for a client using Graham's approach, one would ideally supplement these metrics with a thorough review of the fund's overall investment strategy, portfolio holdings, management team, historical performance, and comparison to peers, not to forget the general market conditions which can greatly affect how Graham's principles should be applied.
| Statistic Name | Statistic Value |
| R-squared | 0.662 |
| Adj. R-squared | 0.662 |
| F-statistic | 2,462 |
| Prob (F-statistic) | 3.35e-298 |
| Log-Likelihood | -1,462.0 |
| AIC | 2,928 |
| BIC | 2,938 |
| Const Coef | -0.0154 |
| Const P>|t| | 0.482 |
| Beta | 0.8243 |
| Std Err | 0.017 |
| t | 49.621 |
| P>|t| | 0.000 |
| [0.025 | 0.792 |
| 0.975] | 0.857 |
| Omnibus | 428.992 |
| Prob(Omnibus) | 0.000 |
| Jarque-Bera (JB) | 69,753.921 |
| Skew | -0.371 |
| Prob(JB) | 0.00 |
| Kurtosis | 39.487 |
| Cond. No. | 1.32 |
| Alpha | -0.0154 |
In the linear regression analysis of SPXX as a function of SPY, the market proxy, a generally strong positive relationship is indicated by an R-squared value of 0.662, explaining about 66.2% of the variability in SPXX's returns with the variability in SPY's returns. The coefficient, or beta value, for SPY is 0.8243, suggesting that for every percentage point movement in SPY, SPXX is expected to move about 82.43% in the same direction, on average. The F-statistic is significant with a practically zero probability of obtaining this large of a value under the null hypothesis of no correlation, reinforcing the strength of the relationship observed.
Alpha, the intercept term of the regression, is estimated to be -0.0154, implying a slight average underperformance of SPXX relative to the regression line, which is treated as the expected performance given SPY's return, when SPY's return is zero. However, the p-value for alpha is 0.482, much higher than conventional thresholds for statistical significance (typically p < 0.05), suggesting that the alpha is not significantly different from zero, and hence there isn't strong evidence that SPXX's returns are different from what would be expected based on SPY's returns over the period in question. Additionally, this model appears to be robust in terms of the condition number, which is low, indicating little multicollinearity in the independent variables.
The Nuveen S&P 500 Dynamic Overwrite Fund (SPXX) offers a distinct approach to investing, aiming to provide investors with a combination of income, managed volatility, and the potential for capital appreciation. This closed-end fund operates by investing in a diversified portfolio largely consisting of S&P 500 stocks while simultaneously engaging in an options strategy known as a 'dynamic overwrite' to generate additional income. It's worth noting that this strategy involves selling call options on up to 100% of the fund's equity portfolio, which allows the fund to earn option premiums.
The dynamic aspect of the overwrite strategy is an attractive feature. It allows the Nuveen fund managers to vary the coverage level based on market conditions and volatility. During periods when markets are expected to be flat or move modestly higher, a more extensive portion of the portfolio may be covered with written call options. Conversely, if the market is expected to rise significantly, the coverage can be reduced to allow for greater capital appreciation.
Despite not focusing on the risks of investing in stocks, it is noteworthy that the fund implements a risk-managed approach. This includes focusing on high-quality, dividend-paying stocks within the S&P 500, which can provide a level of stability and potential for growth. Since dividends contribute to the total return of equity investments, these stocks add a layer of potential income for the fund's investors.
The aspect of active management should not be underestimated when it comes to Nuveen's approach. The fund is managed by a team of seasoned investment professionals who utilize rigorous research and analysis to determine the appropriate stocks to include and the proportion of the fund that should be subject to the dynamic overwrite strategy. This active management component is particularly crucial for the fund's strategy to be successful since the correct execution of the options strategy is dependent on market conditions, which can change quickly and unpredictably.
Investors in the Nuveen S&P 500 Dynamic Overwrite Fund also enjoy the benefits of diversification. Since the fund invests in a broad range of companies across the S&P 500, risks could be spread across various sectors, reducing the impact of any single underperforming industry or company. This is a foundational principle of investment that the fund holds in high regard.
The distribution policy of the fund is another appealing aspect for investors seeking regular income. The fund aims to distribute income monthly, which can be a significant advantage for those who require steady cash flow, such as retirees or individuals looking for a consistent income stream.
The fund's performance must be measured against the backdrop of broader market dynamics. The use of a dynamic overwrite strategy can result in performance that differs from the S&P 500 index. During strong bull markets, the fund may underperform the index due to the call options capping the upside potentials. However, during more volatile or moderately rising markets, the income generated from the options can help cushion downside risks and potentially outperform the index, considering the fund's focus on income generation.
The accessibility of the Nuveen S&P 500 Dynamic Overwrite Fund to investors is enhanced by its trading on the New York Stock Exchange (NYSE). This means that the fund can be bought and sold like a stock, providing liquidity and the flexibility to alter investment positions as needed.
Investors interested in the Nuveen S&P 500 Dynamic Overwrite Fund might keep an eye on the fund's net asset value (NAV) performance as well as its market price, as closed-end funds can trade at a discount or premium to their NAV. Understanding these dynamics can provide insight into market perception and the potential for buy or sell opportunities.
For those looking for additional details regarding the fund's investments, management team, fees, distribution history, and general operation, Nuveen maintains a detailed web page dedicated to the fund. Prospective and current investors would be wise to refer to this resource regularly for updates and fund announcements. The page can be accessed here: Nuveen S&P 500 Dynamic Overwrite Fund.
In summary, the Nuveen S&P 500 Dynamic Overwrite Fund is designed for investors who are seeking a combination of income, managed volatility, and the potential for capital appreciation, while actively managing risk. The dynamic overwrite strategy is an innovative way to approach income generation within a diversified equity portfolio and highlights Nuveen's commitment to offering investors sophisticated investment solutions. With its unique mix of investment strategies, the SPXX fund can be a valuable component of a diversified investment portfolio.
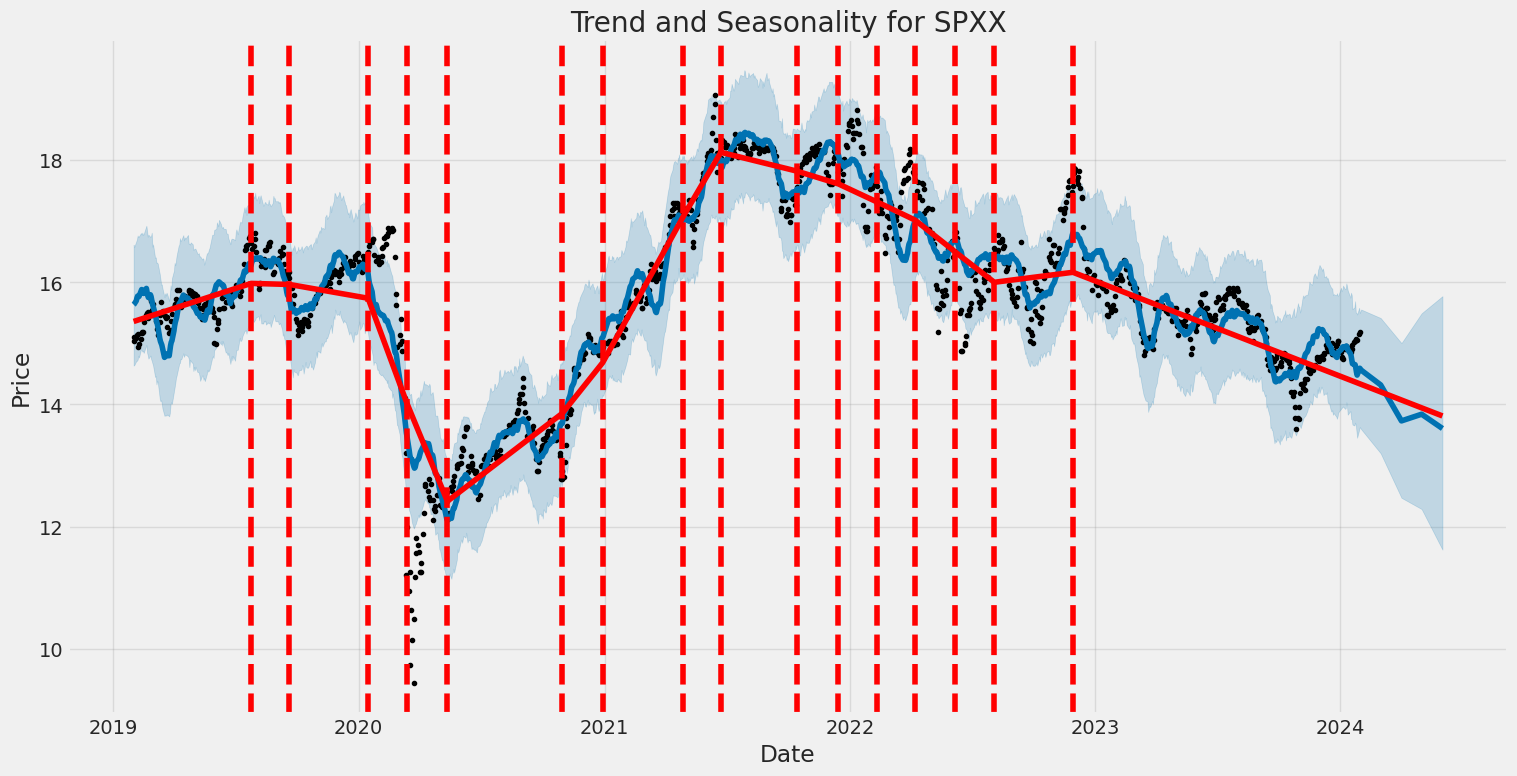
From January 31, 2019, to January 30, 2024, the volatility of the Nuveen S&P 500 Dynamic Overwrite Fund (SPXX) can be summarized as follows. The model used to analyze the volatility, an ARCH model, shows that the returns over this period do not have a significant average trend over time as indicated by the zero mean model. The omega coefficient is 0.7915, suggesting a baseline volatility, while the alpha coefficient is 0.5229, which implies that past returns have a moderate impact on the current volatility, meaning volatilities tend to cluster over time.
Here's the HTML table of statistics extracted from the ARCH model results:
| Statistic Name | Statistic Value |
|---|---|
| Mean Model | Zero Mean |
| R-squared | 0.000 |
| Adj. R-squared | 0.001 |
| Log-Likelihood | -1888.02 |
| AIC | 3780.04 |
| BIC | 3790.32 |
| No. Observations | 1,257 |
| omega | 0.7915 |
| alpha[1] | 0.5229 |
When assessing the financial risk associated with a $10,000 investment in Nuveen S&P 500 Dynamic Overwrite Fund (SPXX) over a one-year period, a combined approach using volatility modeling and machine learning predictions can offer a robust understanding of potential risk exposures.
The volatility modeling technique is a statistical method for estimating the time-varying volatility or standard deviation of returns of a financial instrument. This approach is particularly well-suited to capture the clustering of volatility, a common feature in financial return series, where large changes in prices tend to be followed by more large changes - either positive or negative - and periods of calm tend to be followed by more calm. By calibrating the parameters of the volatility model, we can derive a series of predicted conditional volatilities for the investment in SPXX.
Understanding volatility is crucial when attempting to project the potential range of outcomes for any investment. It directly influences the calculation of the Value at Risk (VaR), a statistical technique used to measure and quantify the level of financial risk within a firm, portfolio, or position over a specific time frame. The VaR calculation, using the volatility model outputs, allows us to estimate that over the next year there is a 95% probability that our $10,000 investment will not lose more than $123.89 due to market moves.
On the other hand, machine learning predictions, specifically utilizing an algorithm that can uncover patterns from historical price data, can provide a complementary view of the expected investment returns. Within our analysis, this algorithm serves to anticipate future returns based on inputs such as past performance, trading volume, market sentiment, and other relevant factors, creating a comprehensive model that reflects both historical trends and potential future outcomes.
By integrating the findings from volatility modeling and machine learning predictions, we can gain insight into the dual aspects of historical price fluctuation and prospective return scenarios of SPXX. This integration is potent as it captures both the underlying uncertainty (as measured by volatility) and the predictive insights of future returns, enabling a more nuanced risk assessment.
Given the calculated annual VaR of $123.89 at a 95% confidence level, the investor could expect with 95% confidence that they would not lose more than this amount over the course of one year due to market risk. This allows investors to make informed decisions based on their risk appetite and investment horizons. The results provide a quantified risk parameter, helping to shape expectations and serve as a critical component in the risk management process.
In summary, the ensemble of volatility modeling techniques and machine learning predictions furnish a comprehensive picture of the potential risks inherent in a $10,000 equity investment in the SPXX. It quantifies not only the typical variability of returns, accounted for by the volatility model but also projects the investment outlook using predictive algorithms. Through this integrated approach, investors are better positioned to understand and manage their financial risk.
Similar Companies in Asset Management:
Nuveen S&P 500 Buy-Write Income Fund (BXMX), Voya Global Equity Dividend and Premium Opportunity Fund (IGD), Nuveen Nasdaq 100 Dynamic Overwrite Fund (QQQX), Nuveen Real Asset Income and Growth Fund (JRI), Nuveen Dow 30 Dynamic Overwrite Fund (DIAX), BlackRock Enhanced International Dividend Trust (BGY), Eaton Vance Tax-Managed Global Buy-Write Opportunities Fund (ETW), First Trust MLP and Energy Income Fund (FEI), BlackRock Science and Technology Trust (BST), Highland Funds I - Highland Income Fund (HFRO), Columbia Seligman Premium Technology Growth Fund (STK), AllianceBernstein National Municipal Income Fund, Inc. (AFB), Eaton Vance Short Duration Diversified Income Fund (EVG), Virtus Diversified Income & Convertible Fund (ACV), Ares Dynamic Credit Allocation Fund, Inc. (ARDC), DWS Municipal Income Trust (KTF), Neuberger Berman Real Estate Securities Income Fund Inc. (NRO), Western Asset Diversified Income Fund (WDI), CBRE Global Real Estate Income Fund (IGR), BlackRock, Inc. (BLK), The Vanguard Group, Inc. (N/A), Report: State Street Corporation (STT), State Street Corporation (STT), Invesco Ltd. (IVZ), T. Rowe Price Group, Inc. (TROW), Charles Schwab Investment Management, Inc. (SCHW)
Copyright © 2024 Tiny Computers (email@tinycomputers.io)
Report ID: arStoNc
Cost: $0.14438
https://reports.tinycomputers.io/SPXX/SPXX-2024-01-30.html Home