State Street Corporation (ticker: STT)
2024-01-27
 State Street Corporation (NYSE: STT), founded in 1792, is a leading provider of financial services to institutional investors globally, including investment servicing, investment management, and investment research and trading. With $38.79 trillion in assets under custody and administration and $3.59 trillion in assets under management as of December 31, 2022, State Street operates worldwide in more than 100 geographic markets and employs approximately 40,000 people. The company offers a broad suite of services such as fund accounting, fund administration, risk and analytics, securities lending, and foreign exchange, catering to the needs of mutual funds, pension funds, hedge funds, sovereign wealth funds, and other institutional clients. State Streets commitment to technology, innovation, and client service underscores its role as a custodian and manager in the asset management industry. The corporations strategic focus is on capitalizing on its scale, enhancing its efficiency, and delivering solutions that enable clients to meet the challenges of the investment landscape. As a significant player in the financial industry, State Street's financial health, market position, and operational strategies are closely monitored by investors, clients, and market analysts.
| Address | One Congress Street, Boston, MA, 02114-2016, United States | Phone | 617 786 3000 | Website | https://www.statestreet.com |
| Industry | Asset Management | Sector | Financial Services | Full Time Employees | 46,451 |
| Previous Close | 74.68 | Open | 74.87 | Day Low | 74.58 |
| Day High | 75.84 | Dividend Rate | 2.76 | Dividend Yield | 3.67% |
| Payout Ratio | 47.31% | Five Year Avg Dividend Yield | 3.02 | Beta | 1.552 |
| Trailing PE | 13.46 | Forward PE | 8.80 | Volume | 1,732,932 |
| Average Volume | 2,038,688 | Average Volume 10 Days | 3,019,460 | Market Cap | 22,679,013,376 |
| 52 Week Low | 62.78 | 52 Week High | 94.74 | Price to Sales (TTM) | 1.91 |
| 50 Day Average | 74.5846 | 200 Day Average | 71.0168 | Trailing Annual Dividend Rate | 2.64 |
| Trailing Annual Dividend Yield | 3.54% | Currency | USD | Enterprise Value | -50,155,982,848 |
| Profit Margins | 16.34% | Float Shares | 285,038,196 | Shares Outstanding | 301,944,000 |
| Shares Short | 2,198,464 | Held Percent Insiders | 0.472% | Held Percent Institutions | 92.876% |
| Short Ratio | 1.22 | Short Percent of Float | 0.86% | Book Value | 72.275 |
| Price to Book | 1.04 | Net Income to Common | 1,820,999,936 | Trailing EPS | 5.58 |
| Forward EPS | 8.54 | PEG Ratio | 1.73 | Last Split Factor | 2:1 |
| Last Split Date | 06/18/2001 | Enterprise to Revenue | -4.22 | Fiscal Year End | 12/31/2021 |
| Next Fiscal Year End | 12/31/2024 | Most Recent Quarter | 12/31/2021 | Earnings Quarterly Growth | -71.4% |
| Revenue Quarterly Growth | -3.9% | Operating Margins (TTM) | 14.82% | Total Cash | 99,176,996,864 |
| Total Cash Per Share | 328.46 | Total Debt | 24,366,000,128 | Total Revenue | 11,898,999,808 |
| Sharpe Ratio | -14.164321940413663 | Sortino Ratio | -195.11255356202895 |
| Treynor Ratio | -0.08918274096082203 | Calmar Ratio | -0.43998668123974954 |
Upon analyzing the provided set of company fundamentals in conjunction with the advanced technical data, all key indicators point towards a nuanced and multi-faceted view of the stock's potential direction in the next few months.
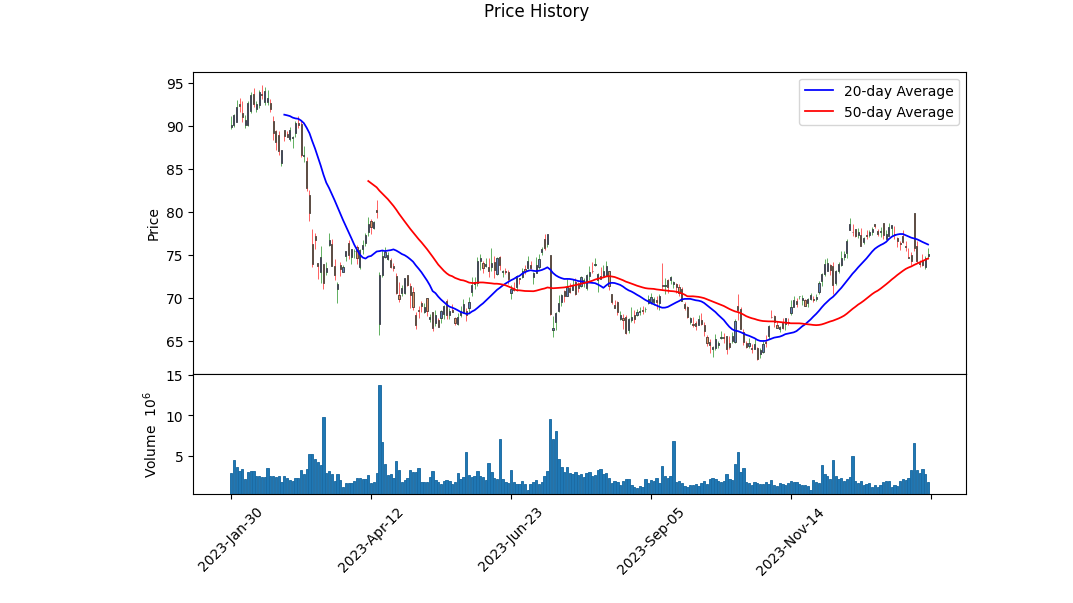
The recent technical data reveals a slight increase in stock price with the Open at $66.82 on October 2nd, and the High reaching $76.58 by January 22nd. However, the recorded data on January 26th indicates a close slightly lower than the peak observed during this period. On-Balance Volume (OBV) trend shows increased trading volume and positive accumulation, suggesting there is buying interest despite the lowering MACD histogram values.
On the fundamental side, earnings and revenue growth show a contraction with respective figures of -0.712 and -0.039. Operating margins remain modest at 0.1482. The trailing PEG ratio of 5.4475 suggests that the stock may be overvalued based on expected growth rates. The analyst expectations forecast a recovery with an average earnings estimate increase for the next year, indicating improved sentiment from industry experts.
Risk-adjusted performance ratios, including the Sharpe, Sortino, Treynor, and Calmar ratios, present a less favorable view, showing substantial negative values which implies underperformance relative to risk-free assets on a risk-adjusted basis. This divergence between the risk-adjusted returns and the technical and analysts' outlook could be attributed to market volatility and investors' risk perceptions of this particular stock.
Financial analysis of the balance sheets shows a stable debt level with a minor reduction in total debt from year to year. The company's cash flow statement indicates a strong position, with a significant free cash flow and strategic debt issuances allowing for operational flexibility. Nevertheless, the large-scale repurchase of capital stock and repayment of debt reveal an emphasis on adjusting capital structure and returning value to shareholders.
Considering all the data presented, the stock's price movement in the next few months is likely to be influenced by investor sentiment, the broader market trends, and the company's ability to navigate its apparent financial restructuring and the challenges of current revenue contraction. While technical indicators show some buying interest, this must be carefully weighed against the negative risk-adjusted performance indicators.
Market participants might be cautious due to the apparent risk but may also consider the positive signals in analyst expectations and free cash flow as indicators for potential upside. Additionally, operational agility demonstrated by management could play a pivotal role in how the stock is evaluated moving forward. Specific attention to forthcoming quarterly earnings reports and any significant news related to the industry or the company's operations will be instrumental in shaping the next few months' stock price trajectory.
The underpinnings of the stock's performance signify a mixed outlook; factoring the strong cash position, prospective growth in earnings, and an active approach to capital management, alongside technical indicators pointing towards a potential uptrend, albeit with caution due to the starkly negative risk-adjusted ratios reflecting underperformance in a volatile market context.
| Statistic Name | Statistic Value |
| Alpha (Intercept) | -0.0347 |
| Beta (Slope) | 1.3067 |
| R-squared | 0.485 |
| Adj. R-squared | 0.484 |
| F-statistic | 1,181 |
| Prob (F-statistic) | 6.50e-183 |
| Log-Likelihood | -2,503.8 |
| AIC | 5,012 |
| BIC | 5,022 |
| No. Observations | 1,257 |
| Df Residuals | 1,255 |
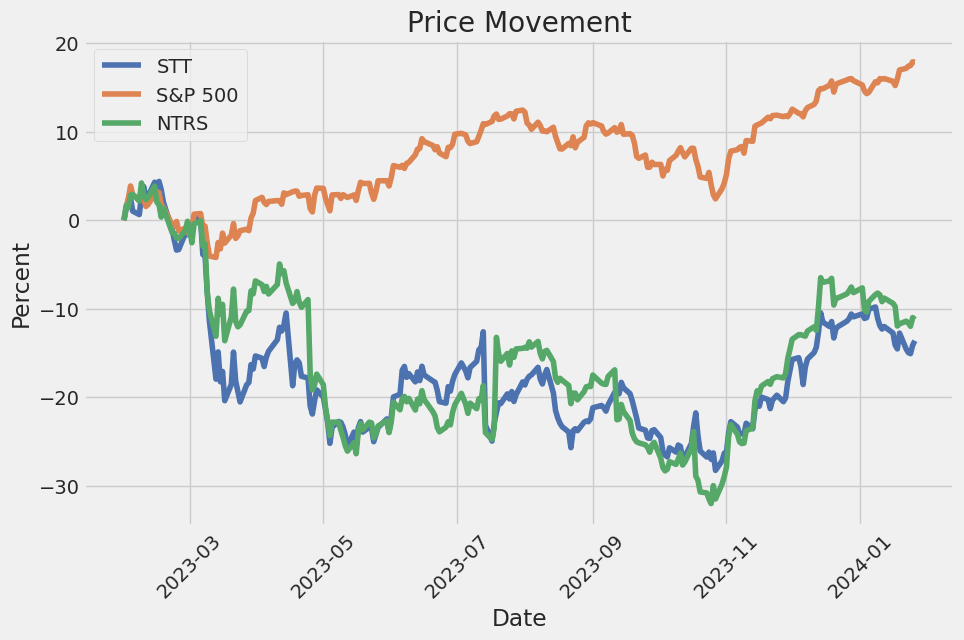
In the observed time period, the linear regression model indicates a somewhat strong positive relationship between STT and SPY, with an R-squared value of 0.485. This implies that about 48.5% of the variability in STT can be explained by the model. The coefficient for SPY, also known as the beta of the model, is 1.3067, suggesting that for each unit increase in SPY, STT is expected to increase by approximately 1.307 units, holding all else constant.
The alpha, or intercept, indicates the expected value of STT when SPY is zero. In this model, the alpha is -0.0347, suggesting a slightly negative starting value for STT in the absence of any movement in SPY. However, the alpha is not statistically significant, with a p-value of 0.489, meaning we cannot confidently claim that the intercept differs from zero in the population. This model's reliability is further affirmed by a low AIC and BIC, along with a high F-statistic, indicating a good explanatory power and overall fit.
State Street Corporation, a financial services provider, held its fourth quarter and full-year 2023 earnings conference call and webcast, which was introduced by Ilene Fiszel Bieler, Global Head of Investor Relations. CEO Ron O'Hanley began by reflecting on the dynamic operating environment of 2023, expressing pride in the company's navigation through various challenges and its focus on sales growth, strategic changes in investment services, and disciplined cost management. The company took key productivity actions and announced additional efficiency measures to enhance operating model productivity in the future. Despite global challenges and a modest tailwind to fee revenue, State Street saw growth in earnings due to factors such as common share repurchases, a record level of Net Interest Income (NII), and growth in its front office software and data business.
O'Hanley highlighted the companys accomplishments such as strong business momentum, multiple Alpha mandate wins, innovation in product capabilities, and strategic expansions. He also mentioned the company was named the best FX bank for real money clients by Euromoney Magazine. Their efficiency and productivity efforts led to well-controlled expense growth, and he discussed streamlining operations in India to improve service quality and client experience, resulting in expected productivity savings. O'Hanley concluded his remarks by noting the company's strong balance sheet and capital return to shareholders, with a new common share purchase program authorized for up to $5 billion.
CFO Eric Aboaf then detailed the financial results, mentioning notable items including an FDIC special assessment and repositioning charges related to the productivity program. Excluding notable items, expenses were well managed. The full-year earnings per share growth of 3% excluding notable items was supported by share repurchases and a record level of NII. Aboaf provided a review of servicing and management fees, the impact of market conditions on various business lines, and a strong growth momentum in their front office software and data business. The investment portfolio repositioning also contributed to a better-than-expected NII performance.
Aboaf outlined the full-year 2024 outlook, addressing macro expectations such as flat global equity markets point to point, alignment with the forward interest rate curve, and slight increases in FX and equity volatility. The company aims for full-year total fee revenue growth of 3% to 4% excluding notable items. They also expect full-year NII to be down about 10% year-over-year due to global rate cuts and deposit mix levels. Lastly, for 2024, the company intends to achieve positive fee operating leverage, excluding notable items, given projected growth in fee revenue and controlled expenses. The tax rate is expected to be in the 21% to 22% range for 2024.
The Q&A session covered topics such as the sustainability of SSGA flows, details on servicing fee wins, the effect of Basel III modifications on capital plans, and the optimization of the securities portfolio in the context of NII enhancement versus share buybacks. The discussion also touched on the regulatory front, with a question related to comments from the FDIC regarding regulations for large index fund providers.
In the third quarter of 2023, State Street Corporation reported earnings per share (EPS) of $1.25, representing a decrease of 31% compared to the same period in 2022. This decrease includes a pre-tax loss on the sale of investment securities amounting to approximately $294 million related to an investment portfolio repositioning, which diminished EPS by $0.68 for the quarter. Overall, total revenue decreased by 9%, while total expenses increased by 3%. Notably, the decline in EPS was primarily driven by the investment portfolio repositioning loss and a decrease in net interest income (NII), which fell by 5%.
Fee revenue, however, showed a modest increase of 3%, driven by higher servicing fees, management fees, software and processing fees, and other fee revenue. This was counteracted by declines in securities finance and foreign exchange (FX) trading services revenue. Servicing fees saw a 1% increase, attributed to higher average equity market levels, net new business, and currency translation impacts, despite lower client activity and adjustments. Management fees also increased by 1%, largely due to higher equity market levels, while foreign exchange trading services revenue saw a 2% decrease, mainly as a result of diminished direct FX spreads and lower market volatility. Additionally, securities finance revenue dropped by 6% due to lower agency balances and reduced specials activity.
Software and processing fees revenue grew by 2%, largely due to increased front office software and data revenue associated with Charles River Development (CRD). Other fee revenue also increased by $49 million due to an accounting change related to tax credit investments and fewer negative market-related adjustments. Nevertheless, the lower average deposit balances and a shift towards interest-bearing deposits partially offset gains from higher interest rates, contributing to the decline in NII.
There was no provision for credit losses recorded in the third quarter of 2023, as an increase in reserves for commercial real estate loans balanced out the reduction in reserves for leveraged loans. Salaries and ongoing business investments were the primary drivers for the rise in expenses, albeit productivity savings and the absence of acquisition and restructuring costs from the prior year provided some offset.
During this quarter, State Street returned approximately $1.2 billion to shareholders through common stock dividends and share repurchases. The company's return on equity at 7.3% reflected a significant decrease from the prior year's 11.2%, largely due to the investment securities sale loss. The pre-tax margin also dropped to 19%, a decrease from the prior year's 28.7%, again influenced by the securities loss and heightened expenses. Operating leverage, defined as the difference between the change in total revenue and expenses, was negative at 12.4 percentage points, significantly impacted by the loss from the securities sale.
Overall, State Street's financial results for the third quarter of 2023 show resilience in fee revenue amidst challenging conditions, but the EPS and profit margins were adversely affected by the repositioning of the investment portfolio and the ensuing loss from the sale of investment securities.
State Street Corporation, a key entity in the Zacks Banks - Major Regional industry, underscores its operational prowess with consecutive earnings outperformance. In a report by Zacks Equity Research released on January 5, 2024, the company's reputation for eclipsing earnings estimates is affirmed, with an average earnings surprise of 6.68% for the most recent quarters. Furthermore, a closer look at the previous quarter's performance reveals an earnings surprise of 9.04%, showcasing the company's ability to exceed market expectations reliably.
Analyst sentiment has been buoyant regarding State Street's earnings trajectory, leading to upward revisions in earnings estimates. This is particularly noteworthy given that the positive Earnings ESP (Expected Surprise Prediction) for State Street stands at +0.46%. This proprietary Zacks indicator, premised on precise and fresh analyst insights, offers a nearly 70% probability of outstripping earnings projections for companies with a Zacks Rank of #3 (Hold) or better, combined with a positive Earnings ESP. As such, the upcoming earnings release on January 19, 2024, carries significant investor interest. For further details, the analysis can be reviewed at Zacks.com: Zacks Research on State Street Corporation.
However, on January 12, 2024, a subsequent Zacks report tempered the outlook with projections of a decrease in quarter-over-quarter earnings, highlighting concerns over a potential year-over-year decline in both earnings and revenues. The expected earnings of $1.81 per share and revenue of $2.94 billion represent decreases of 12.6% and 6.8%, respectively, compared to the prior year. Yet, the consensus EPS estimate has seen a revision upwards by 4.75% over the last month, leveling the Most Accurate Estimate with the Zacks Consensus Estimate. This results in an Earnings ESP of 0%, signifying tempered expectations for an earnings beat. This article can be further explored here: Earnings Preview: State Street Corporation (STT) Q4 Earnings Expected to Decline.
State Street Corporation's positioning as a premier financial services provider is evidenced by the general resilience of U.S. markets amidst global shocks. The muted market reaction to geopolitical events indicates a shift in focus to other dynamics like interest rate movements, incited by speculation around rate cuts as inflation trends downward. For an in-depth examination of these market sensitivities and the impact of geopolitics on State Street's operations, the following source provides valuable insights: YouTube.
In terms of broader economic and financial sector resilience, State Street has stood firm in response to aggressive Federal Reserve rate hikes and inflations pressures. The collaboration between regulators and private sector banks in managing the crisis fallout from Credit Suisse and regional bank failures is indicative of the strengthened financial system. Despite the complex financial landscape, State Street's leadership forecasts a conservative approach from the Federal Reserve concerning rate cuts to prevent an inflation rebound, contrasting with the markets' more aggressive expectations. The corporate focus on investment market performance and anticipation of global economic growth trends, with particular attention to China's slowing growth and the impact of deglobalization, remains crucial. U.S. policy consistency, in the light of the upcoming elections, will also be key for the nation to maintain its global presence. These multifaceted financial and policy considerations affecting State Street and the industry can be found at this link.
Contrasting the somewhat cautious forecasts, the preliminary Q4 results reported by Zacks on January 19, 2024, suggest State Street's continued outperformance. With an earnings surprise of 12.71% and revenue exceeding estimates by 3.43%, the firm's display of profitability and revenue-generation capacity in a tough economic climate is clear. Despite the slight year-over-year revenue dip, State Street beat EPS estimates three times across the last four fiscal quarters, reinforcing investor faith. However, the discrepancy between the strong financial performance and the 4.1% decline in share value since the beginning of the year showcases the complex nature of stock performance vis-a-vis earnings results. State Street's stock outlook appears promising with a favourable Zacks Rank #2 (Buy), and industry analysis positions it in the top echelon of over 250 Zacks industries. The stock and sector's unfolding performance are focal points for investors moving forward. The full article that discusses these details can be found here.
Drawing closer to the earnings release, Zacks indicated, on January 17, 2024, a slight edge in State Streets earnings estimates. With the Most Accurate Estimate being $1.82 per share compared to the consensus of $1.81, and a Zacks Earnings ESP of +0.38%, the conditions were ripe for a potential earnings beat. Factoring in the company's Zacks Rank #2 (Buy), the forecast hinted at solid fundamentals and prospects for upward movement. Investors might find it beneficial to carefully scrutinize the developments and implications of State Street as it navigates through earnings season, with the complete report accessible here: (https://www.zacks.com/stock/news/2211325/why-state-street-stt-might-surprise-this-earnings-season).
In the revealed quarterly figures, State Street's revenue of $3.04 billion surpasses expectations, and the Adjusted EPS of $2.04 was a welcome surprise against the forecasted $1.81. Despite a significant drop in diluted earnings per share, a $103 billion acquisition in net inflows bolstered investor confidence, as reflected by a pre-market surge in share price. The company's success in securing new servicing fee revenue, particularly in its Alpha mandates and ETFs, highlights the strength and attractiveness of State Streets offerings. Further details on this financial announcement can be perused at Proactive Investors.
Amid quarterly earnings projections, State Street faced anticipation of decreased performance in both revenue and earnings. Zacks portrayed the overall expectations of a downturn, yet the Most Accurate Estimate and consensus remained aligned, and the Earnings ESP stood neutral at 0%. Even with fluctuations in key metrics such as a reduced 'Average balance - Total interest-earning assets' and 'Tier 1 Leverage Ratio,' projections for a rise in AUM presented a silver lining. Yet stock performance for State Street over the past month exhibited a -1.4% decline when set against the S&P 500's +3.1% rise. For a comprehensive analysis of the key metrics and their implications for investors, the full Zacks Equity Research report can be accessed here.
Further in-depth comparison of State Street's key financial metrics against Wall Street estimates allows for a nuanced understanding of the company's quarterly performance. The company recorded a net interest margin (FTE) of 1.2% and total interest-earning assets averaging $232.23 billion, surpassing estimates. The elevated AUM and AUC/A figures exceeded analyst expectations, reflecting the company's robust capital position. Despite the share performance lag over the past month, Zacks assigned State Street a promising Rank #2 (Buy). For a closer look at these key metrics, the Zacks.com article dated January 19, 2024, is available for reference: Source.
State Street also reported a year-over-year EPS dip alongside a marginal decline in revenues but managed to outdo the consensus estimates. Stable fee revenue and growing asset custody and management underscored the earnings report. However, NIR experienced a significant drop, emphasizing challenges such as lower deposit balances and a shift in the deposit mix. Investment strategy and shareholder return remained points of focus for the company's strategy, following a robust share repurchase program. These findings, part of Zacks Equity Research's coverage, offer a clear view of State Street's financial situation as of January 19, 2024, with full information available for review in the source article.
In light of the positive earnings report, State Street's stock was noted in an article by Chelsey Dulaney on January 19, 2024, as a stock to monitor. However, the article does not provide explicit reasons why State Street was singled out, suggesting a broader market context is at play. To gain a comprehensive understanding of the market dynamics at hand, one can visit the Yahoo Finance article here: https://finance.yahoo.com/m/78fd7d33-9d62-3ad5-837c-a97a3be528f5/stocks-to-watch-friday%3A.html.
The financials of the fourth quarter painted a mixed picture for State Street Corporation, with revenue declining marginally by 3.6% and EPS falling by a slight measure, proving stronger than estimates. Comprehensive evaluations of the companys performance depicted a sturdy financial state with projections for a bright future despite minor setbacks. Shares of the corporation fell by 3.5%, in comparison with a modest gain for the S&P 500, yet the Zacks Rank #2 (Buy) indicates potential for a positive market turnout. A thorough analysis of the financial results is available on Yahoo Finance for those seeking a more in-depth review: https://finance.yahoo.com/news/compared-estimates-state-street-corporation-143007272.html.
As 2023 concluded, State Street delivered adjusted earnings that, while surpassing estimates, depicted a minor drop from the previous year. Despite challenges such as lower net interest revenues and increased costs, the strong inflows into AUM and a robust repurchase program drove investor optimism. Amid spreads tightening and higher operating expenses, the company continued to bank on the ascending interest rates and enduring business servicing gains. State Street's industry contemporaries echoed these complex financial results, balancing positive growth in asset management against operational hardships. This financial synthesis, as discussed in the Zacks Equity Research article on Yahoo Finance, is obtainable for further contemplation here.
The volatility of State Street Corporation (STT) between January 29, 2019, and January 26, 2024, as captured by an ARCH model, suggests that fluctuations in STT's asset returns were significant enough to model but not predictable by past returns alone since the R-squared value is effectively zero. The estimated coefficient (omega) for the baseline volatility was 4.0723, indicating a certain level of underlying variability in the returns. The size of the ARCH term (alpha[1]) was 0.2997, meaning that past return shocks had a moderate, positive impact on future volatility.
Here's the HTML table with the key statistics:
| Statistic Name | Statistic Value |
|---|---|
| Mean Model | Zero Mean |
| Vol Model | ARCH |
| Log-Likelihood | -2,822.63 |
| AIC | 5,649.26 |
| BIC | 5,659.53 |
| No. Observations | 1,257 |
| omega | 4.0723 |
| alpha[1] | 0.2997 |
When assessing the financial risk associated with a $10,000 investment in State Street Corporation (STT) over the course of one year, a two-pronged approach that combines volatility modeling with machine learning predictions can offer a multifaceted insight into the investment's risk profile.
Volatility modeling is particularly useful in estimating the variability of State Street Corporation's stock prices over time. This methodology allows for a dynamic understanding of risk that reflects market conditions and historical price trends. By employing this model, we can track how the volatility of the investment changes and generate a forecast of future volatility. These forecasts can be instrumental in predicting periods of high risk, during which the price movements of the stock are expected to be greater, potentially affecting the investment in a more significant manner.
On the other hand, machine learning predictions employ a variety of algorithms to analyze historical data and identify patterns that might influence the future performance of the asset. Specifically, the use of an algorithm that is adept at capturing complex relationships within the data without explicit programming for the task can provide a forward-looking perspective on the expected returns of State Street Corporation's stock. This algorithm's predictive capabilities are particularly beneficial for forecasting future price movements, an essential piece in the overall risk assessment puzzle.
By bringing together the insights from volatility modeling and machine learning predictions, we can then calculate the Value at Risk (VaR) for the investment. VaR is a statistical measure that estimates the maximum potential loss on an investment over a specified time period at a given confidence level. In this case, at a 95% confidence interval, this analysis suggests that the VaR for a $10,000 investment in State Street Corporation is $319.13. This number indicates that, under normal market conditions, there is a 95% chance that the investment will not lose more than $319.13 over the course of one year.
The VaR calculation provides a quantifiable metric that investors can use to determine whether the potential risk aligns with their individual risk tolerance. It encapsulates a measure of market and investment uncertainty, giving investors a concrete figure by which to gauge the expected downside risk. When individual investors or financial managers are equipped with an understanding of both the potential volatility and predicted returns, they can make more informed decisions about their portfolio compositions, risk management strategies, and capital allocation.
Similar Companies in Asset Management:
Northern Trust Corporation (NTRS), Franklin Resources, Inc. (BEN), Invesco Ltd. (IVZ), T. Rowe Price Group, Inc. (TROW), Report: The Bank of New York Mellon Corporation (BK), The Bank of New York Mellon Corporation (BK), SEI Investments Company (SEIC), Principal Financial Group, Inc. (PFG), Affiliated Managers Group, Inc. (AMG), Janus Henderson Group plc (JHG), Ameriprise Financial, Inc. (AMP), BlackRock, Inc. (BLK), Main Street Capital Corporation (MAIN), Blackstone Inc. (BX), Ares Capital Corporation (ARCC), JPMorgan Chase & Co. (JPM), Citigroup Inc. (C), Report: Bank of America Corporation (BAC), Bank of America Corporation (BAC), Goldman Sachs Group, Inc. (GS), Morgan Stanley (MS), Charles Schwab Corporation (SCHW)
https://www.youtube.com/watch?v=zxK7G3Ol6Vo
https://seekingalpha.com/article/4659252-state-street-stock-dividend-growth-and-capital-strength
https://www.youtube.com/watch?v=xYoydpMDJdU
https://www.zacks.com/stock/news/2211325/why-state-street-stt-might-surprise-this-earnings-season
https://www.proactiveinvestors.com/companies/news/1038920?SNAPI
https://finance.yahoo.com/news/state-street-corporation-stt-q4-134503585.html
https://finance.yahoo.com/news/compared-estimates-state-street-corporation-143007272.html
https://finance.yahoo.com/news/state-street-stt-stock-gains-150300639.html
https://finance.yahoo.com/m/78fd7d33-9d62-3ad5-837c-a97a3be528f5/stocks-to-watch-friday%3A.html
https://www.sec.gov/Archives/edgar/data/93751/000009375123000694/stt-20230930.htm
Copyright © 2024 Tiny Computers (email@tinycomputers.io)
Report ID: ZCMOUW
Cost: $0.92483
https://reports.tinycomputers.io/STT/STT-2024-01-27.html Home