Southwestern Energy Company (ticker: SWN)
2024-01-22
 Southwestern Energy Company (SWN) is a leading natural gas exploration and production company with a primary focus on the development of unconventional natural gas reservoirs within the United States. Established in 1929 and headquartered in Houston, Texas, the company has a significant operational footprint in the Appalachian Basin, which is home to some of the most prolific natural gas fields in North America, including the Marcellus and Utica shales. Southwestern Energy engages in the exploration, development, and production of natural gas, natural gas liquids (NGLs), and oil, striving to enhance shareholder value through strategic investments and efficient operational practices. The company employs advanced drilling and completion technologies to optimize resource extraction and improve recovery rates while emphasizing environmental stewardship and safety. SWN's strategic position within the energy sector is also marked by its emphasis on sustainability and reducing carbon intensity in its operations. Southwestern Energy's financial performance, resource management, and growth strategies are closely watched by investors and industry analysts, as the company plays a significant role in meeting the energy demands of the domestic market.
| Full Time Employees | 1,118 | Previous Close | 6.41 | Day Low | 6.29 |
|---|---|---|---|---|---|
| Day High | 6.45 | Five Year Avg Dividend Yield | 2.35% | Beta | 1.182 |
| Trailing PE | 1.377 | Forward PE | 7.135 | Volume | 18,929,287 |
| Average Volume | 20,653,906 | Average Volume 10 Days | 35,273,130 | Bid | 6.35 |
| Ask | 6.36 | Bid Size | 45,100 | Ask Size | 28,000 |
| Market Cap | 6,994,270,720 | Fifty Two Week Low | 4.57 | Fifty Two Week High | 7.69 |
| Price to Sales Trailing 12 Months | 0.852 | Fifty Day Average | 6.571 | Two Hundred Day Average | 6.1182 |
| Enterprise Value | 11,307,294,720 | Profit Margins | 62.314% | Float Shares | 1,093,584,994 |
| Shares Outstanding | 1,101,459,968 | Shares Short | 30,578,114 | Shares Short Prior Month | 40,247,902 |
| Shares Percent Shares Out | 2.78% | Held Percent Insiders | 0.602% | Held Percent Institutions | 90.278% |
| Short Ratio | 1.83 | Short Percent of Float | 3.13% | Book Value | 5.936 |
| Price to Book | 1.07 | Last Fiscal Year End | 2022-12-31 | Next Fiscal Year End | 2023-12-31 |
| Most Recent Quarter | 2022-09-30 | Net Income to Common | 5,116,000,256 | Trailing EPS | 4.61 |
| Forward EPS | 0.89 | Total Cash | 26,000,000 | Total Cash Per Share | 0.024 |
| Total Debt | 4,273,999,872 | Earnings Quarterly Growth | -90% | Revenue Quarterly Growth | -68.2% |
| Gross Margins | 46.297% | EBITDA Margins | 80.621% | Operating Margins | 6.93% |
| Total Revenue | 8,209,999,872 | Debt to Equity | 65.382 | Revenue Per Share | 7.457 |
| Return on Assets | 25.535% | Return on Equity | 128.688% | Free Cash Flow | -480,000,000 |
| Operating Cash Flow | 2,996,999,936 | Enterprise to Revenue | 1.377 | Enterprise to EBITDA | 1.708 |
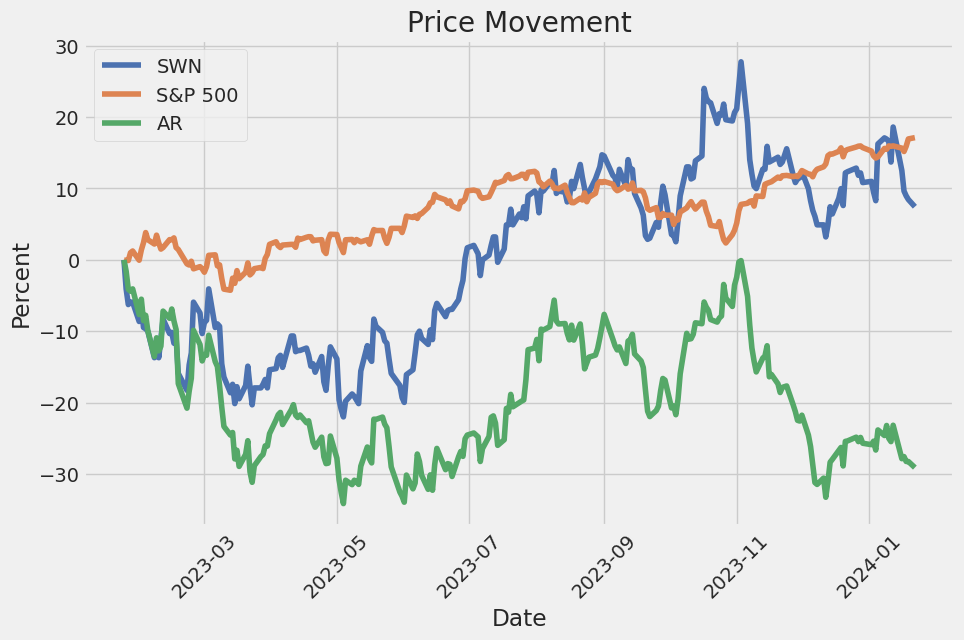
| 52 Week Change | 8.460% | S&P 52 Week Change | 20.399% | Last Dividend Value | 0.0075 |
| Sharpe Ratio | -10.279377768091672 | Sortino Ratio | -172.97535685758305 |
| Treynor Ratio | 0.12504942415435655 | Calmar Ratio | 0.3890336507270037 |
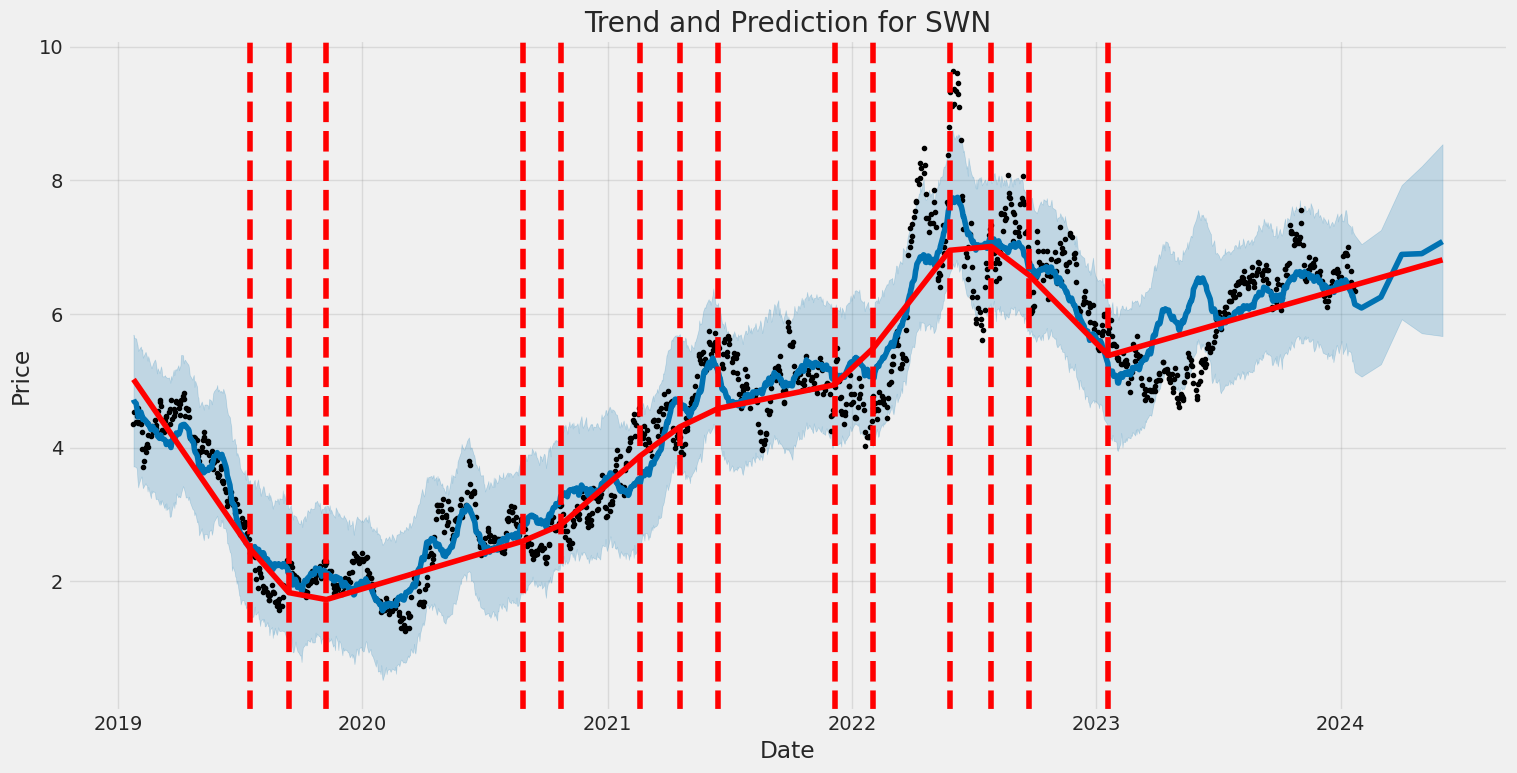
The assessment of SWN's stock trajectory over the next few months entails a detailed analysis of both technical indicators and fundamental analysis. Based on the provided financial data and the summary of technical indicators, a comprehensive understanding of the potential price movement can be drawn.
On the technical front, the observed moving average convergence divergence (MACD) histogram values are slipping into the negative terrain, suggesting a potential bearish momentum over the recent trading days. Paired with declining On-Balance Volume (OBV), there appears to be a pullback in buying pressure, perhaps indicating a bearish outlook in the short term. If these metrics continue on a negative trajectory, they could forecast a pronounced downtrend.
In the realm of fundamental analysis, the challenge presented by negative Sharpe and Sortino ratios should not be overlooked. The significantly negative values here indicate not just underperformance relative to the risk-free rate, but also a potential red flag regarding the volatility and downside risk of the asset.
However, more positive ratios such as Treynor and Calmar offer some offsetting sentiment, indicating that there may be some reward potential relative to the systemic risk the stock faces and an expectation that the downside might be manageable relative to the historical returns. This conflicting data speaks to a higher level of risk when making price movement predictions for SWN.
In juxtaposition with the technical indicators, a deeper dive into the analyst expectations shows that, on average, a positive sentiment is indicated with an anticipated earnings increase next year. Despite recent downgrades in analysts' estimates, the target still suggests growth. Furthermore, estimates for revenue growth in the next year also point to a potentially bullish future for SWN.
The thorough analysis of the risk-adjusted performance metrics, however, places a significant counterweight to this optimism, with three of the four (Sharpe, Sortino, and Calmar) indicating a riskier position. The extremely negative values of the Sharpe and Sortino ratios highlight that the stock's past performance has underperformed the risk-free rate by a wide margin when accounting for volatility and downside volatility, respectively.
Taking into account the balance sheets and earnings reports, there is observable financial growth with the upward trend in total revenue. Yet, this is contrasted by a concerning level of net debt and other financial obligations that must be considered when projecting future performance.
Finally, with an Altman Z-score above 1.5 but not significantly high, there might be some concerns about financial distress. While this classic bankruptcy prediction metric doesn't immediately suggest forthcoming bankruptcy, it does indicate that SWN is within a range where financial health should be monitored closely. The Piotroski Score at 6, out of a maximum of 9, indicates reasonable financial health, perhaps offering some reassurance to investors.
In conclusion, the forecasted stock price movement for SWN in the following months appears to be caught in a web of both negative and positive indicators. The technical analysis points towards a potential bearish trend, while fundamental insights present a mixed bag of growth prospects moderated by underlying financial risks. All considered, the stock may experience volatility and could potentially rally if the company manages to capitalize on growth opportunities and addresses the financial challenges at hand. Investors would be wise to continuously monitor both the technical charts and fundamental developments closely in the coming months.
| R-squared | 0.055 |
| Adjusted R-squared | 0.054 |
| F-statistic | 72.53 |
| Prob (F-statistic) | 4.64e-17 |
| Log-Likelihood | -3,499.4 |
| AIC | 7,003 |
| BIC | 7,013 |
| coef (const) | 0.0641 |
| coef (0) | 0.7165 |
| std err (const) | 0.111 |
| std err (0) | 0.084 |
| t (const) | 0.578 |
| t (0) | 8.517 |
| P>|t| (const) | 0.563 |
| P>|t| (0) | 0.000 |
| [0.025 (const)] | -0.153 |
| [0.975 (const)] | 0.282 |
| [0.025 (0)] | 0.551 |
| [0.975 (0)] | 0.882 |
| Omnibus | 194.644 |
| Prob(Omnibus) | 0.000 |
| Skew | 0.738 |
| Kurtosis | 6.261 |
| Durbin-Watson | 1.932 |
| Cond. No. | 1.32 |
The linear regression model analyzing the relationship between SWN (Southwestern Energy Company) and SPY (SPDR S&P 500 ETF Trust, a proxy for the market) highlights an alpha of 0.0641, representing the expected performance of SWN independent of the market. This alpha indicates that SWN is expected to slightly outperform the market when the market's performance is neutral (neither rising nor falling). However, the p-value for alpha is 0.563 which is not statistically significant, suggesting that the intercept (alpha) of this model may not be reliably different from zero, and therefore SWN's performance may not be confidently expected to deviate from the market baseline.
The relationship between SWN's returns and the market returns as represented by SPY is further detailed by the beta of the model, which is 0.7165. This beta value suggests that for every 1% increase in SPY, SWN is expected to increase by approximately 0.72%, assuming all other factors remain constant. The relatively low R-squared value of 0.055 indicates that only about 5.5% of the variability in SWN's returns can be explained by SPY's returns, which points to a weak correlation between these two entities. The adjusted R-squared is similar at 0.054, making minor adjustments for the number of predictors in the model.
Southwestern Energy Company's third-quarter 2023 earnings call was hosted by Brittany Raiford, Vice President of Investor Relations, who provided opening remarks and cautioned listeners about forward-looking statements. Joining Raiford were CEO Bill Way, COO Clay Carrell, CFO Carl Giesler, and Senior VP of Marketing & Transportation Dennis Price. During the call, Way expressed appreciation for his teams consistent delivery of priorities and improvements, and highlighted the company's continued practice of optimizing free cash flow and strategic capital investment. Southwestern Energy has improved its capital efficiency and is well-positioned to benefit from the growing demand for LNG, despite the decline in year-to-date rig counts, particularly in the Haynesville region.
Clay Carrell shared operational updates, including third-quarter production figures and details on the company's investment and wells sales. Carrell mentioned the record-long lateral well in Brooke County, West Virginia, and highlighted efficiency gains and moderating inflation impacts that contributed to lower-than-expected capital investment for the quarter. Looking ahead to 2024, he expressed optimism about service cost deflation while noting that the company is well on its way to securing development plans for the next year.
CFO Carl Giesler discussed financials, including a modest increase in free cash flow and the company's debt standing, which is expected to reach the higher end of the target range by late 2024 or early 2025. Giesler emphasized that debt reduction objectives are being supported by the company's hedging program, which helps in managing commodity risks while providing upward exposure. Southwestern Energy plans to maintain a balanced hedging range and continue to engage with commodity price protection strategies.
Several questions were addressed during the Q&A session of the call, touching on subjects such as the company's approach to hedging against 2025 and beyond, their strategy regarding lateral lengths in the Haynesville and Appalachia regions, well performance in particular areas, and capital allocation between liquid-rich and dry gas productions. The management team also discussed the company's potential role in M&A and reiterated its disciplined approach toward such opportunities. As the call concluded, Way expressed gratitude to the participants and looked forward to future discussions regarding the sustained value delivered by Southwestern Energy.
Southwestern Energy Company (SWN), in its SEC 10-Q filing, details various financial and operational activities for the period ending September 30, 2023. The company operates as an independent energy entity, engaged in the exploration, development, and production of natural gas, oil, and natural gas liquids (NGLs). Southwestern conducts operations primarily in areas known as Appalachia, encompassing Pennsylvania, West Virginia, and Ohio, as well as the Haynesville region in Louisiana. Its business is structured into two main segments: Exploration and Production (E&P) and Marketing.
The 10-Q filing shows operating revenues of approximately $1.4 billion for the quarter ended September 30, 2023, mainly from gas sales, oil sales, NGL sales, and marketing. Compared to the operating revenues of $4.5 billion for the same period in 2022, this represents a significant decrease attributable to factors such as changes in market conditions and product demand. Operating expenses stood at $545 million, including marketing purchases, with operating income being relatively nominal at $7 million, down from $2.4 billion in the third quarter of 2022. Interest expense on debt tallied to $61 million, and a gain of $93 million was recorded from derivative instruments.
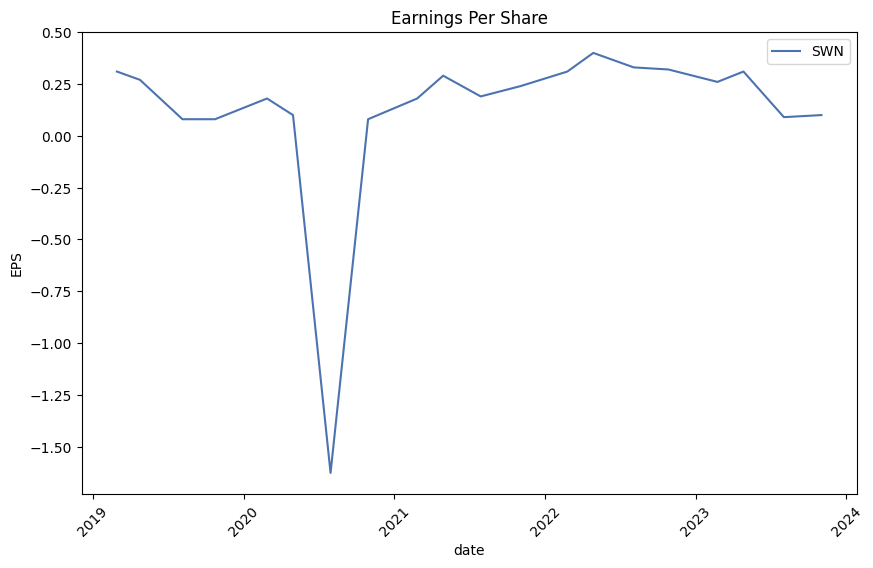
During the reported period, Southwestern realized a net income of $45 million, translating into earnings of $0.04 per basic and diluted common share, down from a net income of $450 million and earnings of $0.41 per basic share ($.40 diluted) in the comparable quarter of the prior year. The company has been actively managing financial risk by utilizing derivative financial instruments such as fixed price swaps, costless collars, and basis swaps.
The balance sheet data reflects that as of September 30, 2023, SWN had cash and cash equivalents of $26 million, with accounts receivable at $602 million. The total property and equipment, net, stood at approximately $11.5 billion. The total liabilities recorded were approximately $6.4 billion inclusive of current liabilities, long-term debt, operating lease liabilities, derivative liabilities, and other long-term liabilities.
For the nine months ending September 30, 2023, net cash provided by operating activities was $2 billion, while the net cash used in investing activities was $1.7 billion primarily due to capital investments. The cash flow statement also reveals net cash used in financing activities was $353 million, driven by payments on long-term debt and borrowings under the company's revolving credit facility.
The filing also discusses commitments and contingencies, including legal proceedings, and provides details on the company's accounting policies and segment information.
It is noteworthy that the company's financial statements did not show any signs of impairment regarding the ceiling test on their oil and gas properties, despite acknowledging the potential based on fluctuations in commodity prices. Southwestern Energy's management actively monitors credit risks and uses derivative financial instruments to manage the uncertainties of fluctuating commodity prices and to protect its cash flow predictability. The fair values of the derivative assets and liabilities are determined by using market-based inputs including pricing models, volatility factors, and credit risk adjustments.
This summary does not cover all details present in the 10-Q report but highlights significant financial statements, risk management strategies, and projections for the covered period. It is also noted that certain financial measures and strategies discussed in this summary, such as the share repurchase program and the deconsolidation of specific financial instruments, may be subject to change based on market conditions and management decisions.
In a pivotal move in the energy sector, Chesapeake Energy has announced an all-stock merger with Southwestern Energy, as reported by Ty Roush for Forbes on January 11, 2024. Valued at $7.4 billion, this transaction marks a significant expansion for Chesapeake, posturing it to become the largest natural gas producer in the United States, both in market value and output, overtaking EQT Corp.
According to the terms of the deal, Chesapeake is set to purchase Southwestern at a rate of $6.69 per share, where Southwestern's shareholders will obtain 0.086 shares of Chesapeake stock for each share they own at the deals closure. This merger will notably enhance Chesapeakes daily production by adding 7.9 billion cubic feet equivalent from Southwesterns production assets in the shale formations of Appalachia and the Haynesville basin in Louisiana.
As stipulated, the consummation of the merger rests upon regulatory clearances and approval from the shareholders of both companies. Post-merger, Chesapeake and Southwestern shareholders are projected to own roughly 60% and 40% of the combined entity, respectively. Shareholder response to the news resulted in a slight decline in Southwestern shares by 1.89% to $6.89 in premarket trading, while Chesapeake's shares experienced a jump of 2.82% to $77.18.
This landmark merger follows Chesapeake's emergence from bankruptcy in 2020 and reflects its strategic efforts of consolidation within the natural gas sector. In 2021, Chesapeake made similar overtures by acquiring Vine Energy for $1.1 billion and Chief E&D for $2.6 billion. The deal heavily suggests a trend where energy companies are increasingly resorting to acquisitions to augment their market presence and resources.
The Chesapeake-Southwestern merger epitomizes the strategic realignments within the energy sector and highlights the industry's prioritization of natural gas as a key component of the energy mix. With regulatory and shareholder consent, the new conglomerate is positioned to yield significant alterations to the competitive dynamics and output of natural gas within the United States.
The energy sector has seen considerable dynamism, with companies swiftly adapting to market demands and geopolitical shifts. The implications of this potential merger span various dimensions including consumer prices, infrastructure resiliency, and market volatility.
From a consumer perspective, concerns naturally tend to orbit around the potential impact on prices. However, the robustness of the existing system, coupled with full stocks and readily available storage, signifies that demand is likely to be met barring significant events.
The energy market is changing with the increase of liquefied natural gas (LNG) exports. As the United States approaches a doubling of its LNG export capacity, it will soon impact global volatility in unprecedented ways.
In a recent surge in Southwestern Energy Company's (SWN) stock, shares experienced a significant 7.3% rise in the last trading session, closing at $6.87 according to Zacks Equity Research on January 8, 2024. The increased trading activity and rise in share prices may be linked to rumors of a potential merger with Chesapeake Energy. The combined gas production from Southwestern Energy, which is around 4 billion cubic feet per day, and Chesapeake's 3.4 billion cubic feet per day, indicates the potential for a major market player upon successful merger completion.
Looking ahead, Southwestern Energy is projected to report quarterly earnings of $0.14 per share, marking a decrease of 46.2% from the previous year. Revenue forecasts for the same quarter are set at $1.53 billion, which would be a 54.8% decline from the year-ago quarter. Notably, the consensus EPS estimate for Southwestern Energy has been revised downward by 5.1% within the last month.
At present, Southwestern Energy holds a Zacks Rank of #3 (Hold), indicating a neutral stance on the stock with neither a strong buy nor strong sell recommendation. This rank is part of the Zacks Rank system, designed to guide investment decisions through a proprietary model.
For further context within the industry, another competitor, EQT Corporation (EQT), also experienced gains, closing 1.3% higher at $38.71 in the last trading session. Over the past month, EQT shares have gained 3.3%. The consensus estimate for EQT's earnings per share has been adjusted by -4.4% over the past month to $0.50, which would be an increase of 19.1% over the company's year-ago earnings per share.
Both EQT Corporation and Southwestern Energy find themselves in the dynamic landscape of the Oil and Gas - Exploration and Production - United States industry, facing similar market challenges and opportunities. Investors keen on this sector would be wise to consider the latest financial forecasts, merger and acquisition activities, and Zacks Rank indicators when making investment decisions.
A landmark merger between Chesapeake Energy and Southwestern Energy is set to transform the landscape of the natural gas sector in the United States. Chesapeake Energy announced its intention to merge with Southwestern Energy in an all-stock transaction valued at approximately $7.4 billion. This fusion is projected to catapult the merged entity into a leading position within the industry, surpassing EQT to become the largest natural gas-focused producer within the nation, with a combined market capitalization of an impressive $17 billion.
The synergy resulting from this merger presents a highly appealing narrative for investors due to the scale and influence the new entity will hold. However, the exceptional promise of this new partnership does not come without its own set of challenges and risks. The immensity and potential impact of the merger create an investment story that may attract scrutiny and could pose integration hurdles for the combined company.
The proposed merger is likely to draw the attention of regulatory authorities and may face stringent antitrust evaluations before receiving approval. Additionally, the success of the integration process post-merger will be a critical determinant of the future prosperity and performance of the new company in the competitive natural gas market.
In an industry-shaping development, Chesapeake Energy Corporation (CHK) has initiated a significant move in the shale gas sector by acquiring Southwestern Energy Company (SWN) in an all-stock deal. The deal, valued at $11.5 billion, creates a giant within the natural gas production market, fostering a combined market capitalization of $17.4 billion as of the announcement date. This merger places the combined entity as one of the largest shale gas producers in the United States.
Analysts speculate that the most compelling aspect of Southwestern Energys portfolio for Chesapeake is its 286,000 net acres situated in the Haynesville region. The acquisition is timed to capitalize on the anticipated surge in the LNG sector, which is projected to expand its share of U.S. gas demand from 12% to 20% by 2030. This expansion could help narrow the gap between the lower domestic natural gas prices and the robust international market.
In conclusion, according to the advantageous terms of the dealincluding a modest 5% premium and the high-quality of Southwesterns acreagerender the acquisition a winning deal for Chesapeake. The company, which has faced challenges in the past, shows a clear intent to secure its growth trajectory and maintain its industry presence for years to come.
The recent transaction between Chesapeake Energy Corporation and Southwestern Energy Company has created a significant new player in the arena of natural gas exports. Wood Mackenzie analyst, Alex Beeker, highlights that the scale resulting from the Chesapeake-Southwestern merge will allow for a more comprehensive assessment by investors regarding spending and production trends, particularly in regions pivotal to gas exports.
The consolidation in the industry suggests a possible uptrend in natural-gas-focused mergers and acquisitions (M&A). Beeker points out that the deal might be a precursor to more activity within the natural gas sector, indicating that mergers and acquisitions activity could intensify, especially as the Haynesville play starts to see an M&A revival.
The energy sector has experienced a notable wave of consolidation, which recently impacted the gas industry significantly. A major highlight in this trend is the merger between Southwestern Energy and Chesapeake Energy, creating a seismic shift in the U.S. natural gas space.
This merger is a reflection of the ongoing consolidation in the energy industry, wherein companies are seeking to maximize efficiencies, reduce costs, and improve their market positions. By combining their resources, Chesapeake Energy and Southwestern Energy are aiming to create a more competitive and robust entity capable of negotiating the volatile landscape of the energy sector.
The significance of this merger for the gas sector represents the unification of two important players in the natural gas market. The deal stands as an indicator of how companies in the gas industry are adapting to both market pressures and opportunities. Mergers and acquisitions such as this one allow for a more integrated approach to operations, offering potential benefits of heightened efficiency and economies of scale.
Financially, the combined assets and capabilities of the merging companies suggest a strategic positioning that could provide a more resilient framework for navigating future challenges in the energy market. It also points to an intention to leverage synergies that can drive growth, improve profitability, and potentially provide better returns to shareholders in the long run.
For more insight into the implications on the gas sector, reference can be made to Kit Norton's full article on the Yahoo Finance website.
Southwestern Energy Company (SWN) experienced significant volatility between January 24, 2019, and January 22, 2024. The statistical model used to analyze the company's volatility shows that even though there was no overall average change in the returns during this period (because the mean model is a zero mean, indicating no long-term trend), the fluctuations in price were substantial, as indicated by the value of the omega coefficient (over 14). This is confirmed by the significant alpha[1] value, which shows a notable effect of past returns on current volatility, suggesting that returns were influenced by recent price movements rather than external trends or predictable patterns.
| Statistic Name | Statistic Value |
|---|---|
| Log-Likelihood | -3,523.45 |
| AIC | 7,050.89 |
| BIC | 7,061.16 |
| No. Observations | 1,256 |
| Df Residuals | 1,256 |
| Df Model | 0 |
| omega | 14.2668 |
| alpha[1] | 0.1250 |
Investing in the equity market is inevitably linked to financial risk, which is why assessing the potential volatility and future returns of Southwestern Energy Company (SWN) is vital before making a $10,000 investment over a one-year period.
The volatility modeling approach employed in this assessment provides a robust framework for understanding the fluctuation in the stock price of SWN. By fitting this model to historical price data, one can estimate conditional variances that help profile the dynamic nature of the market's volatility over time. This method is particularly well-suited to financial time series data, where volatility tends to cluster, meaning large changes in prices are often followed by more large changes (volatility clustering), and vice versa.
This volatility modeling is crucial for estimating the Value at Risk (VaR) for the investment. VaR is a widely used risk measure that estimates how much an investment might lose with a given probability, due to normal market fluctuations, over a specified time frame. By applying the volatility model to SWN's stock, we calculate the one-year VaR at a 95% confidence interval to be $396.89. This means there is a 95% probability that the $10,000 investment in SWN will not lose more than $396.89 in value over one year due to standard market movements.
On the other hand, machine learning predictions facilitate a deeper exploration, building upon the past volatility to forecast future returns. The application of an algorithm like the machine learning model in this scenario involves using historical data to train a model that can predict the direction and magnitude of future stock returns. It has particular value when incorporated with such volatility estimates, offering insights that are informed by complex, non-linear relationships in the data that human investors might overlook or be unable to process quickly.
Integrating volatility modeling with machine learning predictions yields a more comprehensive view of potential financial risks. While the former accurately captures the evolving risk profile due to market dynamics, the latter contributes a forward-looking perspective assessing how future returns might behave based on the patterns learned from historical data. The interaction of these two methods can provide investors with a nuanced understanding of the investment's risk and return characteristics.
Indeed, the calculated VaR gives important information, reflecting the maximum expected loss due to normal market conditions with a high degree of confidence. Yet, it is also essential to note that this metric does not account for extreme market conditions or black swan events, which can cause losses that exceed the predicted bounds. Therefore, when relying on the calculated VaR and associated forecasts, investors should remain aware of the inherent limitations of these risk measures and consider maintaining a diversified portfolio to mitigate the risk of rare but impactful events.
Similar Companies in Oil & Gas E&P:
Antero Resources Corporation (AR), Chesapeake Energy Corporation (CHK), Report: EQT Corporation (EQT), EQT Corporation (EQT), Matador Resources Company (MTDR), Range Resources Corporation (RRC), Diamondback Energy, Inc. (FANG), EOG Resources, Inc. (EOG), Permian Resources Corporation (PR), Comstock Resources, Inc. (CRK), Coterra Energy Inc. (CTRA), SilverBow Resources, Inc. (SBOW), SM Energy Company (SM)
https://www.zacks.com/stock/news/2207064/chesapeake-southwestern-to-form-a-17b-natural-gas-giant
https://www.youtube.com/watch?v=TyBail9yITE
https://www.proactiveinvestors.com/companies/news/1038120?SNAPI
https://finance.yahoo.com/m/972e21f0-09e3-30d2-bd2b-391bbf357ada/blockbuster-natural-gas.html
https://finance.yahoo.com/m/69daec43-7452-3ef8-85ad-799660012dd2/chesapeake-and-southwestern.html
https://finance.yahoo.com/m/022f1b31-1c27-3d68-bc4e-ad01de78027d/the-chesapeake-southwestern.html
https://finance.yahoo.com/m/14831794-b8a1-3e71-981e-8c1ce5295e36/the-energy-industry.html
https://finance.yahoo.com/video/oil-prices-tick-iran-seizes-221744992.html
https://finance.yahoo.com/m/c1c1c611-0c08-34e8-8e82-bfd55c3b0b34/russian-war%2C-energy.html
https://finance.yahoo.com/video/oil-prices-spike-us-uk-151552538.html
https://www.sec.gov/Archives/edgar/data/7332/000000733223000040/swn-20230930.htm
Copyright © 2024 Tiny Computers (email@tinycomputers.io)
Report ID: JvaFE6
Cost: $0.77832
https://reports.tinycomputers.io/SWN/SWN-2024-01-22.html Home