Visa Inc. (ticker: V)
2024-02-10
 Visa Inc. (ticker: V) operates as one of the world's leading digital payments companies, facilitating transactions across its vast network that connects consumers, businesses, banks, and governments in over 200 countries and territories. The company's technological infrastructure allows it to process payments and provide related value-added services, ensuring secure, fast, and reliable transactions. Visa's business model primarily generates revenue through the processing of payment transactions on its network, where it charges fees based on the volume and value of the transactions processed. Over the years, Visa has expanded its offerings to include fraud prevention services, analytics, and various platforms for digital payments, reflecting the ongoing shift towards cashless transactions. Its strategic acquisitions and partnerships have further solidified its position in the global payments landscape. Despite facing regulatory scrutiny and competitive pressures, Visa's strong brand, extensive network, and continuous innovation drive its growth and resilience in the face of changing payment technologies and consumer behavior.
| City | San Francisco | State | CA | Zip | 94128-8999 |
|---|---|---|---|---|---|
| Country | United States | Phone | 650 432 3200 | Website | https://www.visa.com |
| Industry | Credit Services | Sector | Financial Services | Previous Close | 275.78 |
| Dividend Rate | 2.08 | Dividend Yield | 0.0075 | Market Cap | 566,471,426,048 |
| Volume | 4,617,665 | Average Volume | 5,873,486 | Beta | 0.974 |
| Trailing PE | 31.846773 | Forward PE | 24.747538 | Fifty Two Week Low | 208.76 |
| Fifty Two Week High | 279.99 | Price to Sales Trailing 12 Months | 16.98514 | Enterprise Value | 558,811,643,904 |
| Profit Margins | 0.53923 | Gross Margins | 0.97783995 | EBITDA Margins | 0.70228994 |
| Operating Margins | 0.69064003 | Shares Outstanding | 1,581,590,016 | Book Value | 18.993 |
| Price to Book | 14.554309 | Net Income to Common | 17,699,999,744 | Trailing EPS | 8.68 |
| Forward EPS | 11.17 | Total Revenue | 33,351,000,064 | Total Cash | 18,595,999,744 |
| Total Debt | 20,703,000,576 | Current Ratio | 1.446 | Return on Assets | 0.15878999 |
| Return on Equity | 0.46921003 | Revenue Per Share | 16.386 | Free Cash Flow | 15,171,125,248 |
| Statistic Name | Statistic Value | Statistic Name | Statistic Value |
| Sharpe Ratio | 1.1637801967401147 | Sortino Ratio | 17.820102409487692 |
| Treynor Ratio | 0.22050152265982287 | Calmar Ratio | 2.919308150434905 |
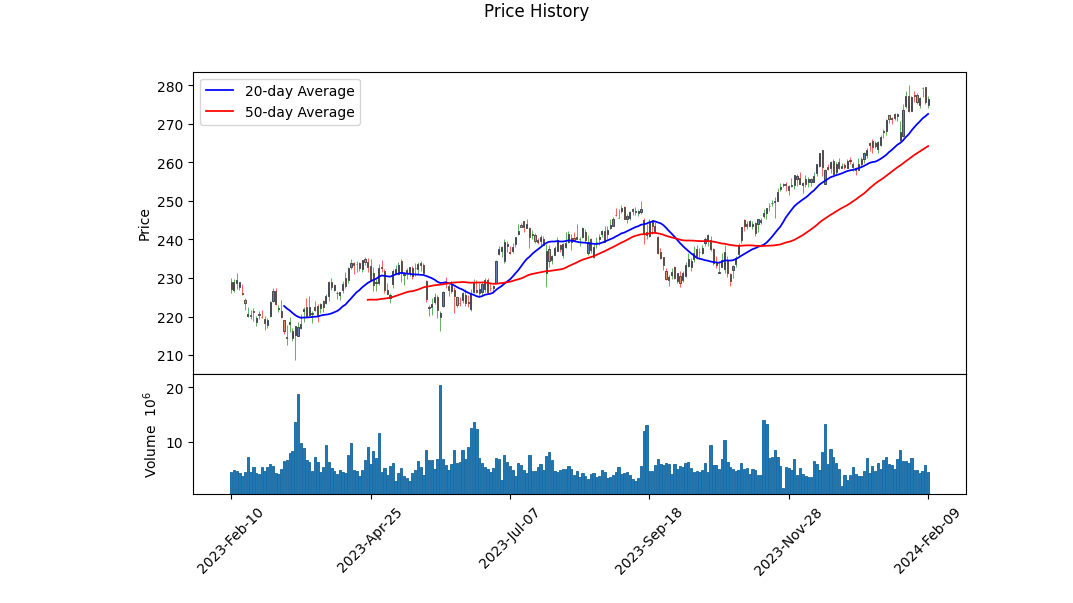
Evaluating the technical, fundamental, and financial health of a company requires a meticulous analysis of various data points. The recent technical analysis indicates a range of movements in the stock opening and closing prices, OBV (On Balance Volume), and MACD (Moving Average Convergence Divergence) histograms, demonstrating stock volatility and investor sentiment over the last few months. This volatility, combined with the absence of any MACD histogram values in the early data points, needs careful analysis as it could be an indicator of underlying changes in market dynamics or stock-specific news impacting investor behavior.
The fundamentals of a company, including its address, industry, financial performance, and ratios like gross margins, operating margins, and Peg ratio, provide significant insight into its operational health and profitability. A high gross margin ratio reflects strong revenue retention post-cost, and an EBITDA margin above indicates considerable operating profitability, signifying a robust core operation. These strong fundamentals are critical in supporting a bullish sentiment.
Risk-adjusted return ratios such as the Sharpe, Sortino, Treynor, and Calmar ratios give investors insight into the expected performance of an investment compared to its risk. The provided ratios paint a picture of favorable risk-adjusted returns over the past year, suggesting that the investment carries a reasonable expectation of returns when considering the inherent market risks.
The financials, including cash flows, balance sheet health, and analyst expectations, delineate a sound financial position. An increase in free cash flow, alongside a reduction in net debt, suggests efficient operations and a strong liquidity position. Analyst expectations for earnings and revenue growth further bolster confidence in the companys future performance. The positive outlook from analysts, reflecting anticipated growth, is supported by the recent trend of exceeding EPS expectations.
Given the solid fundamental backdrop, healthy balance sheets, strong cash flows, and optimistic analyst outlooks, the stock shows promising potential for growth in the coming months. However, it's vital to consider the stock's risk-adjusted returns, demonstrating a well-positioned investment when considering the associated risks. Thus, the expectation for the stock price movement in the next few months is cautiously optimistic but warrants continuous monitoring of market dynamics and company performance for any signs of deviation from expected trends.
In the comprehensive analysis of Visa Inc. (V), two pivotal financial ratios have been scrutinized: Return on Capital (ROC) and Earnings Yield. The ROC, standing at an impressive 30.256%, signifies the company's exceptional ability to convert its invested capital into profits. This high ROC indicates that Visa Inc. operates with a significant competitive advantage and efficiency, arguably making it a robust entity in its sector. On the other hand, the Earnings Yield is calculated to be 3.053%, which might seem modest when viewed in isolation but must be contextualized within the broader market condition and the nature of the business. The earnings yield offers an insight into the company's profitability relative to its share price, suggesting that investors are willing to pay a premium for Visa's consistent performance and potential for future growth. When these metrics are considered in the context of the principles outlined in "The Little Book That Still Beats the Market," Visa Inc. presents compelling attributes of profitability and efficiency, albeit with a note of caution on the price investors are currently willing to pay for its earnings.
| Statistic Name | Statistic Value |
| R-squared | 0.635 |
| Adj. R-squared | 0.635 |
| F-statistic | 2189 |
| Prob (F-statistic) | 1.80e-277 |
| Log-Likelihood | -1857.3 |
| AIC | 3719 |
| BIC | 3729 |
| Const Coef | 0.0039 |
| Beta | 1.0620 |
| Alpha | 0.0038591100817547607 |
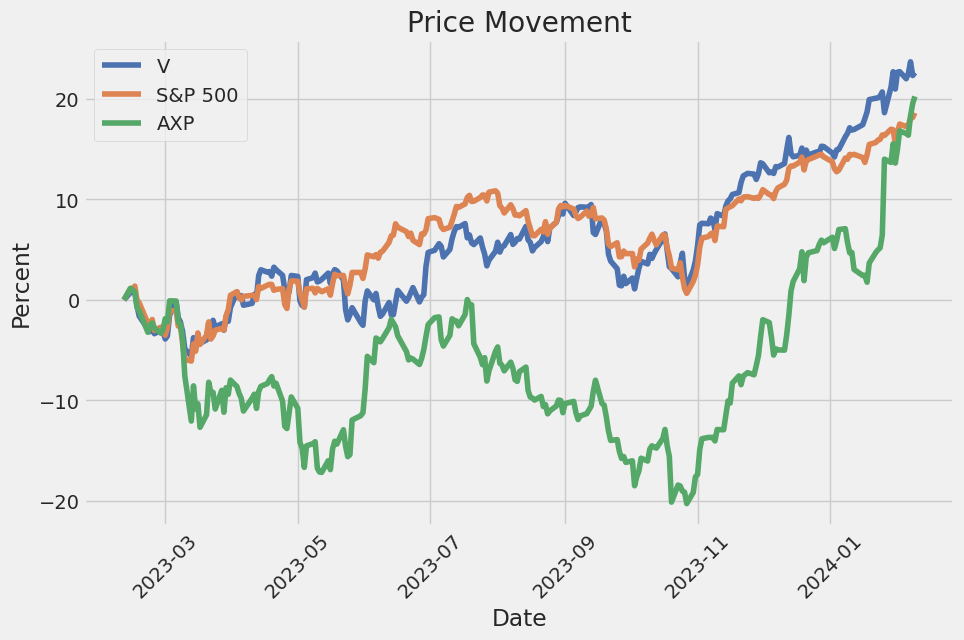
The linear regression model between V (Visa Inc.) and SPY (a proxy for the market as represented by the S&P 500 ETF Trust) over the observed time period demonstrates a significant relationship with a beta coefficient of 1.0620, indicating that for every 1% change in SPY, V is expected to change by approximately 1.0620% in the same direction, holding other factors constant. This suggests that Visa Inc.'s stock is slightly more volatile than the market. The R-squared value of 0.635 implies that about 63.5% of the variability in Visa's stock returns can be explained by the variability in the market returns as represented by SPY.
The alpha value of the model, which measures the return on the investment that is not explained by the general market movements, is approximately 0.0038591100817547607. This small positive alpha indicates that Visa Inc.'s stock has generated a slight excess return over what would be expected based on its beta and the market's overall performance, though the const coefficient's P value suggests that this alpha is not statistically significant at conventional levels. This might imply that while Visa is closely related to market movements, its individual performance, after accounting for market trends, offers a minimal additional return as per the recorded data up to February 2024.
Visa Inc. (V) reported a solid start to fiscal year 2024, demonstrating resilience in consumer spending and significant growth across various sectors. In the first quarter, Visa achieved an 8% growth in payments volume year-over-year, with U.S. payments volume growing by 5% and international payments volume by 11%. Notably, cross-border volume, excluding intra-Europe transactions, rose by 16% in constant dollars, with cross-border travel reaching 142% of 2019 levels. The company also observed a 9% increase in processed transactions, which contributed to a 9% rise in net revenues. GAAP earnings per share (EPS) were up by 20%, while non-GAAP EPS increased by 11%.
CEO Ryan McInerney highlighted Visa's continuous effort to deepen relationships with partners, which has been fundamental to the company's strategy. Visa's focus on customer service, innovative solutions, and brand amplification played a vital role in their performance. The company saw growth in credentials, acceptance locations, and engagement, with notable examples in Brazil with Caixa and in Asia-Pacific with Bcash. These efforts demonstrate Visa's local approach to expanding its global acceptance footprint. The company also renewed and established new partnerships across Europe, Asia, and the Americas, which included agreements with major banks, fintechs, and other financial institutions.
On new flows, Visa updated its market opportunity estimate to $200 trillion annually, excluding Russia and China. The company reported a 20% growth in Visa Direct transactions, reaching 2.2 billion this quarter. Partnerships in new use cases and verticals are expected to drive cross-border volumes. Visas focus on commercial and money movement solutions, including Visa Direct and commercial payments volume, grew by 8% in constant dollars. These initiatives are part of Visa's strategy to digitize payment flows across its network of networks.
Visa's value-added services played a significant role in its performance, with the company emphasizing its network of networks strategy. This approach involves moving money to all endpoints and form factors, using all available networks, and providing value-added services on all transactions. Recent examples include processing capabilities for RTP networks, the acquisition of a majority interest in Prosa, and a partnership with ServiceNow. These efforts highlight Visa's commitment to innovation, security, and providing enhanced digital experiences. Visa's ongoing strategy and partnerships, including its long-standing partnership with FIFA and a new sponsorship with Red Bull Formula One teams, are expected to drive business and brand engagement worldwide.
Visa Inc., a global payments technology company, reported its financial results for the quarter ended December 31, 2023, in its latest 10-Q filing. The company facilitates commerce worldwide through its advanced transaction processing network, VisaNet, and offers a range of products and services that enhance the speed, security, and reliability of money movement. For the first quarter of fiscal 2024, Visa reported a 9% increase in net revenues to $8.634 billion compared to $7.936 billion in the comparable period of the previous year. This growth is attributed primarily to increases in nominal cross-border volume, processed transactions, and nominal payments volume, although higher client incentives partially offset these gains.
Operating expenses for Visa during the quarter decreased by 6% to $2.680 billion due to lower litigation provisions, partially balanced by higher personnel expenses. Net income for the period saw a significant uptick, rising 17% to $4.890 billion from $4.179 billion in the prior-year quarter, reflecting the continued growth in its underlying business and the effective management of operational costs. Diluted earnings per share for the quarter increased by 20%, from $1.99 to $2.39, demonstrating an improvement in profitability.
A crucial strategic move during the quarter was the acquisition of Pismo Holdings, a global cloud-native issuer processing and core banking platform, for $1.0 billion in cash. This acquisition is part of Visa's ongoing efforts to expand its capabilities and offerings within the payments technology landscape.
Visa also continued its shareholder return program, repurchasing 15 million shares of its class A common stock in the open market for $3.6 billion. Alongside this, the company declared and paid $1.1 billion in dividends to its common and preferred stockholders during the quarter. Based on the report, Visa seems well-positioned to meet its short-term and long-term liquidity needs, with sufficient current and projected sources of liquidity.
Visa's effective income tax rate for the quarter was 19%, influenced by various factors including the reassessment of uncertain tax positions. This represents a slight increase from the 16% effective tax rate in the same period the previous year.
The financial results highlight Visa's strong position in the global payments industry and its ability to generate growth through both operational performance and strategic acquisitions. However, the company is also subject to market risks, including fluctuations in foreign currency exchange rates, which could impact future earnings. Visa's management asserts that their internal controls over financial reporting were effective as of the end of this reporting period.
Visa Inc. has firmly established itself as a linchpin in the global payments industry, demonstrating an impressive resilience and growth trajectory that appeals to a wide investor base. From facilitating billions of transactions across its expansive network to consistently enhancing shareholder value through dividends, Visas strategic positioning within the digital economy cannot be overstated. The narrative that unfolds around Visa Inc., as presented through various analyses and market insights, serves to underscore the companys robust financial health, strategic market dominance, and innovative drive that align it with future economic trends and consumer behaviors.
The burgeoning digital payments sector, accelerated by global shifts towards cashless transactions, plays into Visas operational strengths. The companys platform, responsible for a significant portion of global card-based purchase transactions, benefits from an ever-increasing shift towards electronic payments, showcasing its pivotal role in the financial ecosystem. This dominant market presence is further amplified by Visas strategic focus on expanding into new transaction flows and leveraging value-added services like risk management solutions to diversify its revenue streams and solidify its market position.
Visa's financial resilience and strategic market positioning have caught the attention of prominent investors and analysts, reinforcing its appeal in the investment community. Notably, its inclusion in Berkshire Hathaways portfolio highlights the enduring value seen in Visa, echoing Warren Buffetts investment principles that prioritize firms with strong competitive advantages and consistent dividend growth. This perspective is bolstered by the fact that Visa not only operates with high-profit margins but also consistently returns value to shareholders through dividends and share repurchases, emphasizing its commitment to financial health and shareholder returns.
In the context of stock market performance and investment strategies, Visas narrative is compelling. While the company trades at historically low multiples given its financial results and growth prospects, analysts see a promising buying opportunity, reflecting an optimistic outlook on Visas potential for sustained growth and profitability. This sentiment is shared across the board, with Visa being highlighted as a top dividend stock for 2024 due to its robust market capitalization, profitable business model, and significant position within the digital payment sector.
Furthermore, Visas strategic maneuvers, including partnerships with fintech companies and investments in security and payment efficiency technologies, position it well to capitalize on the growing digital transaction volume. These initiatives not only fortify Visas foundational strengths but also enable it to tap into new markets and customer segments, underlining the companys adaptability and foresight in navigating the evolving financial landscape.
In reviewing the diverse insights and analyses concerning Visa Inc., it becomes evident that the company embodies the rare blend of growth, stability, and innovation that makes it a compelling investment choice. Its significant role in facilitating global commerce, combined with a strategic vision that anticipates and shapes market trends, positions Visa favorably for future challenges and opportunities. As the digital payments revolution continues to unfold, Visas forward-looking strategies and solid market fundamentals render it a significant entity in investment portfolios aimed at long-term value creation and growth.
The volatility model for Visa Inc. (V) between February 11, 2019, and February 9, 2024, reveals some key features regarding its market behavior. Firstly, the ARCH model predicts fluctuations in Visa's returns are not explained by past returns, indicated by an R-squared of 0.000. Secondly, the model finds a substantial constant volatility component (omega) and a significant impact from the previous period's volatility (alpha[1]). Finally, the confidence intervals for 'omega' and 'alpha[1]' suggest a high degree of certainty about these estimates, reflecting considerable market uncertainty in Visa's returns during this period.
| Statistic Name | Statistic Value |
|---|---|
| R-squared | 0.000 |
| Log-Likelihood | -2361.75 |
| AIC | 4727.51 |
| BIC | 4737.78 |
| omega | 1.8607 |
| alpha[1] | 0.3635 |
| Covariance estimator: robust | |
Investing in the stock market involves a palpable level of uncertainty, with Visa Inc. (V) being no exception. To delineate the financial risk associated with a $10,000 investment in Visa over a one-year timeframe, a sophisticated approach employing both volatility modeling and machine learning predictions was adopted. This duality of methodologies allows for a nuanced understanding of potential investment outcomes, focusing not only on historical volatility but also on leveraging predictive analytics to forecast future returns.
The volatility modeling technique plays a pivotal role in unpacking the intrinsic volatility of Visa Inc.'s stock. By analyzing historical price fluctuations, this model is capable of providing detailed insights into the expected variability or risk associated with the stock. This is particularly important for understanding how past market events have shaped the stock's behavior, allowing investors to gauge the extent of future price fluctuations.
On the other hand, the technique of machine learning predictions employs a data-driven approach to forecast the future returns of Visa Inc. stock. By analyzing historical data sets, this model identifies patterns and relationships that may not be immediately apparent. The selected machine learning model is adept at handling the complexities and nonlinearities in stock price movements, making it a powerful tool for predicting future stock performance.
Integrating these two approaches offers a comprehensive view of both the historical volatility and prospective returns of Visa's stock. The calculated Annual Value at Risk (VaR) at a 95% confidence level stands at $148.55 for a $10,000 investment. This figure signifies that there is a 5% chance that the investment could lose more than $148.55 over the next year, providing a quantifiable measure of the investment risk.
This level of risk assessment is crucial for investors seeking to understand the potential downsides of their investment in Visa Inc. By leveraging volatility modeling, investors can gauge the stock's susceptibility to market shifts, while machine learning predictions offer a glimpse into potential future performance. The calculated VaR thus serves as a critical metric, encapsulating the essence of risk exploration in equity investment and highlighting the merit of combining volatility modeling with predictive analytics in managing investment risks.
Analyzing the extensive options chain data provided for Visa Inc. (V), it reveals multiple opportunities for potential profit across various strike prices and expiration dates. This analysis focuses on call options, considering factors such as delta, theta, vega, and implied volatility to determine options that present promising returns. Here's a synthesized outlook on the most profitable options considering these parameters, along with the importance of the Greeks in this context.
Delta and Trading Strategy
Delta values range significantly across the board, indicating various levels of sensitivity to the underlying stock price movement. Particularly, options with deltas closer to 1 (e.g., options with a 95 strike price expiring in January 2026 showing a delta of 0.993) suggest they are deep in the money and move almost on a 1:1 basis with the stock. These options, while less risky due to their high delta, also come with a higher premium cost. For a bullish forecast, these are optimal as they carry a smaller theta value, ensuring less time decay, especially over a long-term holding period.
Vega and Market Conditions
Vega values also present interesting insights. Higher vega values, found in longer-dated options (e.g., a 190 strike price option expiring in 2026 showing a vega of 86.0873), suggest these options are more sensitive to changes in implied volatility. Given a bullish view on the market, options with high vega could be profitable, especially if you anticipate an increase in volatility. These options will see a significant increase in premium if the market indeed swings upwards with heightened volatility.
Theta and Time Decay
Options with lower theta values are preferable for long-term strategies, as they decay less rapidly over time. An interesting find in the analysis is the options expiring in January 2026 with strike prices deeply in the money, such as the 185 strike with a notably low theta of -0.0139, suggesting resilience against time decay. This characteristic suits investors looking to minimize the erosive effects of time on option premiums, especially in bullish market conditions where the underlying stock is expected to rise steadily over time.
Rho and Interest Rate Impact
Considering rho in the current low-interest-rate environment, its impact might be subdued. However, for long-dated options, even small shifts in interest rates could lead to significant changes in option premiums. Options with higher rho values (e.g., a 185 strike expiring in 2026, showcasing a rho of 329.5685) indicate a higher sensitivity to interest rate changes, which could enhance profitability in scenarios of rising rates.
Conclusion
The analysis reveals that for investors with a bullish outlook and an expectation of increased market volatility, targeting long-dated, deep in-the-money call options (such as those with a 95 strike price expiring in January 2026) is strategically sound. These options not only offer a high delta, implying significant responsiveness to the underlying stock's upward movements, but also carry a beneficial vega profile, enhancing profitability in volatile conditions. Moreover, their lower theta values ensure that time decay does not substantially erode the premium, offering a buffering effect over the holding period.
While the higher initial premium may deter some investors, the overall risk-adjusted potential for profit, especially factoring in the current low-interest-rate environment (mitigated by the options rho characteristics), makes these options an attractive proposition for those betting on Visa Inc.'s upward trajectory over the next couple of years.
Similar Companies in Credit Services:
American Express Company (AXP), Report: PayPal Holdings, Inc. (PYPL), PayPal Holdings, Inc. (PYPL), Capital One Financial Corporation (COF), Upstart Holdings, Inc. (UPST), Mastercard Incorporated (MA), Ally Financial Inc. (ALLY), SoFi Technologies, Inc. (SOFI), Discover Financial Services (DFS), Square, Inc. (SQ), Fiserv, Inc. (FISV), Global Payments Inc. (GPN)
https://www.fool.com/investing/2023/12/29/dow-jones-bull-market-2-growth-stocks-to-buy-now/
https://www.fool.com/investing/2023/12/31/3-warren-buffett-dividend-growth-stocks-to-buy-now/
https://www.fool.com/investing/2024/01/01/forget-the-magnificent-seven-2024-fab-four/
https://seekingalpha.com/article/4660666-my-top-15-high-growth-dividend-stocks-for-january-2024
https://www.fool.com/investing/2024/01/04/1-no-brainer-warren-buffett-dividend-stock-to-buy/
https://seekingalpha.com/article/4660952-5-relatively-secure-cheap-dividend-stocks-january-2024
https://seekingalpha.com/article/4661540-my-top-3-stock-picks-2024
https://www.fool.com/investing/2024/01/07/3-berkshire-hathaway-stocks-to-buy-hand-over-fist/
https://seekingalpha.com/article/4661107-accumulation-vs-distribution-which-strategy-is-better
https://www.fool.com/investing/2024/01/08/these-3-stocks-could-be-worth-over-1-trillion-in-t/
https://www.fool.com/investing/2024/01/09/these-2-dow-stocks-are-set-to-soar-in-2024-and/
https://www.fool.com/investing/2024/01/12/visa-mastercard-or-american-express-buy-this-warre/
https://www.fool.com/investing/2024/01/12/2-berkshire-hathaway-stocks-to-buy-hand-over-fist/
https://www.fool.com/investing/2024/01/13/i-reveal-my-top-dividend-stock-to-buy-for-2024/
https://www.sec.gov/Archives/edgar/data/1403161/000140316124000016/v-20231231.htm
Copyright © 2024 Tiny Computers (email@tinycomputers.io)
Report ID: Tb1unC
Cost: $0.97956