Verizon Communications Inc. (ticker: VZ)
2024-01-23
 Verizon Communications Inc. (ticker: VZ) stands as one of the largest telecommunications companies in the United States, providing a wide range of services including wireless communications, broadband internet, and digital television. As a major player in the industry, Verizon has a significant customer base and operates a nationwide 4G LTE network, while actively expanding its 5G infrastructure to meet the increasing demand for high-speed internet and data services. The company's financial performance is often seen as a bellwether for the telecommunications sector, with revenues generated through both consumer and business segments. Verizon's strategic initiatives typically focus on enhancing network capabilities, innovating in the internet of things (IoT) space, and exploring new business opportunities to maintain its competitive edge. The corporation also places importance on corporate responsibility and sustainability, seeking to reduce its environmental impact while investing in community development. As of the report's knowledge cutoff date, Verizon's stock performance, dividend history, and operational strategies are closely monitored by investors and industry analysts as indicators of the company's stability and adaptability in a rapidly changing technological landscape.
| Address | 1095 Avenue of the Americas | City | New York | State | NY |
| Zip Code | 10036 | Country | United States | Phone | 212 395 1000 |
| Website | https://www.verizon.com | Industry | Telecom Services | Sector | Communication Services |
| Employees | 110,500 | Previous Close | 39.58 | Open | 41.07 |
| Day Low | 40.6 | Day High | 41.99 | Dividend Rate | 2.66 |
| Dividend Yield | 6.72% | Payout Ratio | 52.77% | Five Year Avg Dividend Yield | 5.15% |
| Beta | 0.383 | Trailing PE | 8.42 | Forward PE | 9.12 |
| Volume | 31,179,444 | Average Volume | 22,278,603 | Average Volume (10 days) | 22,880,470 |
| Market Cap | 175,962,603,520 | 52 Week Low | 30.14 | 52 Week High | 42.0 |
| Price to Sales (TTM) | 1.31 | Fifty Day Average | 37.8048 | Two Hundred Day Average | 35.6098 |
| Trailing Annual Dividend Rate | 2.623 | Trailing Annual Dividend Yield | 6.63% | Enterprise Value | 341,509,341,184 |
| Profit Margins | 15.58% | Shares Outstanding | 4,204,100,096 | Shares Short | 38,956,834 |
| Shares Percent Shares Out | 0.93% | Held Percent Insiders | 0.029% | Held Percent Institutions | 62.53% |
| Short Ratio | 1.81 | Short Percent of Float | 0.93% | Book Value | 23.249 |
| Price to Book | 1.80 | Net Income to Common | 20,896,000,000 | Trailing EPS | 4.97 |
| Forward EPS | 4.59 | Last Split Factor | 1000000:937889 | Last Split Date | 07/02/2010 |
| Enterprise to Revenue | 2.547 | Enterprise to EBITDA | 7.116 | Gross Margins | 58.69% |
| EBITDA Margins | 35.79% | Operating Margins | 23.53% | Return on Assets | 5.04% |
| Return on Equity | 22.74% | Revenue | 134,095,003,648 | Revenue Per Share | 31.867 |
| Current Price | 41.855 | Total Cash | 4,310,000,128 | Total Cash Per Share | 1.025 |
| Total Debt | 178,073,993,216 | Debt to Equity | 179.713 | Free Cashflow | 17,845,874,688 |
| Sharpe Ratio | -16.937123929284088 | Sortino Ratio | -277.9902327396738 |
| Treynor Ratio | 0.27088239738139674 | Calmar Ratio | 0.5088391487297838 |
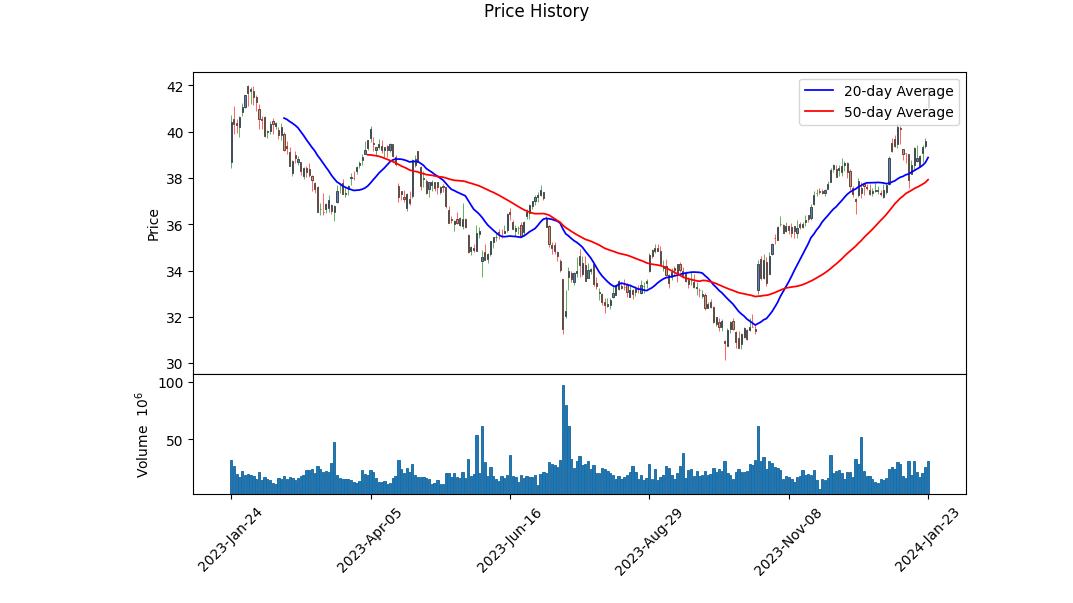
Verizon Communications Inc. (VZ) presents a multifactorial scenario, combining both fundamental and technical analysis perspectives. Upon reviewing the technical indicators for VZ, it's important to note that the On-Balance Volume (OBV) has shown a significant uptrend in recent months. This move suggests that the volume is supporting the rising price, which could indicate bullish sentiment. Looking at the MACD histogram, there's evidence that momentum could be turning positive with a recent crossover, suggesting potential for further gains.
The fundamental analysis paints a robust picture of the company's financial health. High gross margins imply the company holds a considerable pricing power over its cost of goods sold, while substantial EBITDA and operating margins indicate efficient operations and profitability. Nonetheless, the reported negative free cash flow and high net debt raise some concerns about the company's immediate liquidity and debt management. Analyst expectations, on the other hand, project a slight decline in earnings for the current year, which could be a dampening factor for the stock price appreciation in the short term.
The assessed risk-adjusted performance ratios cast a shadow over the recent performance, with negative Sharpe and Sortino ratios suggesting that the investment carries higher volatility than the average return justifies. Conversely, positive Treynor and Calmar ratios indicate reasonable returns when the investment's market-related risk and downside are considered.
Considering the blend of fundamental strength, encouraging technical signals, analyst projections, and a mixed bag of risk-adjusted return ratios, a cautiously optimistic approach would be appropriate for VZ in the upcoming months. The positive technical indicators could hint at a potential continuation of the upward trend. However, the negative free cash flow and the high levels of debt, coupled with the less-than-stellar earnings outlook, advise caution. Investors should also be mindful of the broader market conditions, as macroeconomic factors can significantly sway individual stock performance.
When prescribing investment outlooks, it's vital to factor in all the available data. For VZ, while technical indicators show promise, the fundamental and financial health of the company and the projected growth rates suggest that there may be limited upside potential. The stock might continue its upward trajectory in the short term, but the less favorable growth estimates and concern over cash flows and debt levels could temper gains. To navigate such nuanced outlooks, monitoring the stocks performance closely, staying alert to shifts in market sentiment, and observing changes in fundamental indicators would be prudent.
| Alpha | -0.02495550652780816 |
| Beta | 0.4548320387103653 |
| R-squared | 0.211 |
| Adj. R-squared | 0.210 |
| F-statistic | 335.4 |
| Prob (F-statistic) | 1.38e-66 |
| Log-Likelihood | -1,966.7 |
| No. Observations | 1,256 |
| AIC | 3,937 |
| BIC | 3,948 |
| Omnibus | 193.132 |
| Prob(Omnibus) | 0.000 |
| Jarque-Bera (JB) | 2,750.027 |
| Skew | 0.132 |
| Kurtosis | 10.244 |
| Cond. No. | 1.32 |
The linear regression model analyzing the relationship between VZ (Verizon Communications Inc.) and SPY (a proxy for the S&P 500 index) shows that VZ has a beta coefficient of approximately 0.455. This suggests that for every 1% change in SPY, we can expect VZ to change by about 0.455% in the same direction. However, the coefficient of determination, indicated by an R-squared value of 0.211, reveals that only around 21.1% of VZ's variability is explained by the movements in SPY. This highlights that while there is a positive association between VZ and the overall market, a significant portion of VZ's price movement is determined by factors independent of the market's performance.
Focusing on alpha, which captures the average return of VZ that is not explained by its relationship with SPY, the regression outputs an alpha of approximately -0.0250. Though statistically not significant (p > 0.05), this negative alpha implies that VZ has underperformed the expected return based on its beta with the market, suggesting that it hasn't added extra value over the time period studied relative to the market risk taken. Keep in mind that the actual investing implications of alpha should take into consideration other investment criteria, since alpha alone does not paint a complete picture of VZ's performance.
Summary of Verizon Communications Inc. Third Quarter 2023 Earnings Call
First Summary Paragraph: Verizon's third-quarter earnings call revealed solid growth and improving profitability, affirming the companys strategic direction. The company reported an increase in wireless service revenue by 3.9% year-on-year, driven by a focus on enhancing customer relationships. Adjusted EBITDA for the quarter was $12.2 billion, surpassing last years third quarter and sequential quarter figures. The year-to-date free cash flow at $14.6 billion has already outdone the previous full year, attributed to high-quality revenue growth, promotion strategy, cost efficiency, and reduced capital expenditure following significant investments in C-band and fiber.
Second Summary Paragraph: Verizon's CEO, Hans Vestberg, highlighted the companys financial fortitude, marked by debt reduction and balance sheet strengthening, which has led to a consistent dividend increase for shareholders. During Q3 2023, Verizon managed to pay down $2.6 billion in debt and continued its record-setting dividend increase for the 17th year. The company maintains a healthy dividend coverage, with a 56% free cash flow dividend payout ratio, signifying considerable improvement from the previous year. This financial discipline positions Verizon to end 2023 on a strong note, with revised guidance indicating higher free cash flow expectations for the year.
Third Summary Paragraph: Vestberg outlined the strategic progress within the business, emphasizing key growth areas such as mobility, broadband, and private networks. Consumer mobility improved both sequentially and year-over-year in postpaid phone net additions, achieved by prioritizing customer-centered solutions over aggressive promotions. The introduction of myPlan and its new tier, Ultimate Unlimited, has been influential in growing the premium mix and ARPA. In business mobility, Verizons Business Group sustained its growth trajectory with 151,000 phone net adds, signaling its ninth consecutive quarter surpassing 125,000 net adds. The company continues to optimize the balance between pricing and quantity to maintain profitable growth.
Fourth Summary Paragraph: The broadband segment showed consistent strength with over 400,000 new subscribers for the fourth consecutive quarter, ending Q3 with 10.3 million total subscribers - a substantial 21% increase from the previous year. The success was attributed mainly to the robust demand for fixed wireless access (FWA) and also noted an impressive 72,000 internet net adds for Fios. Verizon's investment in private networks is expanding incrementally, and while significant revenues from this segment are not expected immediately, they are anticipated to shape up by 2025. The company is leveraging the C-band spectrum, which is boosting performance and customer retention while solidifying broadband opportunities.
Closing Summary Statement:
Verizon is optimistic about maintaining its momentum and meeting its full-year financial targets, underpinned by strong wireless service revenue, EBITDA, and free cash flow growth. The company's network quality continues to win awards, and the completed C-band deployment is expected to further extend its market lead. Sustainable cost efficiencies are on track to meet Verizon's savings goal by 2025. Overall, the company is poised for a robust finish in 2023 and looks forward to capitalizing on its assets and executing its strategy effectively in 2024.
Verizon Communications Inc., a global provider of communications, technology, information, and entertainment products and services, filed its Form 10-Q for Q3 2023, detailing financial performance and company activities for the reporting period. The company reported operating revenues of $33.336 billion during the quarter, a slight decline from the previous year's $34.241 billion. The operating income stood at $7.473 billion compared to $7.894 billion for the same period the prior year.
The operating expenses for the period were $25.863 billion, showing a slight decrease from $26.347 billion last year, primarily driven by a reduction in the cost of wireless equipment and services. The cost of services remained relatively stable, indicating effective expense management. Depreciation and amortization expense increased marginally from $4.324 billion to $4.431 billion, signaling ongoing investments in network and technology improvements.
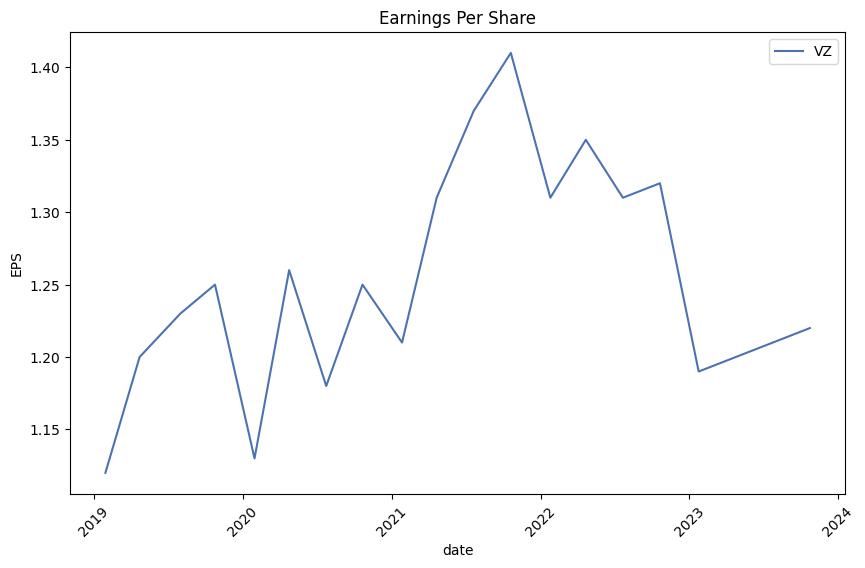
Net income for the quarter was $4.884 billion, slightly lower than the $5.024 billion reported in the previous year's comparable period. Earnings per share (EPS) for the quarter were $1.13 on a diluted basis, down a few cents from $1.17 in Q3 2022. This decline can be attributed to the noted dip in operating income and net income.
In terms of commercial activity, the company recorded a series of significant debt transactions during the quarter, including repaying, repurchasing, and issuing various debt securities. Verizon recorded debt extinguishment gains of $85 million in the third quarter. Net proceeds from various issuances of short-term and long-term debt, excluding finance leases, were reported, as the company continues to manage its leverage effectively.
The company's asset-backed debt carrying value was $21.0 billion as of September 30, 2023. Verizon's asset-backed debt includes transactions involving transferring device payment plan agreement receivables and other receivables to bankruptcy-remote entities issuing the debt. The debt is secured by the transferred receivables and future collections. The company continues to consolidate the assets, liabilities, and activities of these entities into its financial results.
The balance of cash and cash equivalents at the end of the quarter was $4.210 billion, a significant increase from $2.605 billion at the end of the previous fiscal year, providing the company with a robust liquidity position.
The company emphasizes its customer contract acquisition strategies and retention efforts via its device payment program and related trade-in promotions, which form a substantial part of its consumer revenue. Its allowance for credit losses and device payment plan agreement receivables are managed based on customer creditworthiness and tenure.
The filing disclosed that the company is in compliance with all debt covenants, ensuring continued financial stability. Additionally, Verizon's investments in strategic acquisitions and spectrum licenses suggest a focus on competitiveness in the telecommunications sector.
This summary is derived from Verizon's 10-Q filing dated September 30, 2023, and it excludes detailed financial schedules and notes but covers key financial performance metrics and strategic initiatives that reflect the company's current financial health and future outlook.
Verizon Communications Inc. (NYSE: VZ) is experiencing a notable period of transformation and resilience, as seen in various analyses by financial experts. Encouraging indicators point to a company steadily navigating the competitive telecommunication landscape and offering favorable prospects to investors, especially those focused on dividend income.
A crucial factor in Verizon's favor is its dividend yield which, at roughly 7%, positions it as an appealing choice for income-focused investment strategies. This figure is backed by the company's hardy financials, including a September 1.9% dividend raise and a free cash flow projection exceeding $18 billion for 2023. Not only does Verizon's dividend payout offer a high yield relative to the broader market, but also a consistency in growth, with a five-year dividend Compound Annual Growth Rate (CAGR) at 2.0%, aligning with federal inflation targets.
Verizon's strategic initiatives are equally noteworthy, particularly its robust efforts in 5G rollout and C-Band spectrum deployment. The One Fiber initiative and fixed wireless access development are pivotal components underpinning the company's growth strategy. These investments, while significant, have underscored Verizon's commitment to deliver enhanced connectivity and superior customer experiences across various markets.
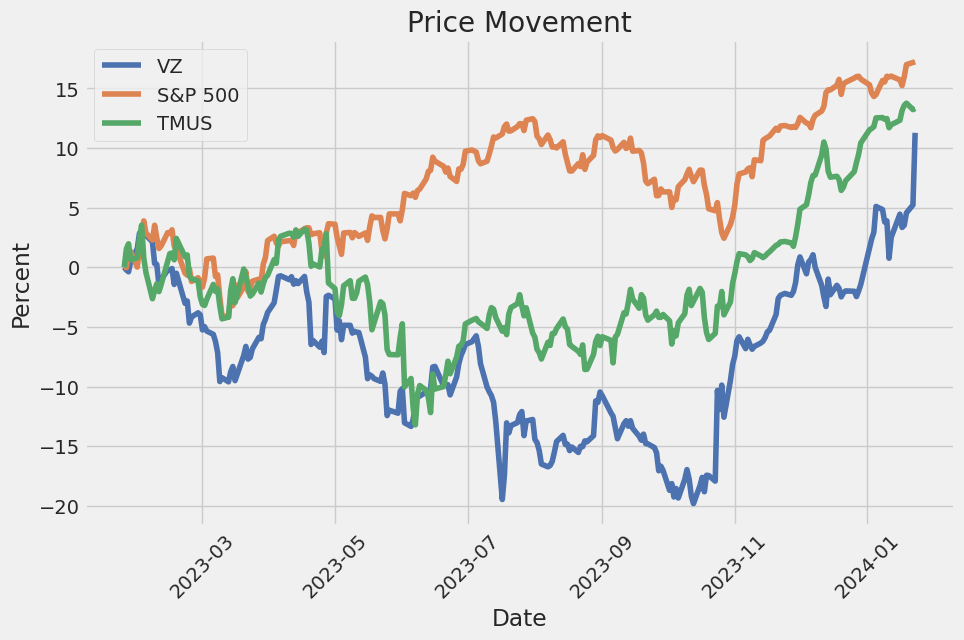
In terms of stock performance, Verizon saw a 17% increase as reflected in an article from Seeking Alpha published on December 14, 2023. This rise outperformed the S&P by 15 percentage points. An additional analysis highlighted a stock price that appears significantly undervalued, suggesting a potential 40% upside. Interestingly, despite these positive outlooks, another Seeking Alpha analysis from December 12, 2023, gives caution to the rapid technological evolution and competitive pressures facing the company, which necessitate ongoing capital investments.
From a broader stock market perspective, as reported by Zacks Equity Research, while Verizon shares have underperformed the S&P 500 composite, their most recent trajectory shows a positive shift. Nevertheless, the company's earnings per share (EPS) are expected to face declines in the near-term, and stock analysts' revisions reflect a somber outlook for the immediate future.
Operational strengths reflected in reports from Zacks Equity Research, such as net additions in the consumer postpaid phones segment, demonstrate Verizon's enduring appeal to customers. Additionally, its quarterly earnings have consistently beaten consensus EPS estimates, further emphasizing the company's reliability in delivering financial results.
Beyond telecommunications, Verizon is tapping into the potential of burgeoning markets such as the Electric Vehicle (EV) and the Internet of Things (IoT) industries, which present significant growth opportunities. This diversification aligns closely with the company's focus on robust network solutions and positions Verizon advantageously to capitalize on these trends.
Verizon has also invested considerably in fan experiences at sports venues, like the Bank of America Stadium, by deploying 5G technology, as reported on Zacks.com on December 15, 2023. Initiatives like the Express Entry facility illustrate Verizon's ambition to expand the practical footprint of its extensive network offerings, enhancing user experiences across different sectors.
Heading into 2024, if The Motley Fool's analysis from December 19 is considered, Verizon's roll in enabling technologies such as AI could become increasingly pivotal. Its high-quality network infrastructure positions the company to drive innovation and productivity for various business partners and sectors.
Despite some stumbling blocks, including market share losses to competitors like T-Mobile US and high debt levels, Verizon's recent maneuveringsincluding the reversal of customer losses in its consumer segmentindicate potential signs of a turnaround. Its efforts in network enhancements and spectrum acquisitions also hint at ingenuity in addressing current challenges.
As dividend stability becomes a key focus in turbulent economic times, Verizon's consistent payout growth and financial resilience suggest reliability, even with broader market uncertainties. This, combined with a below-industry-average Forward P/E ratio, emphasizes Verizon's potential as a financially grounded, high-yield investment option.
Considering the company's current market valuation, its compelling dividend yield, and strategic growth initiatives, Verizon presents an intriguing narrative for investors, balancing the short-term EPS dips with long-term investment propositions. The outlook across various financial analyses positions Verizon as a robust, yield-attractive stock option, underpinned by solid financial health and strategic initiatives aimed at market leadership, making it a company to watch as we move into 2024.
Over the specified period from January 2019 to January 2024, the volatility of Verizon Communications Inc. (VZ) was captured by a Zero Mean - ARCH model that indicates the inherent variability of the company's asset returns. The model suggests that fluctuations in Verizon's stock price showed a certain level of predictability based on past price movements, as indicated by the statistically significant coefficients in the volatility model. Key features of this volatility include a base level of variance denoted by omega, and a response factor to the previous time period's squared returns, denoted by alpha[1], both of which were found to be significant in affecting the volatility of Verizon's stock returns.
| Statistic Name | Statistic Value |
|---|---|
| Mean Model | Zero Mean |
| Vol Model | ARCH |
| Log-Likelihood | -2081.99 |
| AIC | 4167.99 |
| BIC | 4178.26 |
| No. Observations | 1,256 |
| Df Residuals | 1256 |
| omega | 1.2879 |
| alpha[1] | 0.2902 |
When assessing the financial risk of a $10,000 investment in Verizon Communications Inc. (VZ) over a one-year period, a multifaceted approach that uses both volatility modeling techniques and machine learning predictions can offer a nuanced perspective of the potential risks.
Volatility modeling is an essential tool in financial risk analysis. By capturing the temporal dynamics of the stock's return volatility, it allows for a detailed understanding of the degrees of variability that an investor might face. This model quantifies how Verizon's stock price movements oscillate over time, accounting for patterns such as volatility clusteringwhere large changes in stock prices tend to be followed by large changes (of either sign), and small changes tend to be followed by small changes. Using this method, one can anticipate not just average volatility but also its fluctuations, providing a more sophisticated risk profile.
The role of machine learning predictions is to incorporate historical data to forecast future stock returns. By analyzing complex data patterns, this approach enables predictions of future performance using a variety of input features. Specifically, the use of a machine learning model that employs decision trees in an ensemble approach allows for the capture of nonlinear relationships between input variables that may impact Verizon's stock returns, providing an advanced predictive power in stock price movement and thus furnishing an informed estimate of potential investment gains or losses.
Combining both approaches gives a comprehensive view of the investment risk. From the volatility modeling, one can estimate the expected level of fluctuation in the stock price, which when translated into financial terms, informs the investor about the possible variation in the value of a $10,000 investment. Meanwhile, the machine learning predictions can be used to generate a probable trajectory of future returns, taking into account intricate data relationships that volatility modeling alone may not uncover.
Using the volatility model, we can estimate a Value at Risk (VaR) at a 95% confidence interval. The calculated VaR for a $10,000 stake in Verizon is $242.78. This figure represents the maximum expected loss over a one-year horizon that should not be exceeded with a 95% level of confidence. In simpler terms, there is a 5% chance that the investment could lose more than $242.78 over the next year.
The integration of these intricate risk measurement and predictive techniques offers investors an advanced understanding of the financial risks associated with their investment in Verizon Communications Inc. The calculated VaR, which provides a numerical estimate of potential loss, serves as a critical indicator for investors when gauging their exposure and deciding on appropriate risk management strategies.
Similar Companies in Telecom Services:
T-Mobile US, Inc. (TMUS), Lumen Technologies, Inc. (LUMN), DISH Network Corporation (DISH), Report: Comcast Corporation (CMCSA), Comcast Corporation (CMCSA), AT&T Inc. (T), Charter Communications, Inc. (CHTR), Vodafone Group Public Limited Company (VOD), Altice USA, Inc. (ATUS)
https://seekingalpha.com/article/4657419-verizon-stock-time-to-load-up
https://seekingalpha.com/article/4657743-buy-verizon-for-its-7-percent-yield
https://seekingalpha.com/article/4658179-dividend-income-update-november-2023
https://seekingalpha.com/article/4658294-4-ideal-december-dividend-fortune500-industry-leaders-of-68
https://www.fool.com/investing/2023/12/18/should-you-buy-the-3-highest-paying-dividend-stock/
https://www.fool.com/investing/2023/12/19/is-verizon-an-excellent-dividend-stock-to-buy-for/
https://www.fool.com/investing/2023/12/19/new-years-resolution-artificial-intelligence-stock/
https://www.fool.com/investing/2023/12/19/got-1000-buy-these-3-magnificent-dividend-stocks-t/
https://www.zacks.com/stock/news/2200407/can-dogs-of-the-dow-etfs-snap-losing-trend-in-2024
https://www.sec.gov/Archives/edgar/data/732712/000073271223000063/vz-20230930.htm
Copyright © 2024 Tiny Computers (email@tinycomputers.io)
Report ID: PdN7Mm
Cost: $1.14474