Ally Financial Inc. (ticker: ALLY)
2024-02-10
 Ally Financial Inc., trading under the ticker ALLY, is a leading entity in the digital financial services sector, providing a broad range of financial products and services including auto financing, corporate financing, insurance, mortgages, and an array of online banking services for a diverse clientele that spans individuals, businesses, and automotive dealers. Originating from its roots as General Motors Acceptance Corporation (GMAC), established in 1919 to facilitate automotive loans, Ally has significantly transformed and expanded its service offerings to embrace a fully digital banking experience. With its corporate headquarters in Detroit, Michigan, Ally stands out in the highly competitive financial services landscape through its direct banking model, which eliminates the need for physical branches and allows for competitive rates and services tailored to meet the evolving needs of its customers. The company's strategic focus on technological innovation, customer service, and aggressive expansion into various financial services markets has positioned it as a noteworthy entity in the banking and financial sector, consistently seeking to enhance shareholder value and customer satisfaction.
| Address 1 | Ally Detroit Center | Address 2 | Floor 10 500 Woodward Avenue | City | Detroit |
|---|---|---|---|---|---|
| State | MI | Zip | 48226 | Country | United States |
| Phone | 866 710 4623 | Website | https://www.ally.com | Industry | Credit Services |
| Sector | Financial Services | Previous Close | 36.19 | Open | 36.18 |
| Day Low | 35.75 | Day High | 36.435 | Dividend Rate | 1.2 |
| Dividend Yield | 0.0333 | Payout Ratio | 40.15% | Five Year Avg Dividend Yield | 2.95 |
| Beta | 1.394 | Trailing PE | 12.070234 | Forward PE | 6.573771 |
| Volume | 2,630,190 | Market Cap | 10,945,988,608 | Fifty Two Week Low | 21.585 |
| Fifty Two Week High | 38.03 | Price To Sales Trailing 12 Months | 1.5403868 | Fifty Day Average | 34.069 |
| Two Hundred Day Average | 28.6874 | Trailing Annual Dividend Rate | 1.2 | Price To Book | 0.9540047 |
| Earnings Quarterly Growth | -72.7% | Net Income To Common | 912,000,000 | Trailing EPS | 2.99 |
| Forward EPS | 5.49 | Last Dividend Value | 0.3 | Total Cash | 6,944,999,936 |
| Total Debt | 20,867,000,320 | Total Revenue | 7,105,999,872 | Revenue Per Share | 23.394 |
| Return On Assets | 0.526% | Return On Equity | 7.677% | Earnings Growth | -81.1% |
| Revenue Growth | -12.8% | Operating Margins | 12.515% | Current Price | 36.09 |
| Statistic Name | Statistic Value | Statistic Name | Statistic Value |
| Sharpe Ratio | 0.4608884056802093 | Sortino Ratio | 7.687175497648674 |
| Treynor Ratio | 0.11069011600821783 | Calmar Ratio | 0.4793739387695252 |
Analyzing the provided data for ALLY reveals a multifaceted perspective grounded in both technical and fundamental analysis. The technical indicators over the observed period show a robust upward trajectory with opening prices rising from $24.84 to a closing price of $36.18. The increasing On-Balance Volume (OBV) supports the notion of a strong buyer-driven market. The negative MACD histogram values toward the end of the period indicate a possible slowing momentum, though not necessarily a reversal, which needs to be closely monitored.
The fundamentals and balance sheet data depict a company with significant financial activity and adjustments over the analyzed period. Notably, the earnings growth exhibits a decrease, and the revenue growth also shows a decrement. These factors could signal potential concerns but need to be contextualized within the broader strategic efforts of the company to adjust its operational efficiency and market positioning. The increase in net debt signals leveraged growth or potentially greater financial risk, an aspect that requires consideration in the context of its overall capital structure and market conditions.
The risk-adjusted performance metrics, including the Sharpe, Sortino, Treynor, and Calmar Ratios, provide a comprehensive view of the relative risk undertaken to achieve returns above the risk-free rate. The notable Sortino Ratio suggests that the company has been effective at yielding returns in excess of the downsize risk, a positive signal for risk-tolerant investors. Contrarily, the Sharpe Ratio, while still positive, indicates less compensation for every unit of total risk taken, highlighting the nuanced balance between risk and return.
The analysis of analyst expectations and earnings estimates reveal an optimistic outlook for the next year, with a significant expected increase in both earnings and revenue growth. This optimistic projection is supported by revisions in EPS estimates and growth expectations, particularly notable in the upgrade for the next year.
Considering the technical indicators, fundamental data, risk-adjusted performance metrics, and analyst expectations, ALLY appears positioned for continued growth albeit with caution due to the potential for slowing momentum as indicated by the MACD and the observed financing activities that may introduce additional risk. Investors are advised to monitor upcoming earnings reports and news related to the company's strategic initiatives closely. The projected increase in revenues and earnings should act as a catalyst for further price appreciation, yet the darker shades of financial metrics and market dynamics suggest a strategic approach towards investment in ALLY.
In our analysis of Ally Financial Inc. (ALLY), we have meticulously calculated two key financial metrics that are instrumental in evaluating the company's operational efficiency and its value proposition to investors, as outlined in the principles found in "The Little Book That Still Beats the Market." First, the Return on Capital (ROC) for Ally Financial stands at approximately 69.70%. This high ROC indicates that the company is highly efficient in generating profits from its capital, reflecting a commendable operational efficiency and a strategic allocation of financial resources. Secondly, Ally Financial's Earnings Yield has been calculated at 14.05%, signifying an attractive proposition for investors. Earnings yield, essentially the inverse of the price-to-earnings ratio, offers a measure of the earnings generated from each investment dollar. A higher yield, as in the case of Ally Financial, suggests that investors are poised to receive a greater return on their investment, making it a potentially lucrative option in the current market. These metrics collectively portray Ally Financial Inc. as a robust entity with efficient capital utilization and an enticing investment profile, warranting consideration in any investment portfolio looking for solid financial health and promising returns.
| Statistic Name | Statistic Value |
| R-squared | 0.434 |
| Adj. R-squared | 0.434 |
| F-statistic | 963.3 |
| Prob (F-statistic) | 1.87e-157 |
| Log-Likelihood | -2812.4 |
| No. Observations | 1258 |
| AIC | 5629. |
| BIC | 5639. |
| Alpha | -0.012620360112507983 |
| Beta | 1.5052070101686466 |
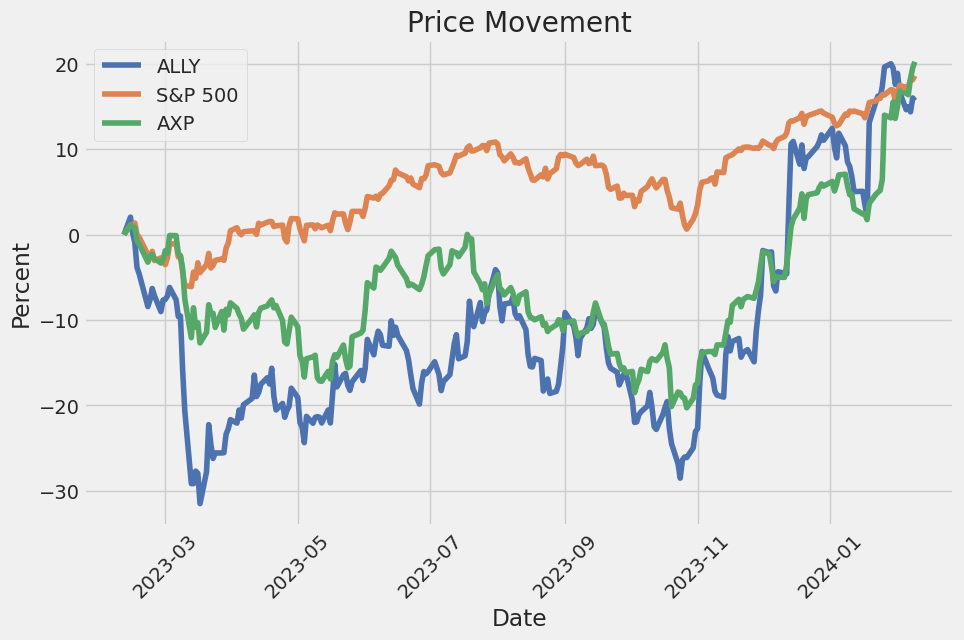
The linear regression model examining the relationship between ALLY (AllianceBernstein Holding L.P.) and SPY (SPDR S&P 500 ETF Trust) for the specified period reveals an intriguing dynamic between a specific financial security and the broader market index. The alpha value of -0.0126 suggests that ALLY underperforms the market by this margin when the market's return is zero. This negative alpha indicates a slight underperformance relative to the broad market as represented by SPY, independent of the market movement. Despite this, the positive beta value of 1.5052 indicates a strong positive correlation with the market; ALLY tends to outperform or underperform in line with the market, moving more than 1.5 times the market's movement in the same direction.
Moreover, the R-squared value of 0.434 signifies that approximately 43.4% of ALLY's price movements can be explained by movements in the SPY, highlighting a considerable but not complete link with broader market trends. The significant level of the F-statistic further supports the reliability of the model, emphasizing the strength of the relationship between ALLY and SPY during the observed period. Despite ALLY's slight underperformance as indicated by the negative alpha, its strong beta demonstrates its sensitivity to market movements, making it an interesting option for investors seeking to capitalize on market trends through individual securities.
Ally Financial Inc.'s fourth quarter and full-year 2023 earnings call, chaired by Head of Investor Relations, Sean Leary, hosted CEO Jeff Brown, CFO Russ Hutchinson, and introduced Interim CEO Doug Timmerman. The call underscored the company's steady performance amidst the challenging economic landscape and highlighted the strategic divestiture of Ally Lending to streamline focus on its core, high-return businesses. Jeff Brown proudly reflected on the nurtured company culture as a pivotal asset, crediting it for sustaining customer satisfaction and organizational achievements. Doug Timmerman's appointment as Interim CEO marks a seamless leadership transition, ensuring continuity in Ally's strategic pursuits and customer commitments.
Ally's financial results for the year included an adjusted EPS of $3.05, a core ROTCE of 11.5%, and total revenues of $8.2 billion, demonstrating resilience and strategic adaptability in a fluctuating market. The sale of Ally Lending was a notable strategic move, intended to sharpen focus on Allys primary auto and bank franchises, aiming for capital reallocation towards higher-returning ventures. This sale, along with other strategic portfolio optimizations like auto loan securitizations, underpins Ally's endeavors to enhance its core operational strengths and financial robustness. The companys performance in auto finance, bolstered by record consumer originations and insurance premiums, substantiates its competitive edge and operational scalability.
Delving into operational highlights, Ally's auto finance sector thrived with consumer originations totaling $40 billion, supported by a robust application influx and disciplined underwriting. The insurance segment too reached a new pinnacle with earned premiums of $1.3 billion. Ally Bank witnessed promising growth, amassing over 3 million customers with $142 billion in deposit balances, alongside the credit card business marking over 1.2 million active cardholders. These achievements illustrate Ally's effective customer engagement and product diversification strategy, reinforcing its market standing amidst economic tumults.
On future outlook and strategic realignments, CFO Russ Hutchinson provided an in-depth analysis of Ally's financial health, including net financing revenue, adjusted revenue growth projections, and the expected net interest margin (NIM) expansion. The company anticipates a constructive trajectory for fiscal year 2024, supported by a stable to improving credit performance, strategic asset mix optimization, and disciplined expense management. The outlook encapsulates Ally's strategic focus on capital optimization, asset quality vigilance, and maintaining operational agility to navigate impending economic uncertainties, echoing its commitment to sustainable growth and shareholder value maximization.
Ally Financial Inc. (ALLY) is a leading digital financial services company, as detailed in its SEC 10-Q filing for the period ending September 30, 2023. The financial report provides a comprehensive overview of Ally's financial condition, including updates on assets, liabilities, equity, revenue streams, and the company's strategic direction.
During the reported period, Ally demonstrated a diversified financial portfolio, underlining its operations across automotive finance, insurance operations, mortgage finance, and corporate finance segments. The company has strategically positioned itself to cater to a broad consumer base through various financial products and services, ranging from consumer auto loans to commercial lending and insurance products.
Revenue sources for Ally are extensively categorized under different segments. The automotive finance operations remain a significant contributor, showcasing sustained performance in retail auto sales and lending services. Insurance operations, though smaller in scale, complement the automotive financing segment by offering a suite of risk management products. Mortgage finances and corporate finances, although distinct business segments, demonstrate Ally's expansion into broader financial markets, diversifying its revenue streams beyond traditional automotive finance.
In terms of assets management, Ally reported a robust portfolio comprising various financial instruments, including U.S. Treasury securities, state and municipal obligations, and mortgage-backed securities. This diversification is part of Ally's broader risk management strategy, aiming to mitigate market volatility while ensuring steady returns. The detailed disclosures around asset categorization and performance provide transparency on the company's financial health and its strategic management of portfolio risks.
Furthermore, Ally's commitment to mitigating credit risk is evidenced by its stringent loan origination criteria and monitoring practices. The report delves into the performance of the loan portfolio, outlining the proportion of current loans versus those past due or under restructuring. Such insights are pivotal, offering stakeholders a clear view of the company's credit risk profile and operational efficiency in managing its loan portfolio.
The financial report also emphasizes Ally's adherence to regulatory requirements and accounting standards, particularly in the classification and measurement of financial instruments. This adherence ensures the accuracy and reliability of financial reporting, strengthening stakeholder confidence in the company's financial disclosures.
Overall, Ally Financial Inc.'s SEC 10-Q filing conveys a picture of a financially robust and strategically diversified company. Through its operational segments, Ally continues to leverage technology and innovative financial products to address the evolving needs of its customers. The detailed financial metrics, combined with strategic insights provided in the report, underscore Ally's strengths in managing a comprehensive financial services platform while navigating the complexities of the financial markets.
Ally Financial's strategic move to partner with the United States Golf Association (USGA) carries profound implications for the financial sector and beyond, particularly in the context of corporate sponsorships and community engagement. Announced on February 1, 2024, this partnership not only solidifies Ally's position as a frontrunner in promoting gender equity in sports but also heralds a significant shift in how companies approach partnerships with major sports institutions.
By becoming the official retail banking partner for the USGA, U.S. Open, and more notably, the U.S. Women's Open, Ally Financial is setting a new standard for corporate involvement in sports. The commitment, marked by a historic increase in the championship purse for the U.S. Women's Open to $12 million, symbolizes more than just financial investmentit represents a deep-rooted belief in the value of women's sports and an intention to address long-standing disparities in professional athletics.
The implications of Ally's strategy extend beyond the immediate realms of golf to paint a broader picture of evolving corporate responsibility and brand positioning. Ally's approach, characterized by visible support for gender parity and the cultivation of youth talent through the U.S. National Development Program, embodies a new era of corporate sponsorships where the focus shifts towards sustainable, impactful investments rather than mere brand visibility.
Ally's relationship with Lilia Vu and its active role in Team Ally further enhance this narrative, showcasing how collaborations between athletes and corporations can serve as powerful catalysts for social change and industry-wide evolution. By carefully choosing partnerships that align with core corporate values and societal needs, Ally leverages its platform not just for marketing, but for meaningful engagement with communities and stakeholders.
Moreover, Ally's involvement in the development and promotion of youth golf through financial backing shows a commitment to accessibility and diversity in sports. This initiative is particularly significant considering the historical elitism associated with golf, marking a paradigm shift towards inclusivity and democratization of the sport. Ally's role in fostering a more diverse generation of golfers mirrors broader trends in corporate America towards social responsibility and equity.
Financially, such strategic partnerships can also redefine ROI metrics for corporate sponsorships. Beyond conventional measures of brand exposure and direct returns, the impact on community engagement, brand loyalty, and long-term societal benefits become essential dimensions of success. Specifically, for Ally, this could enhance customer perceptions, bolster loyalty, and attract a broader customer base that values corporate ethos as much as the services provided.
As financial institutions navigate the complexities of modern consumer expectations and social responsibility, Ally Financial's partnership with the USGA stands as a beacon of strategic innovation. It exemplifies how aligning corporate resources with societal goals can create synergistic benefits, reinforcing brand values while contributing to meaningful societal progress.
This strategic move steers the conversation within the financial sector towards a future where corporate success is increasingly intertwined with social impact and equity, marking a holistic approach to business strategy that could inspire similar actions across various industries.
The volatility of Ally Financial Inc. (ALLY) as modeled by the ARCH process indicates a significant level of fluctuation in its asset returns, with the model suggesting an absence of a predictable pattern (indicated by an R-squared of 0.000). The estimated coefficient for 'omega', which signifies the baseline level of variance in asset returns, is notably high, at 5.2033. This implies a relatively substantial level of inherent volatility in the asset returns of ALLY, beyond the effects of recent price movements. The coefficient for 'alpha[1]', at 0.5288, indicates that recent returns do have a notable impact on future volatility, suggesting that larger changes in returns are likely to lead to higher future volatility.
| Statistic Name | Statistic Value |
|---|---|
| R-squared | 0.000 |
| Log-Likelihood | -3070.21 |
| AIC | 6144.41 |
| BIC | 6154.68 |
| omega | 5.2033 |
| alpha[1] | 0.5288 |
In assessing the financial risk associated with a $10,000 investment in Ally Financial Inc. (ALLY) over a one-year span, an innovative approach fuses volatility modeling with machine learning predictions. This methodology offers a robust framework for comprehending the potential fluctuations in the stock's price and forecasting its future returns, thereby providing an insightful perspective into the investment's risk profile.
Volatility modeling is a critical technique used to understand the variability in Ally Financial Inc.'s stock price over time. Specifically, this approach is adept at capturing and quantifying the dynamics of price fluctuations, considering the serial correlation and clustering of volatility, a common phenomenon in financial time series. By applying this method, it's possible to generate a refined estimate of the underlying volatility of Ally Financial Inc.'s stock, which is instrumental in evaluating the risk of the investment.
In conjunction with volatility modeling, machine learning predictions play a pivotal role in forecasting future stock returns. By leveraging historical data, these predictive models can discern patterns and relationships that are not immediately apparent. The machine learning approach used in this analysis involves training a model to understand the relationship between various market factors and the stock's past performance. From this, it can make informed predictions about the future returns of Ally Financial Inc.'s stock. The integration of these forecasts with the volatility estimates provides an enriched analysis of both the expected performance and the risk associated with the investment.
The results of this comprehensive analysis are encapsulated in the calculation of the Value at Risk (VaR) at a 95% confidence interval. VaR provides a quantifiable measure of the maximum expected loss over a certain period, offering a clear view of the potential downside risk. For a $10,000 investment in Ally Financial Inc., the annual VaR at a 95% confidence level is calculated to be $404.28. This figure represents the maximum expected loss over a year, underscoring the level of risk associated with this investment under normal market conditions.
By integrating volatility modeling with machine learning predictions, this analysis provides a sophisticated understanding of both the potential returns and risks tied to investing in Ally Financial Inc. The calculated VaR highlights the potential financial impact of adverse market movements, offering investors a granular view of what they might expect to lose in a worst-case scenario, thereby enabling a more informed investment decision.
Analyzing the options chain for Ally Financial Inc. (ALLY) with a focus on call options and aiming for a stock price target that is 5% over the current stock price, several factors must be considered, including the Greeks such as delta, gamma, vega, theta, and rho. These indicators provide insight into the sensitivity of option prices to various factors, such as the underlying asset's price, volatility, time decay, and interest rates.
Given a short-term target, options with a shorter time to expiration might seem appealing due to their lower premiums and higher sensitivity to the stock's price movements (as indicated by delta). However, these options also carry higher theta values, indicating a faster rate of time decay. Therefore, a balanced approach considering both the potential for profit and the risks involved is crucial.
A highly profitable option appears to have a strike of $15.0 with a 131-day expiration, showcasing delta values of 0.9881196298, indicating a strong response to the underlying stock's price movement. Furthermore, the return on investment (ROI) is significantly high at 0.8613414634, with a substantial profit of 10.5945. This option suggests substantial leverage with respect to the stock's price movement, combined with a relatively moderate premium, enhancing its appeal for those expecting a bullish move.
For a more conservative approach aiming at longer-term investments, the option with a strike of $15.0 and a 705-day expiration exhibits a delta of 0.9377056621. Even though its ROI is lower at 0.1128420398, the absolute profit potential is appealing at 1.8145. This option may be suited for traders with a longer-term bullish outlook on ALLY, providing a good balance between time decay and sensitivity to price movements.
Additionally, an intriguing middle-ground option has a strike of $18.0 with a 677-day expiration. It showcases a significant ROI of 0.8455009276 and a substantial profit of 9.1145, making it an attractive choice for traders looking for a blend of short-term gains and long-term investment potential. The delta value of 0.9401041124 for this option indicates a nearly 1-to-1 response to the underlying asset's price movement, positioning it as an attractive choice for a moderately bullish outlook over an extended period.
In summarizing, the most profitable options for Ally Financial Inc. (ALLY) take into account not just immediate profitability but also the strategic positioning for potential market movements. The options with strikes of $15.0 for 131 days and $18.0 for 677 days stand out for their high delta values and ROI, catering to both aggressive and more measured trading strategies. These options, by maximizing the leverage provided through the Greeks, especially delta and ROI, offer significant upside potential while also highlighting the importance of balancing factors such as time to expiry and the price volatility as reflected by vega. Investors and traders considering these options should weigh their risk tolerance and market outlook against these fundamental and technical indicators to optimize their trading strategy.
Similar Companies in Credit Services:
American Express Company (AXP), Mastercard Incorporated (MA), Visa Inc. (V), Report: PayPal Holdings, Inc. (PYPL), PayPal Holdings, Inc. (PYPL), Capital One Financial Corporation (COF), Discover Financial Services (DFS), Synchrony Financial (SYF-PA), The Western Union Company (WU), Bread Financial Holdings, Inc. (BFH), Synchrony Financial (SYF), Upstart Holdings, Inc. (UPST), Wells Fargo & Company (WFC), JPMorgan Chase & Co. (JPM), Report: Bank of America Corporation (BAC), Bank of America Corporation (BAC), Citigroup Inc. (C), PNC Financial Services Group, Inc. (PNC), U.S. Bancorp (USB), Truist Financial Corporation (TFC)
https://www.fool.com/investing/2024/01/01/is-ally-financial-stock-a-buy/
https://www.fool.com/investing/2024/01/03/2-things-the-smartest-investors-know-about-ally-fi/
https://www.fool.com/investing/2024/01/05/4-things-you-need-to-know-if-you-buy-ally-financia/
https://www.fool.com/investing/2024/01/09/why-ally-financial-stock-jumped-43-in-2023/
https://www.fool.com/investing/2024/01/10/heres-why-sofi-ally-financial-and-capital-one-stoc/
https://www.fool.com/investing/2024/01/12/2-incredibly-cheap-bank-stocks-to-buy-now/
https://www.fool.com/investing/2024/01/19/why-ally-stock-is-charging-higher-today/
https://www.fool.com/investing/2024/01/19/1-warren-buffett-dividend-stock-down-42-to-buy-in/
https://www.fool.com/investing/2024/01/28/is-ally-financial-stock-a-buy/
https://www.fool.com/investing/2024/01/28/1-warren-buffett-stock-i-plan-on-buying-hand-over/
https://seekingalpha.com/article/4665625-4-buyable-buffett-dividend-dogs-in-january
https://finance.yahoo.com/news/renaissancere-rnr-q4-earnings-beat-165500760.html
https://www.youtube.com/watch?v=Y6GnYZDNxVc
https://finance.yahoo.com/news/aflacs-afl-q4-earnings-miss-175500452.html
https://finance.yahoo.com/news/official-ally-financial-usga-ink-180000357.html
https://www.sec.gov/Archives/edgar/data/40729/000004072923000030/ally-20230930.htm
Copyright © 2024 Tiny Computers (email@tinycomputers.io)
Report ID: jawEp4
Cost: $1.01297
https://reports.tinycomputers.io/ALLY/ALLY-2024-02-10.html Home