Bank of America Corporation (ticker: BAC)
2024-01-27
 Bank of America Corporation (BAC) is a multinational banking and financial services company that stands as one of the largest and most recognizable institutions in the industry. With a rich history dating back to 1904, the company has undergone significant growth and transformation to become a leading player in the global financial landscape. As of the last evaluation, BAC provides a vast array of services including consumer banking, wealth management, corporate and investment banking, and trading across a broad range of asset classes. The corporation's extensive network comprises thousands of retail banking locations and ATMs, serving millions of consumers and businesses worldwide. Bank of America has a notable presence in the United States and extends to international markets, underscoring its status as a key pillar in the global financial system. The stock is a component of the S&P 500 Index and is actively traded on the New York Stock Exchange. BAC's performance is often viewed as an indicator of the overall health of the American economy and the banking sector due to the company's sizable footprint and diverse service offerings.
| Full Time Employees | 212,985 | Previous Close | 33.39 | Dividend Rate | 0.96 |
| Dividend Yield | 0.0287 | Payout Ratio | 0.2987 | Five Year Avg Dividend Yield | 2.37 |
| Beta | 1.42 | Trailing PE | 10.853896 | Forward PE | 10.579114 |
| Volume | 30,777,003 | Average Volume | 43,202,983 | Average Volume 10 days | 45,370,650 |
| Market Cap | 263,945,224,192 | Fifty Two Week Low | 24.96 | Fifty Two Week High | 37.00 |
| Trailing Annual Dividend Rate | 0.92 | Trailing Annual Dividend Yield | 0.02755316 | Price to Sales Trailing 12 months | 2.802353 |
| Net Income to Common | 24,866,000,896 | Trailing EPS | 3.08 | Forward EPS | 3.16 |
| Shares Outstanding | 7,895,459,840 | Book Value | 33.342 | Price to Book | 1.0026393 |
| Profit Margins | 0.28151 | Shares Percent Shares Out | 0.0088 | Held Percent Insiders | 0.00106 |
| Held Percent Institutions | 0.71155 | Total Cash | 938,719,969,280 | Total Cash Per Share | 118.894 |
| Total Debt | 661,620,981,760 | Total Revenue | 94,187,003,904 | Revenue Per Share | 11.731 |
| Return on Assets | 0.00851 | Return on Equity | 0.09388 | Operating Margins | 0.1498 |
| Sharpe Ratio | -15.534736157167693 | Sortino Ratio | -262.23338094827506 |
| Treynor Ratio | 0.001165027535094838 | Calmar Ratio | -0.07926884737990011 |
The evaluation of Bank of America Corporation (BAC) incorporates both a technical and fundamental analysis approach. The technical indicators, financial metrics, balance sheet strength, cash flow dynamics, analyst expectations, and profitability scores are all considered.
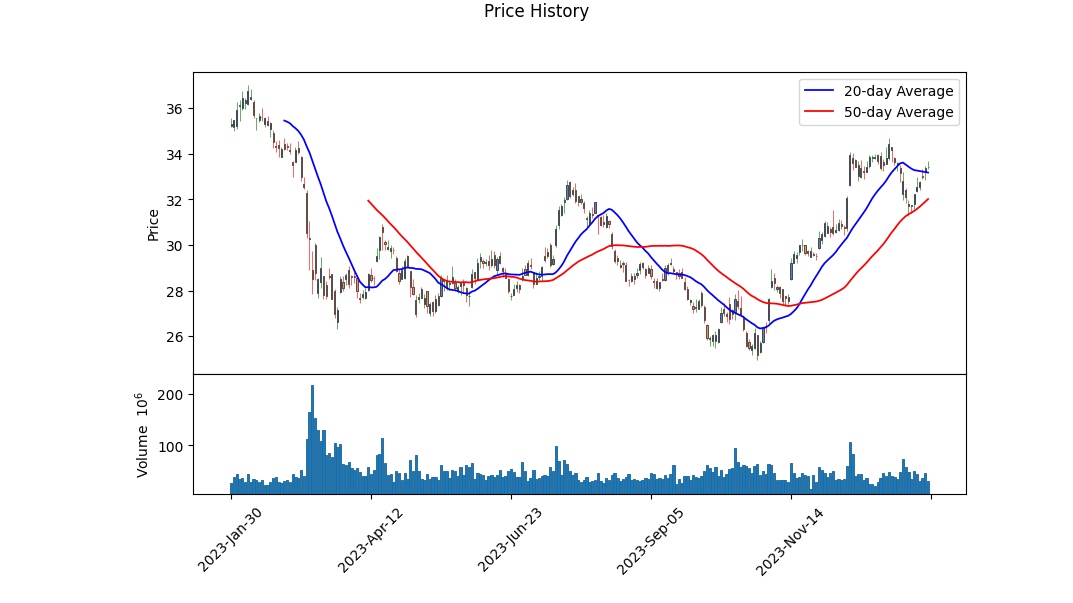
The stock has shown an appreciable upward movement in price, with the On-Balance Volume (OBV) indicator reflecting a positive trend in volume flow. This suggests that buying pressure has been consistent and could foreshadow continued bullish sentiment. The incremental improvement in the Moving Average Convergence Divergence (MACD) histogram also signals gaining momentum and the potential for a bullish trend to persist in the short intermediated term.
However, the fundamentals and ratios paint a more complex picture. The Sharpe, Sortino, Calmar, and Treynor ratios, all used for risk-adjusted performance assessment, are concerning. Particularly, the negative Sharpe and Sortino ratios indicate that the investment's additional return does not compensate for the risk taken, while the negative Calmar ratio suggests a less favorable reward per unit of downside risk.
Additionally, although BAC shows a robust operating margin and net interest income, the earnings and revenue growth rates are negative. In combination with an earnings decline reflected in the Piotroski score (6 out of 9), potential investors might find these numbers indicative of near-term financial challenges. Moreover, the Altman Z-Score of 0.48286122832243045 is trending below the zone of distress, highlighting a cause of concern regarding the credit strength of the company.
When it comes to balance sheet evaluation, BAC holds substantial tangible book value and common stock equity, indicating a firm footing in its assets over liabilities. The sizable net debt position, however, should be noted as a point of caution.
In terms of cash flows, negative free cash flow and substantial repayments of debt are indicative of a tighter liquidity scenario. Although there is significant issuance of debt, which may serve immediate liquidity needs, it could also signal reliance on external financing over generating cash internally which may not be sustainable in the long term.
Regarding analyst expectations, we can observe an anticipatory increase in revenues and earnings for the next year (2025), which could point to potential growth, reinforced by the estimated EPS revisions which have seen upward revisions in the last 30 days.
Considering this multifaceted assessment of BAC's technical and fundamental picture, the outlook suggests potential near-term growth given the strong volume and positive price momentum, yet warrants caution due to the underwhelming risk-adjusted return ratios and negative growth indicators. Market participants may expect periods of volatility and should monitor for catalysts such as earnings releases, economic indicators, and interest rate changes, which could significantly impact the performance of financial stocks like BAC. Analyst projections of improved performance lay a foundation for potential upside, but said projections must be tempered with an evaluation of ongoing operational and financial risks.
| Alpha | -0.0339 |
| Beta | 1.2412 |
| R-squared | 0.530 |
| Adj. R-squared | 0.530 |
| F-statistic | 1417 |
| Prob (F-statistic) | 3.82e-208 |
| Log-Likelihood | -2324.5 |
| AIC | 4653 |
| BIC | 4663 |
| No. Observations | 1257 |
| Df Residuals | 1255 |
| Std. Err. of coef. | 0.043 |
| t-statistic | 37.639 |
| P>|t| | 0.000 |
| 95% Conf. Interval Lower | 1.176 |
| 95% Conf. Interval Upper | 1.306 |
| Skew | 0.662 |
| Kurtosis | 8.026 |
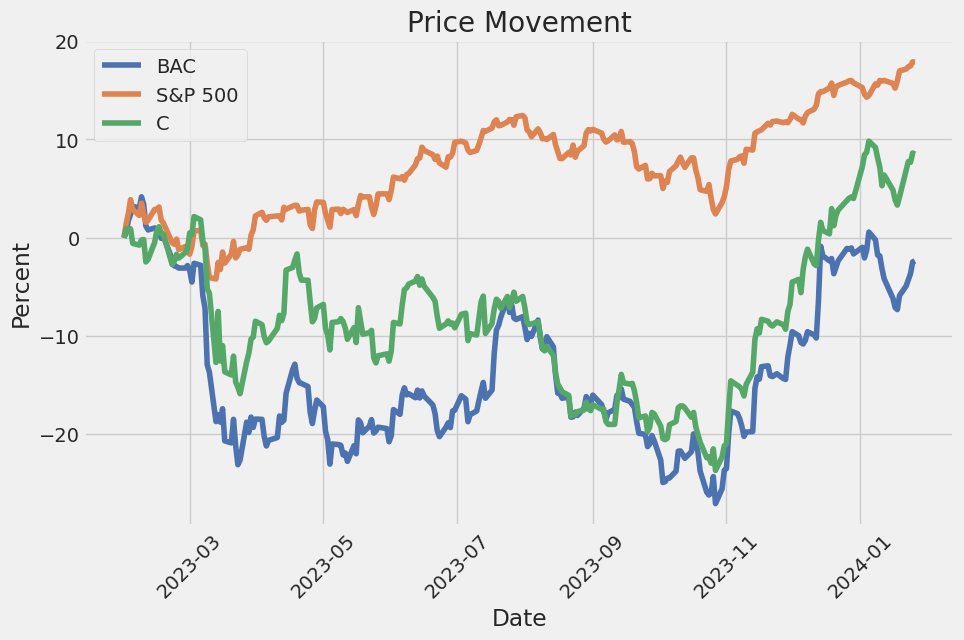
The linear regression model reveals the statistical relationship between BAC (Bank of America Corporation) and SPY (an ETF that represents the S&P 500, broadly considered to be a benchmark for the U.S. stock market). The alpha value in the model is -0.0339, which provides insight into the stocks performance that is independent of the markets movements. This negative alpha suggests that BAC has underperformed the broader market on average, regardless of market conditions.
Further diving into the model, with an R-squared value of 0.530, approximately 53% of the variability in BAC's returns is explained by the variation in SPY's returns. The beta coefficient of 1.2412 indicates that BAC is more volatile than the market: for every 1% change in the market, BAC's returns change by 1.2412%. This relationship has been strongly confirmed by the t-statistic of 37.639 and an essentially zero p-value, indicating that this finding is statistically significant and not due to random chance.
Bank of America Corporation Earnings Call Summary:
CEO Brian Moynihan:
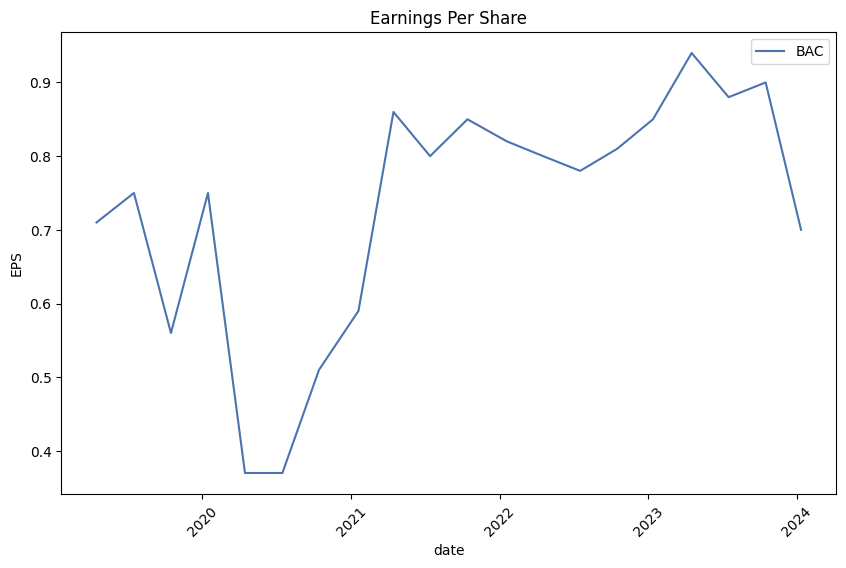
- Q4 reported EPS was $0.35, adjusted for notable items net income was $5.9 billion or $0.70 per share.
- Full-year 2023 results showed strong profits despite a challenging year with economic slowdown, geopolitical tensions, and rapid rate hikes. A mild recession was anticipated but the economy demonstrated resilience, led by US consumer spending.
- Consumer spending growth slowed to 4-5% in the quarter, aligned with a 2% GDP environment and lower inflation. Consumer deposit balances remained 30% above pre-pandemic levels, with higher-balance accounts moving excess funds to seek higher yields.
- Full-year net income was $29.3 billion adjusted, with $3.42 EPS, exhibiting responsible growth and a 15% return on tangible common equity. Revenue grew 5%, operating leverage was 170 basis points, and net charge-offs increased but remained historically low.
CFO Alastair Borthwick:
- Q4 highlights included a $3.1 billion net income, affected by a special FDIC assessment and an accounting impact from the BSBY cessation, with adjusted net income at $5.9 billion or $0.70 per share.
- The year-over-year revenue decreased due to lower NII, and expenses included FDIC charges. Adjusted expense was $15.6 billion and consistent with previous guidance.
- In Q4, deposits grew to $1.924 trillion, with growth seen in Global Banking and Wealth Management but a decline in consumer. The quality of deposits remains strong, and average deposits were 35% higher than Q4 of 2019.
- NII for the year was $57.5 billion, up 9% from 2022. They forecast NII to be slightly lower in Q1 and Q2 of 2024, then growing in the second half of the year.
- Credit quality remains strong though commercial net charge-offs increased due to a few known cases.
Detailed Results by Business Units:
- Consumer Banking: Earnings declined year-over-year with top-line revenue down 4% and expenses up 3%. Loans grew, deposits declined slightly, but client activity remained strong.
- Wealth Management: Earnings declined due to higher deposit costs, offsetting higher asset management fees. Solid client balance growth and investment flows were recorded.
- Global Banking: Earnings declined slightly as a drop in NII was offset by lower provision expense. Investment banking fees grew despite a sluggish environment.
- Global Markets: Experienced revenue growth leading to higher earnings. Sales and trading revenue grew to a new fourth-quarter record despite FICC being down and equities growing.
Conclusion:
- Bank of America managed its expenses effectively, with a strong capital base and asset quality, and is well-positioned to continue its organic growth into 2024. Despite a difficult year, the company maintained discipline and delivered profits for shareholders.
Bank of America Corporation (BAC), in its SEC 10-Q filing, provides an exhaustive disclosure of its financial activities and condition for a given quarter. As this is a structured financial document, the details are comprehensive and cover multiple aspects of the bank's operations. The following paragraphs aim to highlight the essentials from a 10-Q filing, which typically includes financial statements, notes to the financial statements, and management's discussion and analysis (MD&A).
The financial statements are a critical component, comprising balance sheets, income statements, and cash flow statements. They display the bank's financial position as of the quarter's end, revealing total assets, liabilities, and shareholders' equity. These statements also detail the bank's revenues, expenses, net income or loss for the quarter, and cash inflows and outflows from operating, investing, and financing activities.
In the notes to the financial statements, BAC would provide additional clarity on accounting policies, any recent changes in those policies, and the granularity on line items in the financial statements. For instance, the bank might elaborate on the valuation of its securities portfolio, loan loss provisions, and composition of different liabilities, among other specifics. This section is particularly crucial for understanding the context and nuances behind the numbers reported.
The MD&A section is where BAC's management imparts its interpretation of the financial results, offering a qualitative and forward-looking analysis. This section typically includes management's perspective on the factors driving the bank's performance, such as interest rate fluctuations, credit conditions, and market dynamics. It also highlights discussions of liquidity and capital resources, giving investors and analysts insight into how the bank is positioned to handle its financial needs.
Furthermore, the 10-Q usually contains information on the bank's performance ratios, like the return on equity (ROE) and return on assets (ROA), which are key indicators of financial health and efficiency. It also compares quarterly and year-to-date figures with previous periods to indicate trends.
Overall, Bank of America's 10-Q filing helps stakeholders gauge its short-term performance and financial resilience. It also delivers transparency around the bank's operations, guiding investors in making more informed decisions regarding their investment in BAC. The date of the 10-Q filing is not mentioned in the data provided, but it is typically filed several weeks after a quarter ends and can be found at the top of the actual 10-Q report when accessed.
In a recent report by Eric Volkman for The Motley Fool on December 14, 2023, the financial markets saw an uptick in banking stocks, with Bank of America Corporation witnessing a near 6% rise in share prices. This surge in the bank's stock price was in the wake of rating upgrades by Odeon Capital analyst Dick Bove, who moved his stance for several banks from hold to buy. Bove's optimistic outlook followed comments by Federal Reserve Chairman Jerome Powell suggesting a potential end to the period of aggressive interest rates hikes, sparking hopes of lower rates in the coming year. Consequently, such an environment may stimulate borrowing, potentially benefitting major lenders like Bank of America due to their large-scale lending operations.
The Motley Fool article also highlights a significant development in investments with the revelation that Berkshire Hathaway's equity portfolio, valued at $375 billion, is heavily weighted toward Bank of America and Apple. With Bank of America representing 9.3% of the portfolio and conferring a strong dividend yield of 2.8%, it's clear that the bank fits within Warren Buffett's investment philosophy that values strong, established businesses with growth potential and reliable dividends.
Further illustrating Bank of America's financial robustness, Speights from The Motley Fool categorizes it as one of the 'no-brainer' stocks to buy, especially in light of its apparent undervaluation and strong fundamental metrics. Notably, the bank shows resilience with a forward earnings multiple of 9.3 and a price-to-book ratio of 0.94, coupled with a strong balance sheet that has enabled it to sail through the rough waters of ongoing banking issues that have affected other institutions in the industry. Buffett's investment conglomerate, Berkshire Hathaway, has increased its holdings in the bank earlier in the year, which is a testament to its continued confidence in the bank's long-term prospects.
According to Zacks.com's December 15, 2023, report, Bank of America remains a key player in the banking sector, with shares notably soaring by 5.9% and closing at $33.94 on high trading volume. This upturn correlates with the Federal Reserve's unchanged interest rates and indications of potential cuts by the end of 2024. These reductions in funding costs are expected to have a favorable impact on net interest income and margin growth. Despite the anticipation for a decline in quarterly earnings per share and revenue, interest in Bank of America's stocks seems steadfast and reflective of the overall positive sentiment in the sector.
The relationship between Berkshire Hathaway and Bank of America is further solidified with Berkshire owning roughly 13% of BAC, as disclosed in a December 2023 report by Matthew Frankel for The Motley Fool. Despite a 10% net income growth year-over-year, Bank of America's effective return on equity and share price traded at 95% of its book value explains why Berkshire Hathaway has upheld its considerable investment in the bank.
On the other side of the coin, in contrast to a broader banking crisis that caused the decline of several large financial institutions, the Federal Reserve's dovish signals on interest rates provide hope for the industry. A Zacks.com article from December 2023 details how easing rates and projections of stronger economic growth for 2023 and an anticipated robust labor market bolster optimism for banks like Bank of America.
The bank's expected earnings, as per the Zacks Consensus Estimate, project a decline in both EPS and revenue for the upcoming quarter. However, Bank of America holds a Zacks Rank #3 (Hold), hinting at a neutral short-term outlook for the stock. Valuation metrics suggest that Bank of America might be undervalued relative to its peers, based on a Forward P/E ratio below the industry average and a favorable PEG ratio.
Experts at Oppenheimer, as outlined in a recent YouTube discussion, maintain a bullish outlook on Bank of America. With reports showcasing alignment of income and expenses with expectations, there's a keen interest in the potential of fee increases and the effective cost-cutting measures position the bank to leverage operating gains. Moreover, strategic improvements under Citigroup's CEO Jane Fraser and a comparison of wealth management strategies between Morgan Stanley and Bank of America suggest potential areas for growth and efficiency gains in Bank of America's operations.
Despite the financial market's resilience amid challenging circumstances, Bank of America has maintained customer financial health with consistent consumer spending trends, as explored in a YouTube video analyzing the bank's economic reports. Consumer and commercial sectors display a cautious yet strong performance, indicating the economy's broader ability to withstand adversity and the bank's prudent approach to managing economic trends.
In an interview with Bank of America's CEO, Brian Moynihan, he projects a slightly stronger economic environment for 2024. Bank of America foresees continuous organic growth and expects to benefit from the current economic conditions and operating leverage. Clarity on the Federal Reserve's rate adjustments and the potential impact of regulatory changes on capital requirements are also part of the bank's strategic considerations.
Each development outlined points to Bank of Americas overall sturdy position in the banking sector, offering insightful projections for the institution amid fluctuating economic conditions and market dynamism.
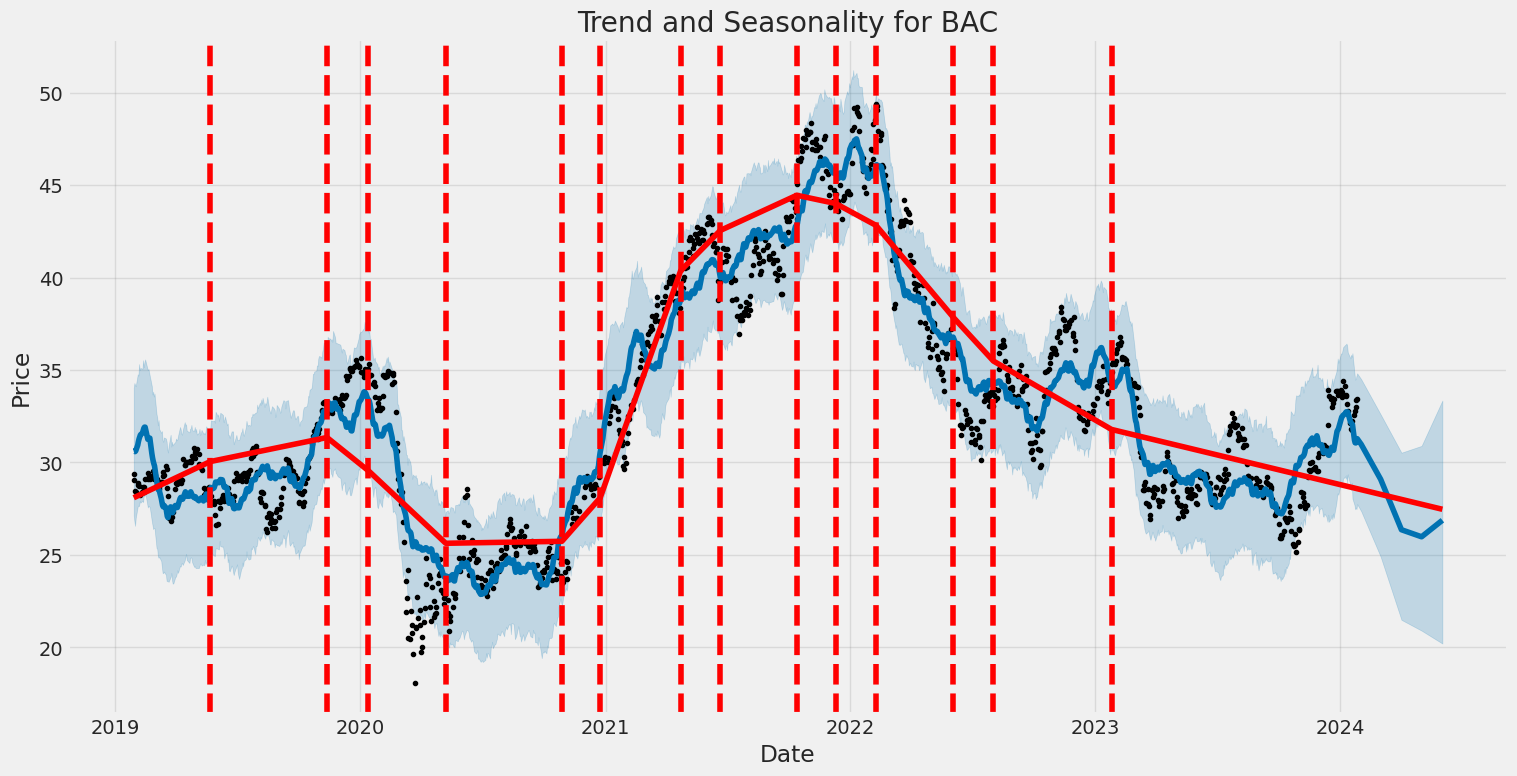
The Bank of America Corporation (BAC) displayed considerable volatility between January 29, 2019, and January 26, 2024. The ARCH model indicates a constant average return (Zero Mean) with all variability captured by changes in market volatility. Key features of this volatility include an omega value of 2.9066, suggesting a baseline volatility level, and an alpha[1] value of 0.3999, indicating that past returns had a substantial impact on current volatility, as reflected in the ARCH(1) term.
| Statistic Name | Statistic Value |
|---|---|
| R-squared | 0.000 |
| Adj. R-squared | 0.001 |
| Log-Likelihood | -2,661.38 |
| AIC | 5,326.77 |
| BIC | 5,337.04 |
| No. Observations | 1,257 |
| Df Residuals | 1,257 |
| omega | 2.9066 |
| alpha[1] | 0.3999 |
Analyzing the potential financial risk of investing in Bank of America Corporation (BAC) involves examining the volatility of the stock and predicting its future price movements. To grasp an understanding of the stock's past volatility, we deploy volatility modeling techniques that take into account the changing variance in stock price returns over time. These models are adept at capturing the 'clustering' of volatility, a phenomenon where high volatility periods tend to be followed by high volatility and low by low.
The volatility model identifies periods of higher risk when the stock's returns show greater variance from the mean. This type of analysis is particularly useful in assessing the risk of BAC's stock because it directly relates to the uncertainty or risk associated with the investment. This risk measure then can be used to project a distribution of potential outcomes for the stock's future returns.
On the other hand, machine learning predictions, specifically employing an algorithm like the one we have taken into consideration, provide a data-driven approach to forecasting future stock returns. By analyzing historical price data and uncovering patterns within this data, the algorithm can make informed predictions about future stock performance. The predictions from this method are not based on assumptions of normality or linear relationships, which often underpins more traditional financial models, and thus offer an alternative and powerful means of anticipating future movements in stock price.
The results from these two approaches can be used in conjunction to provide a clearer picture of the investment's risk profile. A crucial metric in this regard is Value at Risk (VaR) which allows investors to understand the maximum potential loss with a given confidence level. For a $10,000 investment in BAC, the calculated VaR at a 95% confidence interval stands at $279.14. This figure implies that there is a 95% chance that the investor will not lose more than $279.14 on their investment over the one-year period, under normal market conditions.
This calculated VaR is instrumental for an investor as it encapsulates the potential downside risk of the investment, taking into account both the historical volatility and predicted stock price movements. The integration of volatility modeling with machine learning predictions thus provides a dynamic and multifaceted view of the investment's financial risk, which is more robust than either approach used in isolation. The use of these sophisticated models can be a valuable asset in making informed decisions about equity investments and in managing investment risk effectively.
Similar Companies in BanksDiversified:
Citigroup Inc. (C), Wells Fargo & Company (WFC), The Toronto-Dominion Bank (TD), Royal Bank of Canada (RY), JPMorgan Chase & Co. (JPM), Nu Holdings Ltd. (NU), HSBC Holdings plc (HSBC), Canadian Imperial Bank of Commerce (CM), Bank of Montreal (BMO), The Bank of Nova Scotia (BNS), Credit Suisse Group AG (CS), Goldman Sachs Group, Inc. (GS), Morgan Stanley (MS), U.S. Bancorp (USB), PNC Financial Services Group, Inc. (PNC), Truist Financial Corporation (TFC), Report: The Bank of New York Mellon Corporation (BK), The Bank of New York Mellon Corporation (BK), Report: State Street Corporation (STT), State Street Corporation (STT)
https://www.zacks.com/stock/news/2197850/bank-stocks-soar-as-fed-signals-three-rate-cuts-for-2024
https://www.fool.com/investing/2023/12/14/why-bank-of-america-and-pnc-stocks-crushed-the-mar/
https://www.fool.com/investing/2023/12/15/3-warren-buffett-stocks-to-buy-hand-over-fist-in-d/
https://seekingalpha.com/article/4658155-bank-of-america-the-soaring-value-of-low-cost-deposit-base
https://seekingalpha.com/article/4658233-bank-of-america-grab-the-6-percent-yield-preferreds
https://www.fool.com/investing/2023/12/17/of-warren-buffetts-375-billion-portfolio-is-invest/
https://www.fool.com/investing/2023/12/17/no-brainer-warren-buffett-stocks-to-buy-right-now/
https://www.fool.com/investing/2023/12/19/2-top-warren-buffett-stocks-to-buy-right-now/
https://www.youtube.com/watch?v=t4p6WceyuPY
https://seekingalpha.com/article/4657945-5-reits-to-add-to-your-christmas-shopping-list
https://www.youtube.com/watch?v=mqstqZrU2aA
https://www.youtube.com/watch?v=3gJNDffILJA
https://www.sec.gov/Archives/edgar/data/70858/000007085823000272/bac-20230930.htm
Copyright © 2024 Tiny Computers (email@tinycomputers.io)
Report ID: UuLQWp
Cost: $0.83205
https://reports.tinycomputers.io/BAC/BAC-2024-01-27.html Home