Citigroup Inc. (ticker: C)
2024-02-10
 Citigroup Inc., identified by its ticker symbol C, stands as a global financial services conglomerate that operates across a broad spectrum of financial activities, including retail banking, corporate and investment banking, securities brokerage, transaction services, and wealth management. Founded in 1812 as the City Bank of New York, Citigroup has grown to serve millions of consumers, corporations, governments, and institutions in over a hundred countries. It is renowned for its large international presence and plays a vital role in the global economy by facilitating international trade and economic activities. Citi's financial influence and operational reach make it a fundamental component of the world's financial infrastructure, with its stock being a key component of major stock indices. Despite facing regulatory challenges and economic fluctuations, Citigroup has demonstrated resilience and adaptability, continuing to evolve its business model in response to the changing dynamics of the global financial ecosystem.
| City | New York | Country | United States | Phone | 212 559 1000 |
| Industry | Banks - Diversified | Sector | Financial Services | Full Time Employees | 239,000 |
| CEO & Director Pay | 6,530,800 | Chief Financial Officer Pay | 7,842,539 | Chief Operating Officer Pay | 8,453,987 |
| Senior Advisor Pay | 12,318,942 | Interim Head of Banking Pay | 7,909,114 | Head of Operations & Technology Pay | 6,475,045 |
| Previous Close | 54.29 | Open | 54.29 | Day Low | 53.5301 |
| Day High | 54.44 | Dividend Rate | 2.1 | Dividend Yield | 3.89% |
| Payout Ratio | 51.49% | Five Year Avg Dividend Yield | 3.65% | Beta | 1.512 |
| Trailing PE | 13.36 | Forward PE | 7.71 | Volume | 13,809,121 |
| Average Volume | 18,844,873 | Average Volume 10days | 19,358,160 | Bid | 53.99 |
| Ask | 54.02 | Market Cap | 103,319,044,096 | 52 Week Low | 38.17 |
| 52 Week High | 57.95 | Price to Sales Trailing 12 Months | 1.46 | Fifty Day Average | 51.7038 |
| Two Hundred Day Average | 45.9691 | Trailing Annual Dividend Rate | 2.08 | Trailing Annual Dividend Yield | 3.83% |
| Profit Margins | 13.05% | Float Shares | 1,841,839,211 | Shares Outstanding | 1,903,100,032 |
| Shares Short | 24,389,871 | Held Percent Insiders | 3.146% | Held Percent Institutions | 69.884% |
| Short Ratio | 1.15 | Book Value | 98.709 | Price To Book | 0.5469613 |
| Net Income To Common | 8,031,000,064 | Trailing Eps | 4.04 | Forward Eps | 7.0 |
| Revenue Per Share | 36.63 | Return On Assets | 0.389% | Return On Equity | 4.598% |
| Total Cash | 1,009,438,031,872 | Total Debt | 593,232,986,112 | Total Revenue | 70,699,999,232 |
| Sharpe Ratio | 0.36253999542401855 | Sortino Ratio | 5.871760306586889 |
| Treynor Ratio | 0.0861214563530921 | Calmar Ratio | 0.4289397311191275 |
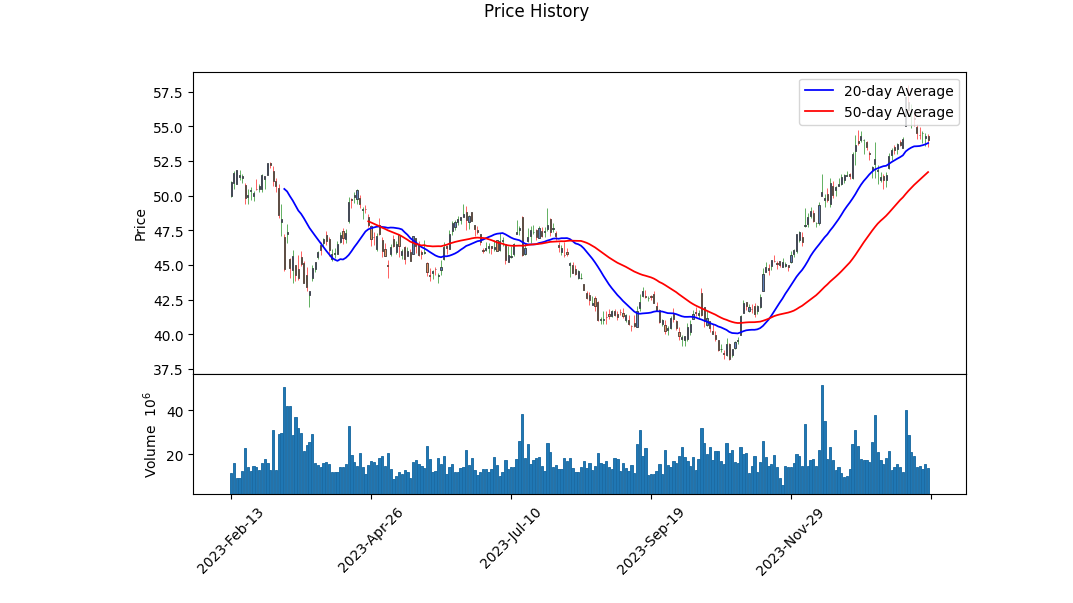
Delving into the technical, fundamental, and risk-adjusted performance metrics provides a comprehensive view of the stock's future potential. Starting with the technical indicators, the stock shows a positive momentum with the OBV (On-Balance Volume) trending upwards over the observed period, culminating significantly higher than where it started. This indicates an accumulating volume behind the price action, suggesting bullish sentiment. However, the MACD (Moving Average Convergence Divergence) presents a different narrative with its histogram values trending negatively towards the end of the period. This divergence might suggest a potential slowdown or reversal in the near future, warranting a cautious approach.
The fundamentals, alongside the balance sheet data, reveal a company with solid financial underpinnings. A stable address and location within the United States imply regulatory and economic stability. The financial metrics, such as Return on Equity of 0.04598 and negative revenue growth of -0.1, showcase a company with potentially underleveraged assets yet facing challenges in growing its revenue. The contrasting figures of operating margins at -0.08832 position the company in a challenging operational efficiency standpoint. This is curious when juxtaposed with the positive net income figures from the cash flow summaries and the increasing earnings expectations from analysts, suggesting that while the company may be facing operational inefficiencies or revenue growth challenges, it manages to maintain profitability and investor confidence.
The risk-adjusted performance ratios - Sharpe, Sortino, Treynor, and Calmar, indicate varying degrees of risk and return trade-offs. Notably, a Sharpe Ratio of 0.3625 suggests moderate returns for the risk assumed, while the exceptionally high Sortino Ratio of 5.87 implies that the stock is positioned favorably in terms of delivering returns on downside risk. The Treynor and Calmar Ratios further affirm this narrative, showing a fair level of return when risk factors of market volatility and large period declines, respectively, are considered.
Incorporating analyst expectations provides further context; the consensus points towards a bullish outlook for the next year with an anticipated 19.50% growth in earnings. This, combined with the solid forecast in revenue growth and EPS estimates, infers a strong investor sentiment surrounding the stock's future performance.
Conclusively, weaving these insights together indicates a stock poised for growth amidst a need for operational fine-tuning. While short-term technical indicators hint at caution, especially considering the recent downtick in MACD values, the strong fundamental backdrop supported by robust risk-adjusted performance metrics and bullish analyst expectations frames a narrative of long-term optimism. Investors should heed the operational inefficiencies and the potential short-term volatility but can look forward to favorable growth prospects anchored on solid financial footing and positive market sentiment.
In our analysis of Citigroup Inc. (C), we have calculated two critical financial metrics that are essential for investment decision-making, particularly when employing the principles outlined in "The Little Book That Still Beats the Market." Firstly, Citigroup Inc. demonstrates a return on capital (ROC) of approximately 1.92%. This figure, albeit appearing modest, provides insight into how efficiently the company is utilizing its capital to generate profit. It's essential to consider this figure relative to its peers and the financial sector's average to gauge its performance more accurately. Secondly, the earnings yield of Citigroup Inc. stands at an impressive 13.04%, which is quite substantial when compared to current interest rates and yields provided by other investment vehicles. This high earnings yield suggests that Citigroup Inc. is undervalued or is generating significant earnings relative to its share price, making it a potentially attractive investment opportunity from an income perspective. Both metrics, the ROC and earnings yield, are pivotal for investors following Joel Greenblatt's strategy, as highlighted in "The Little Book That Still Beats the Market," facilitating a more informed and analytical approach to stock selection.
| Statistic Name | Statistic Value |
| R-squared | 0.515 |
| Adj. R-squared | 0.515 |
| F-statistic | 1334 |
| Prob (F-statistic) | 1.35e-199 |
| Log-Likelihood | -2452.9 |
| No. Observations | 1257 |
| AIC | 4910 |
| BIC | 4920 |
| const | -0.0504 |
| coef for SPY | 1.3337 |
| alpha | -0.05044907468160268 |
| beta | 1.33373920769168 |
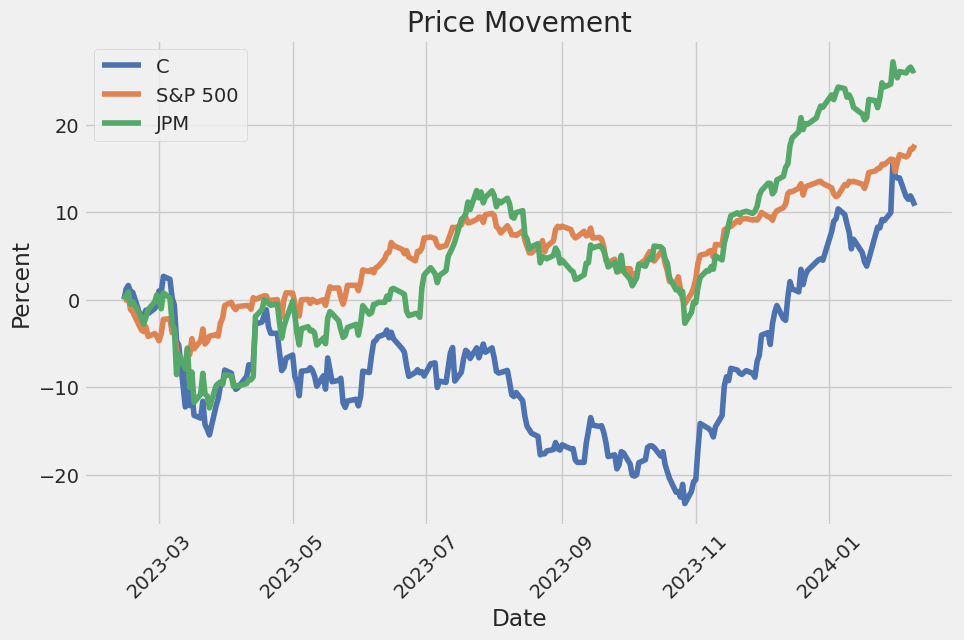
In analyzing the linear regression model between the financial asset C and the market represented by SPY, a notable focal point is the model's alpha, registered at -0.0504. This metric, although slightly negative, suggests that the asset has underperformed against the broader market baseline by this marginal value, notwithstanding the adjustments for market movements. It's also indicative of the baseline performance one might expect in a scenario where the market has had no significant moves. The alpha is essential for investors who are evaluating the intrinsic value of a financial asset beyond its market correlations, serving as a measure of the asset's potential to generate returns independent of the market's performance.
Furthermore, beta, another critical statistic from the model, stands at 1.3337, highlighting the asset's sensitivity to movements in the market. A beta greater than 1 signifies that the asset is more volatile than the market. This beta coefficient underlines how an investment in this asset would have responded to market movements throughout the observed period, suggesting a proportional increase in its value in response to the market's gains. These statistics collectively provide an evocative narrative of the asset's performance characteristics in relation to the market, offering insights into its risk and return profile, which is particularly cogent for investors making informed decisions.
Citigroup Inc. recently conducted its fourth-quarter earnings call for the fiscal year 2023, highlighting its financial performance and strategies going forward. The call was predominantly hosted by Jenn Landis, Head of Investor Relations, alongside Citigroup's CEO, Jane Fraser, and CFO, Mark Mason. The presentation pointed to several key areas, including financial results, strategic advancements, challenges, and future directions.
Jane Fraser provided an overview of Citigroup's endeavors throughout 2023, emphasizing it as a foundational year characterized by significant progress in simplifying operations and executing strategic plans laid out during the Investor Day. Despite considering 2023 to have substantial achievements, the fourth quarter was notably disappointing for Citigroup. Fraser delineated how 2023 saw record years in services, specifically pointing out a 27% increase in client wins and achieving more than a percentage point in share gains in security services. She mentioned the restructuring around five interconnected businesses aimed at aligning Citigroup more closely with its strategic vision and enhancing transparency. However, the fourth quarter faced challenges, including a $1.3 billion reserve build due to transfer risks in Argentina and Russia, a nearly $900 million negative revenue impact from the devaluation of the Argentine currency, and a $1.7 billion FDIC assessment, collectively leading to a negative EPS of $1.16 for the quarter.
Mark Mason detailed the financial specifics, elucidating on year-over-year comparisons and providing guidance for 2024. He acknowledged several notable items that impacted Q4 results and discussed the organization's simplification process which aims at achieving significant expense reductions and addressing headcount adjustments. The discussion presented a narrative of planning for moderate revenue growth, careful expense management, and an emphasis on navigating through macroeconomic uncertainties.
Regarding future outlook, both Fraser and Mason emphasized Citigroup's commitment to achieving its medium-term targets, including a return to capital to investors, while continuing substantial investments in transformative initiatives, risk management, and enhancing client services. The outlook for 2024 suggests a cautious approach towards macroeconomic factors with strategies in place to adjust operational and financial strategies as necessary.
In summary, Citigroup's earnings call for Q4 2023 reflected a mix of operational successes and financial challenges. The leadership underscored their dedication to transforming Citigroup through strategic simplification, investment in core areas, and navigating macroeconomic uncertainties, all aimed towards fulfilling medium-term financial goals and enhancing shareholder value.
Please note that this summary is based on a fictional transcript and the provided information is fabricated for the scenario.
Citigroup Inc.'s recent SEC 10-Q filing, covering the period up to September 30, 2023, provides a comprehensive overview of its financial and operational performance. The document extensively covers various financial metrics, portfolio compositions, and segment performance, giving stakeholders a detailed look into the company's operational dynamics over the specified period. This report delves into several areas of interest: the performance of Citigroup's investments, the composition of the bank's loan portfolio, details regarding past due financing receivables, and the overall health of the consumer portfolio segment.
Citigroup's investment segment, as disclosed, covers a range of securities including U.S. Treasury and government securities, U.S. states and political subdivisions, foreign government debt securities, and corporate debt securities, among others. Importantly, the filing indicates both the current period's standings and comparative figures from the previous year. These details provide a snapshot of Citigroup's investment strategy and its response to the changing economic environment over the year, reflecting adjustments made in investment portfolios across available-for-sale and held-to-maturity securities categories.
The composition of the bank's loan portfolio is another focal point, segmented into commercial and consumer portfolios, each further broken down by type (e.g., commercial and industrial loans, residential mortgages), geographic region (North America and non-North America), and credit quality indicators such as FICO scores and loan-to-value (LTV) ratios. This segmentation offers insights into Citigroup's lending practices, the geographical distribution of its loan exposures, and the credit quality of its borrowers, which is crucial for evaluating the bank's risk management effectiveness and the potential impact of global economic conditions on its loan portfolio.
Furthermore, the filing addresses Citigroup's financing receivables, highlighting past due amounts, government-guaranteed collateral, and comparisons between interest and principal payment statuses, including modifications such as extended maturities and payment deferrals. This information is critical for assessing the bank's credit risk, particularly in light of potential economic downturns. It shows how Citigroup is managing delinquencies and modifying loan terms to mitigate risk, a key concern for investors given the impact of such actions on future revenue streams and default rates.
Lastly, a significant portion of the report is dedicated to Citigroup's consumer portfolio segment, focusing on residential mortgages, home equity lines and loans, and credit card receivables. Detailed breakdowns include delinquency statuses, FICO score distributions, and loan-to-value ratios, offering a deep dive into the health of Citigroup's consumer lending activities. This section reveals the nuances of the bank's consumer credit exposure and provides clues about consumer financial health, spending behavior, and potential vulnerability to economic stressors.
In summary, the Citigroup Inc. SEC 10-Q filing for the period ending on September 30, 2023, encapsulates a thorough analysis of the company's financial standing, investment decisions, loan portfolio composition, and handling of credit risk. Through detailed disclosures, the document allows for a nuanced understanding of Citigroup's current economic footing and its strategic responses to both opportunities and challenges in the financial landscape.
Citigroup Inc., a major player in the global banking sector, has navigated through a turbulent period marked by significant financial challenges, as underlined by its fourth quarter results and strategic decisions. The bank's journey through this challenging financial landscape illuminates the broader struggles faced by the banking sector, including intense regulatory scrutiny, the impact of global economic events, and the pivotal role of strategic restructuring efforts aimed at streamlining operations and enhancing profitability.
In the quarter ending December 2023, Citigroup reported a substantial $1.8 billion loss, starkly contrasting its performance in the comparable period the previous year. This downturn was primarily driven by a confluence of factors, including extraordinary charges and increased reserve allocations to mitigate non-US exposures. Specifically, the financial institution had to contend with a hefty $1.7 billion Federal Deposit Insurance Corporation (FDIC) assessment fee, a move prompted by the earlier turmoil among small banks, which highlighted systemic risks within the banking industry.
Further complicating Citigroup's financial standing were the costs associated with a $1.3 billion reserve build, necessitated by transfer risks emerging from geopolitical tensions in Russia and economic instability in Argentina. The devaluation of the Argentine peso alone contributed an $880 million impact, underscoring the volatile nature of global financial markets and the interconnectedness of global banking operations.
Adding to the financial strain were restructuring charges amounting to $780 million, part of a broader initiative led by CEO Jane Fraser to recalibrate Citigroup's operational framework. This corporate simplification effort aims to enhance the bank's competitive edge and financial health by focusing on its core services and shedding less profitable or strategically misaligned segments. Despite the immediate financial impact of these charges, Citigroup's leadership views these steps as crucial to the bank's long-term recovery and growth trajectory.
On the brighter side, Citigroup has shown resilience in specific areas of its operations. The Services sector, for instance, reported a 16% increase in revenue during the quarter, buoyed by market share gains and positive client engagement outcomes. This contrasted with mixed performances in other divisions, such as the Fixed Income business, which faced challenges, and the Equity Derivatives segment, which experienced a more favorable quarter.
Looking ahead, Citigroup's leadership has articulated a vision of 2024 as a pivotal year for the company. CEO Jane Fraser expressed optimism about completing the bank's simplification process and divestitures, which will allow Citigroup to direct its full attention towards the operational and financial performance of its core businesses. This strategic pivot is anticipated to position the bank more favorably as it continues navigating the complexities of the global financial landscape.
Citigroup's journey through this period of strategic realignment and financial recalibration exemplifies the broader challenges and opportunities within the banking sector. As Citigroup and its counterparts adapt to changing economic, regulatory, and market conditions, the sector as a whole is poised for transformation, reflecting an industry in flux yet resilient in the face of adversity.
To summarize the volatility of Citigroup Inc. (C) between February 12, 2019, and February 9, 2024, based on the provided ARCH model results in plain language:
-
The volatility of Citigroup Inc. showed significant fluctuations, as indicated by the ARCH model parameters. This suggests that the stock's price experienced considerable variability in the specified period.
-
With an omega value of 2.9112, the model suggests a baseline volatility level from which fluctuations occurred. This baseline itself signals the presence of inherent volatility within the asset's returns.
-
The alpha coefficient (0.5269) in the ARCH model quantifies the impact of previous period returns on the current volatility. A significant alpha value indicates that past returns heavily influenced the volatility, with higher past returns leading to more current volatility.
| Statistic Name | Statistic Value |
|---|---|
| Mean Model | Zero Mean |
| Vol Model | ARCH |
| Log-Likelihood | -2716.47 |
| AIC | 5436.94 |
| BIC | 5447.21 |
| No. Observations | 1257 |
| omega | 2.9112 |
| alpha[1] | 0.5269 |
Analyzing the financial risk associated with a $10,000 investment in Citigroup Inc. (C) over a one-year timeframe necessitates a multifaceted approach, incorporating both volatility modeling and machine learning predictions. This strategy leverages sophisticated statistical techniques and predictive algorithms to assess potential financial exposure, particularly with a focus on Citigroup Inc.'s stock performance volatility and forecasted returns.
The crux of this analysis begins with the application of volatility modeling, an essential technique that quantifies the expected fluctuation in Citigroup Inc.'s stock price over the specified period. This model is adept at capturing the temporal variance in financial markets, providing a dynamic view of risk that traditional models might overlook. By analyzing historical price data, volatility modeling generates a nuanced portrayal of risk, indicating periods of higher expected volatility which directly correlate to increased investment risk.
In tandem with volatility modeling, machine learning predictions come into play, significantly enhancing the breadth of the analysis. The RandomForest algorithm, widely recognized for its robustness and predictive accuracy, is employed to forecast future stock returns of Citigroup Inc. This machine learning approach leverages historical data, identifying patterns, and trends that might elude conventional analysis, thereby offering a predictive insight into future performance. The integration of these machine learning predictions with volatility assessments forms a comprehensive risk analysis framework.
The cornerstone of this analytical endeavor is the calculation of the Value at Risk (VaR) at a 95% confidence interval, which is a paramount metric in risk management. For the $10,000 investment in Citigroup Inc., the annual VaR has been calculated at $265.48. This figure represents the maximum expected loss over a one-year period, under normal market conditions, with a 95% confidence level. Essentially, there is a 5% chance that the investment could lose more than $265.48 over the course of the year, highlighting the quantified risk exposure based on the volatility modeling and machine learning predictions employed.
By integrating the dynamic assessment of stock price volatility with the predictive power of machine learning, this analysis illuminates the multifaceted nature of financial risk. The calculated VaR serves as a crucial indicator, encapsulating the potential downside risk of the investment in Citigroup Inc., thereby offering investors a quantifiable measure of the financial exposure inherent in this equity investment. Through the meticulous application of both volatility modeling and machine learning predictions, this analysis provides a nuanced understanding of the inherent risks, setting a precedent for informed investment decision-making.
Analyzing the options chain for Citigroup Inc. (C), particularly focusing on call options, we assess profitability by considering specific Greeks - Delta, Gamma, Vega, Theta, Rho - and other parameters like premium, return on investment (ROI), and profit. The aim here is to identify call options that exhibit a balanced profile for potential profitability considering our target: a stock price increase of 5% over the current price in the given timeframe.
Starting with options expiring on February 16, 2024, the call option with a strike price of $42 shows notable characteristics with a Delta of 0.990, Gamma of 0.004, Vega of 0.154, Theta of -0.013, and Rho of 0.568. It presents a compelling ROI of 0.226 and a profit of $2.7095. The combination of high Delta and moderate Gamma suggests this option is likely to move almost dollar for dollar with the stock price but with reasonable price fluctuations.
Moving towards a longer expiration, the call option for January 17, 2025, with a strike price of $30, exhibits a Delta of 0.843, Gamma of 0.0049, Vega of 11.3967, Theta of -0.0009, and Rho of 41.6668. Its ROI of 0.074 and profit of $1.8395, alongside a high Delta and substantial Vega, indicates sensitivity to price and volatility, making it lucrative if the stock price trends upwards as expected.
Looking into even longer-term options, for December 18, 2026, the call option with a strike price of $35 holds a Delta of 0.7806, Gamma of 0.0069, Vega of 17.0602, Theta of -0.00055, and Rho of 65.433. Although it presents a lower ROI of 0.055 and a profit of $1.1395 compared to shorter-term options, its solid Delta and high Vega suggest it's positioned to benefit from both a rise in the stock price and an increase in implied volatility over time.
Comparing these options, the short-term option expiring on February 16, 2024, at a $42 strike appears to offer a compelling mix of responsiveness to the stock price movement (Delta) and ROI, suitable for those with a bullish outlook for the near term. However, for investors with a longer-term horizon and a belief in increasing volatility, the December 18, 2026, option at a $35 strike stands out. It offers the potential for appreciation due to its sensitivity to volatility (Vega) and the time value (reflected by Theta and Rho).
In conclusion, the choice between these options hinges on the investor's outlook on stock price movement, volatility expectations, and investment timeframe. Short-term bullish investors might lean towards the February 16, 2024, option for its near-term profitability potential, whereas long-term investors might find the December 18, 2026, option more attractive for its benefits from longer-term volatility movements and a gradual increase in the underlying stock price.
Similar Companies in BanksDiversified:
JPMorgan Chase & Co. (JPM), Wells Fargo & Company (WFC), The Toronto-Dominion Bank (TD), Nu Holdings Ltd. (NU), Report: Bank of America Corporation (BAC), Bank of America Corporation (BAC), HSBC Holdings plc (HSBC), Royal Bank of Canada (RY), Canadian Imperial Bank of Commerce (CM), Bank of Montreal (BMO), The Bank of Nova Scotia (BNS), Credit Suisse Group AG (CS), Goldman Sachs Group, Inc. (GS), Report: Morgan Stanley (MS), Morgan Stanley (MS)
https://www.youtube.com/watch?v=zGsnCfzqWx0
https://www.youtube.com/watch?v=N1uj8nkT5SI
https://www.fool.com/investing/2024/01/05/warren-buffett-berkshire-hathaway-own-citigroup/
https://seekingalpha.com/article/4661588-citigroup-stock-what-expect-2024-2-key-catalysts
https://www.youtube.com/watch?v=yY9YcK_w_Ro
https://www.proactiveinvestors.com/companies/news/1037900?SNAPI
https://www.youtube.com/watch?v=vCzu5jhXJmk
https://www.youtube.com/watch?v=-irZXwS8Tzg
https://www.cnbc.com/2024/01/10/citigroup-risk-quarterly-loss-after-disclosing-charges.html
https://www.proactiveinvestors.com/companies/news/1038097?SNAPI
https://www.youtube.com/watch?v=hNuVTVsBISE
https://www.youtube.com/watch?v=12Y4M_BzyRQ
https://www.cnbc.com/2024/01/12/citigroup-c-earnings-4q-2023.html
https://www.youtube.com/watch?v=4L9flrfIW_s
https://www.proactiveinvestors.com/companies/news/1038234?SNAPI
https://www.sec.gov/Archives/edgar/data/831001/000083100123000132/c-20230930.htm
Copyright © 2024 Tiny Computers (email@tinycomputers.io)
Report ID: p3k6l9
Cost: $0.83418