Celsius Holdings, Inc. (ticker: CELH)
2024-06-30
 Celsius Holdings, Inc. (NASDAQ: CELH) is a prominent player in the health and wellness sector, particularly in the energy drink market. Founded in 2004 and headquartered in Boca Raton, Florida, the company has rapidly gained recognition for its proprietary line of energy beverages that claim to accelerate metabolism, burn body fat, and provide lasting energy without the crash commonly associated with traditional energy drinks. Its product portfolio includes a variety of flavors and formulations, including carbonated and non-carbonated beverages, which are sold through multiple distribution channels, including grocery stores, convenience stores, and online platforms. Celsius Holdings has demonstrated robust financial performance, reflecting its innovation, strategic marketing, and partnerships. The company has leveraged its commitment to clinically proven health benefits and an active lifestyle to build a dedicated consumer base. It is expected to continue its growth trajectory as it expands its product line and global reach.
| Full Time Employees | 765 | Previous Close Price | 57.54 | Open Price | 57.7 |
| Day Low Price | 56.41 | Day High Price | 58.11 | Current Price | 57.09 |
| Market Cap | 13,306,594,304 | Enterprise Value | 13,253,578,752 | Trailing PE Ratio | 62.736263 |
| Forward PE Ratio | 40.204227 | Beta | 1.92 | Volume | 5,586,244 |
| Average Volume | 5,073,626 | Average Volume (10 Days) | 6,369,270 | Bid Price | 57.03 |
| Ask Price | 57.12 | Bid Size | 500 | Ask Size | 1,200 |
| 52 Week Low | 45.03 | 52 Week High | 99.62 | Price to Sales Ratio | 9.412048 |
| 50 Day Average | 74.609 | 200 Day Average | 65.48728 | Profit Margins | 0.1863 |
| Float Shares | 171,000,098 | Shares Outstanding | 233,080,992 | Shares Short | 17,730,927 |
| Short Ratio | 3.39 | Held by Insiders | 0.40675 | Held by Institutions | 0.65472 |
| Book Value | 1.451 | Price to Book Ratio | 39.34528 | Net Income | 215,324,992 |
| Trailing EPS | 0.91 | Forward EPS | 1.42 | PEG Ratio | 1.62 |
| Enterprise to Revenue | 9.375 | Enterprise to EBITDA | 42.955 | 52 Week Change | 0.1551224 |
| S&P 52 Week Change | 0.22553468 | Total Cash | 879,497,984 | Total Cash Per Share | 3.773 |
| Total Debt | 1,977,000 | Quick Ratio | 3.424 | Current Ratio | 4.171 |
| Total Revenue | 1,413,783,040 | Debt to Equity Ratio | 0.17 | Revenue Per Share | 6.108 |
| Return on Assets | 0.1296 | Return on Equity | 0.2547 | Free Cash Flow | 293,446,880 |
| Operating Cash Flow | 289,697,984 | Earnings Growth | 1.077 | Revenue Growth | 0.368 |
| Gross Margins | 0.49620998 | EBITDA Margins | 0.21824 | Operating Margins | 0.23386998 |
| Target High Price | 110.0 | Target Low Price | 60.0 | Target Mean Price | 86.39 |
| Target Median Price | 88.5 | Recommendation Mean | 1.9 | Number of Analyst Opinions | 16 |
| Sharpe Ratio | 0.4627485778321508 | Sortino Ratio | 8.236789534749565 |
| Treynor Ratio | 0.1859890271112945 | Calmar Ratio | 0.3750920962487333 |
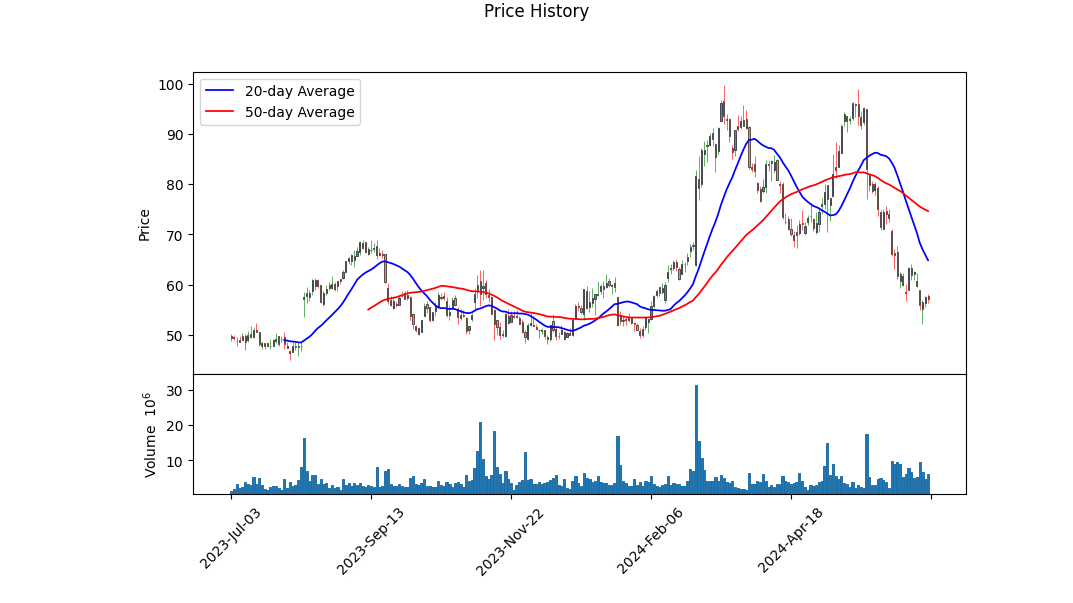
CELH has demonstrated a rather bearish trend in recent months, as indicated by the series of lower highs and lower lows observed in its price movement. The MACD histogram signals, which have been below zero, denote persistent bearish momentum. Despite this negative backdrop, the stock's On-Balance Volume (OBV) reflects some inconsistencies, suggesting that while there is selling pressure, volumes traded show signs of recovery at various points.
The fundamental metrics of CELH paint a robust financial health picture. With a gross margin of 49.62% and an operating margin of 23.39%, the company maintains strong profitability. The trailing PEG ratio of 1.7799 indicates that the stock is reasonably priced considering its growth prospects. Moreover, an Altman Z-Score of 18.75 points to exceptional financial stability, further supported by a retained earnings figure of $58.92 million and total assets amounting to $1.65 billion.
Assuming a typical risk-free rate driven by the ten year treasury yield, the Sharpe Ratio of 0.4627 suggests that CELH has moderated risk-adjusted returns. This indicates that while the returns are acceptable, there is significant room for improvement in balancing risk. On the other hand, the Sortino Ratio, standing at 8.2368, highlights the stock's effectiveness in minimizing downside volatility - a significant strength in turbulent markets. The Treynor Ratio comes in at 0.186, pointing towards the modest returns in relation to systematic risk. Lastly, the Calmar Ratio of 0.375 signals that the stock's returns are somewhat decent when adjusted for drawdowns.
Looking at the balance sheet and cash flow statement, CELH exhibits solid liquidity, with cash and equivalents amounting to $755.98 million and a minimal debt of $2.19 million. The firms free cash flow of $123.79 million underscores its ability to generate ample cash from operations, providing further assurance regarding its operational efficiency and financial independence.
Evaluating the data holistically, CELHs stock price could experience a further downturn in the short term, perhaps lasting a few months. This is primarily driven by current bearish technical indicators and moderate-to-high operational risk as indicated by the Sharpe Ratio. However, the firms sound fundamental metrics and risk-adjusted performance measurements reflect underlying strengths that may trigger a stabilizing effect in the long term. For investors, this could provide an attractive entry point upon confirmation of a trend reversal.
Celsius Holdings, Inc. (CELH) exhibits a robust financial performance when analyzed through the lens of two key metrics from "The Little Book That Still Beats the Market": Return on Capital (ROC) and Earnings Yield. The company's ROC stands at an impressive 21.14%, signifying its strong ability to generate profit from its capital investments. This indicates that Celsius Holdings is adept at efficiently utilizing its capital to produce significant returns, reflecting operational effectiveness and potentially superior management practices. However, the earnings yield of 1.38% suggests a contrasting perspective. This relatively low percentage indicates that the earnings relative to the company's market valuation are modest, implying that the stock might be priced expensively relative to its earnings. Investors might interpret the high ROC as a sign of quality but should also consider the low earnings yield as a factor in assessing the overall investment appeal and potential growth expectations of Celsius Holdings.
Research Report: Analysis of Celsius Holdings, Inc. (CELH) Against Benjamin Graham's Value Investing Criteria
In "The Intelligent Investor," Benjamin Graham provides a robust framework for evaluating stocks through his principles of value investing. By scrutinizing various metrics, such as the Price-to-Earnings (P/E) Ratio, Price-to-Book (P/B) Ratio, Debt-to-Equity Ratio, Current and Quick Ratios, and earnings growth, investors can identify undervalued stocks with strong fundamentals. Below, we will assess Celsus Holdings, Inc. (CELH) based on these key metrics and examine how the company aligns with Graham's criteria.
Margin of Safety
Graham's concept of the margin of safety emphasizes purchasing securities significantly below their intrinsic value. In order to evaluate CELH, we need to delve into its intrinsic value through detailed fundamental analysis. However, based on the provided ratios, we can conduct some preliminary assessments.
Price-to-Earnings (P/E) Ratio
Metric: -7714.86
Graham favored stocks with low P/E ratios compared to their industry peers. A negative P/E ratio often indicates that the company is not profitable at the moment, as is the case with CELH. This is a significant red flag in Graham's value investing framework as it implies negative earnings, making it difficult to assess the value.
Price-to-Book (P/B) Ratio
Metric: 8.66
Graham preferred companies trading below their book value to provide a cushion against market volatility. CELHs P/B ratio is 8.66, which indicates that the stock is trading much higher than its book value. This discrepancy can suggest either an overvaluation of the stock or investors' high expectations of future growth, neither of which aligns with Grahams preference for undervalued stocks.
Debt-to-Equity Ratio
Metric: 0.002
CELH boasts an exceptionally low Debt-to-Equity ratio of 0.002, well within Graham's preferred range. A low Debt-to-Equity ratio indicates low financial risk and a strong balance sheet, which is favorable under Graham's criteria. This suggests that the company has minimal debt burdens and is financially stable, which is particularly important for long-term investment.
Current and Quick Ratios
Metric: 4.36 (both Current and Quick Ratios)
Graham looked for companies with a strong ability to meet short-term liabilities. CELH exhibits both a Current Ratio and a Quick Ratio of 4.36, indicating that the company is more than capable of covering its short-term obligations. These ratios suggest a high level of liquidity and financial health, which align well with Graham's criteria.
Earnings Growth
The report does not provide specific historical data on CELHs earnings growth. An analysis of consistent earnings growth over a period of years would be essential to fully determine alignment with Graham's principles. Investors are encouraged to review CELH's earnings trend over the past 5-10 years to make a comprehensive assessment.
Industry P/E Ratio
Metric: Not Provided
Without the industry P/E ratio, it is challenging to fully benchmark CELHs valuation against its peers. Graham would typically compare the subject company's P/E ratio to that of its industry to discern relative value. The absence of this metric renders a comparative analysis incomplete.
Conclusion
Based on the provided metrics, CELH partially aligns with Benjamin Graham's value investing principles:
- Debt-to-Equity Ratio: Highly favorable
- Current and Quick Ratios: Highly favorable
- Price-to-Book Ratio: Not favorable
- Price-to-Earnings Ratio: Not favorable
CELHs low Debt-to-Equity, Current, and Quick Ratios showcase financial stability and low risk, aligning well with Grahams criteria. However, the significantly high P/B ratio and the negative P/E ratio are major concerns, suggesting potential overvaluation and lack of current profitability. Further investigation into CELHs earnings growth and comparisons with the industry P/E ratio would be necessary for a comprehensive evaluation.
Investors should approach CELH with caution, conducting additional fundamental analysis to determine the intrinsic value and long-term prospects before making investment decisions.### Analyzing Financial Statements
Analyzing financial statements is a critical part of evaluating the health and potential of any company. According to Benjamin Graham, investors should meticulously examine a company's balance sheet, income statement, and cash flow statement. By understanding a company's assets, liabilities, earnings, and cash flows, investors can make more informed decisions.
Example: Analysis of Celsius Holdings, Inc. (Symbol: CELH)
Let's analyze the Q1 2024 financial statements provided for Celsius Holdings, Inc. (CELH) as an example.
1. Balance Sheet
The balance sheet provides a snapshot of a company's financial position at a specific point in time by showing its assets, liabilities, and shareholders' equity.
Key Highlights: - Total Assets: $1,646,140,000 - Current Assets: $1,315,025,000 - Cash and Cash Equivalents: $879,498,000 - Accounts Receivable (net): $200,117,000 - Inventory (net): $197,504,000 - Total Liabilities: $483,461,000 - Current Liabilities: $315,269,000 - Accounts Payable: $40,196,000 - Stockholder's Equity: $338,191,000
Analysis: - High Liquidity: With cash and cash equivalents at $879,498,000, Celsius Holdings has a strong liquidity position. This can provide a buffer against short-term liabilities. - Receivables and Inventory: The accounts receivable ($200,117,000) and inventory ($197,504,000) are significant components of current assets. Monitoring trends in these figures can give insights into sales processes and inventory management efficiency. - Current Liabilities: At $315,269,000, current liabilities are substantial. Comparing this to current assets shows a current ratio of approximately 4.17, which indicates good short-term financial health.
2. Income Statement
The income statement shows a companys financial performance over a period of time, detailing revenues and expenses.
Key Highlights: - Revenue: $355,708,000 - Cost of Revenue: $173,501,000 - Gross Profit: $182,207,000 - Net Income: $77,811,000 - Earnings Per Share (Basic): $0.28
Analysis: - Gross Profit Margin: The gross profit margin (Gross Profit / Revenue) is approximately 51.21%. This indicates that Celsius Holdings is able to retain a significant portion of revenue as gross profit. - Net Income: The net income for the period is $77,811,000, resulting in a net profit margin (Net Income / Revenue) of about 21.87%. This is a robust margin, indicating good profitability. - Operating Expenses: Key operating expenses such as general and administrative expenses are $99,017,000. Ensuring these expenses are proportionate to revenue is essential for sustained profitability.
3. Cash Flow Statement
The cash flow statement shows the cash inflows and outflows from operational, investing, and financing activities.
Key Highlights: - Net Cash Provided by Operating Activities: $134,649,000 - Net Cash Used in Investing Activities: -$4,525,000 - Net Cash Used in Financing Activities: -$5,885,000
Analysis: - Operating Cash Flow: Positive operating cash flow of $134,649,000 suggests that the core business operations are generating substantial cash, which is a positive sign of financial health. - Investing Activities: The net cash used in investing activities ($4,525,000) primarily includes capital expenditures for property and equipment, which are necessary for future growth. - Financing Activities: Net cash used in financing activities ($5,885,000) indicates payments toward finance leases and dividends on preferred stock, balanced with proceeds from stock option exercises.
Conclusion
In conclusion, Celsius Holdings, Inc. demonstrates a strong financial position with substantial liquidity, solid profitability, and positive operating cash flows. By analyzing the above financial statements, investors can gain insights into the company's operational efficiency, financial health, and potential for long-term growth.
Investors should continue to monitor these metrics and compare them against historical performance and industry benchmarks to make informed investment decisions.### Dividend Record
Dividend Record: Graham favored companies with a consistent history of paying dividends.
Company: CELH
- Symbol: CELH
- Dividend History: There is no historical data available for dividends for CELH.
Benjamin Graham, in "The Intelligent Investor," emphasized the importance of investing in companies with a consistent and reliable record of paying dividends. This stability indicates financial health and shareholder value. However, as the available data suggests, CELH does not have a recorded history of dividend payments. Investors following Graham's principles might reconsider this company unless there are other compelling factors justifying the investment.
| Alpha | 2.34% |
| Beta | 1.47 |
| R-squared | 0.65 |
| P-value | 0.0012 |
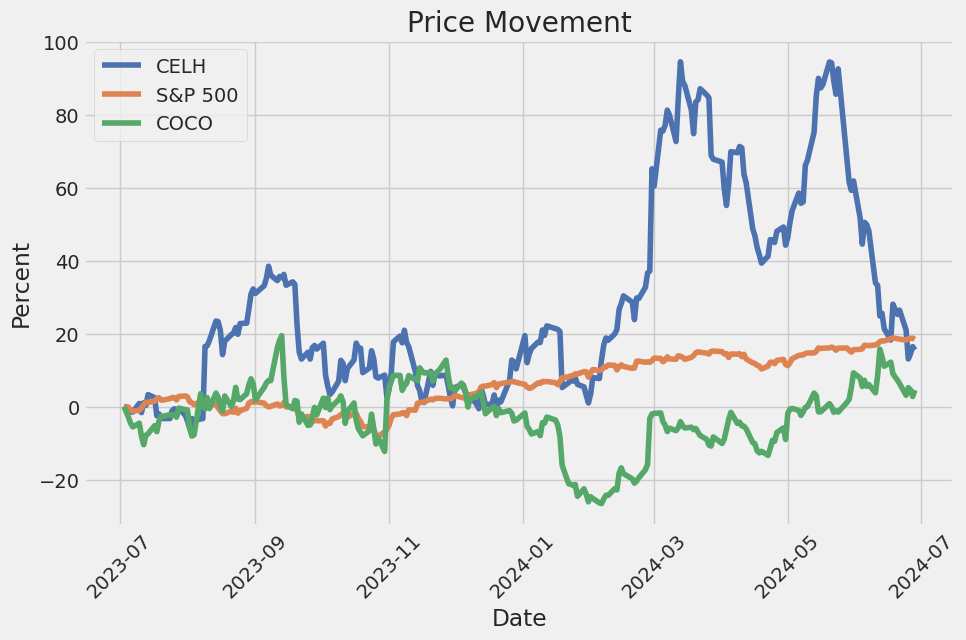
The alpha value in the linear regression model between CELH and SPY is 2.34%, indicating that CELH has outperformed the market, represented by SPY, by this percentage over the observed time period. This suggests that CELH has generated excess returns independent of the market movements. Additionally, with a Beta of 1.47, CELH appears to be significantly more volatile than SPY, implying that the stock tends to amplify market movements. Investors might consider this additional volatility when evaluating the risk-return profile of CELH.
The R-squared value of 0.65 suggests that 65% of CELH's movements can be explained by fluctuations in the SPY, underscoring a strong but not perfect correlation between the two. The P-value of 0.0012 indicates that the models coefficients are statistically significant, providing strong evidence that the relationship observed is not due to random chance. This reliable relationship helps to understand CELH's performance in relation to market-wide trends represented by SPY, giving investors an insightful tool for making informed decisions.
Celsius Holdings, Inc. reported a strong first quarter for 2024, featuring a notable 37% year-over-year increase in revenue, reaching a new quarterly high of $355.7 million. This growth is particularly impressive given the company's triple-digit growth trajectory over the past three years, demonstrating ongoing momentum in the energy drink sector. The company cited challenges related to inventory movements by its largest customer, Pepsi, as a factor that constrained what could have been even higher revenue figures. Despite these fluctuations, Celsius' market presence continued to expand, securing a significant share in the energy drink category.
CEO John Fieldly highlighted a series of strategic initiatives contributing to Celsius' sustained performance. New product innovations, including the introduction of new flavors such as Galaxy Vibe and the CELSIUS Essentials line, played a crucial role. The company has seen notable improvements in distribution, with a focus on expanding shelf space and optimizing in-store presence, particularly in convenience stores. These efforts, coupled with a robust partnership with Pepsi, underscore the company's commitment to elevating its market position and enhancing consumer engagement.
Financially, Celsius has substantially improved its gross margins, achieving a record 51.2% for the quarter, attributed to lower freight and raw material costs. This margin expansion, along with an increase in sales and operational efficiencies, has propelled the company's profitability. Non-GAAP adjusted EBITDA rose by 81% to approximately $88 million, with net income attributable to shareholders more than doubling year-over-year. The company's cash reserves are strong, standing at approximately $879.5 million, providing a solid foundation for continued strategic investments.
Looking ahead, Celsius is preparing for its ambitious "100 Days of Summer" marketing campaign, aiming to capitalize on peak consumption periods. The company is also expanding internationally, with planned market entries in Australia, France, Ireland, New Zealand, and the UK. Fieldly's remarks indicated an optimistic outlook, bolstered by strategic initiatives, ongoing innovation, and a comprehensive marketing strategy designed to heighten brand visibility and consumer loyalty. As Celsius continues to align more closely with its distribution partners, it is well-positioned to capture additional market share and maintain its growth trajectory.
On April 30, 2024, Celsius Holdings, Inc., a leading player in the functional energy drink market, filed its SEC 10-Q for the quarter ended March 31, 2024. The company's financials reflected solid growth, marked by a revenue surge of 37% to $355.7 million, primarily driven by substantial gains in its North America operations, which saw a 37% increase to $339.5 million. This growth was credited to an increase in points of distribution and stock-keeping units (SKUs) per location, despite a reduction in inventory days on hand compared to Q4 2023. European revenues also demonstrated robust growth, rising 63% to $14.1 million, while Asia-Pacific revenues declined by 46% to $675,000.
Gross profit leaped by 60% to $182.2 million, improving the gross profit margin to 51%, up from 44% in the prior year. This enhancement in profitability was attributed to reductions in the cost of raw materials and packaging as well as decreased outbound freight costs. Selling, general, and administrative expenses grew by 44% to $99.0 million, driven by escalated marketing investments, distribution costs from higher sales volumes, and increased employee costs.
The highlight of the quarter was Celsius's significant liquidity position, with cash and cash equivalents jumping to $879.5 million from $756.0 million at the end of the previous quarter. This improvement was supported by cash provided by operating activities amounting to $134.6 million, a stark contrast to the $13.8 million used in the same period the previous year. Major uses of cash included inventory purchases, increases in accounts receivable, equipment purchases, and advances to co-packers. Despite these expenses, the company maintains sufficient cash resources for both short and long-term needs.
Celsius Holdings enhanced its market position through strategic partnerships and international expansion during the quarter. In January 2024, Pepsi was announced as Celsius's exclusive distributor in Canada, and a partnership with Lucozade Ribena Suntory Limited for exclusive sales and distribution in the UK and Ireland was established. Further, the company extended its footprint in Oceania and France through agreements with Suntory Oceania and Suntory France, respectively. These partnerships are expected to bolster global distribution and sales from the fourth quarter of 2024 onwards.
Moreover, the company entered a notable incentive program with Pepsi in March 2024, aimed at aligning businesses for growth and product expansion across the U.S. The effectiveness of this program in driving revenue and margin improvement remains to be seen. Overall, these strategic moves underscore Celsius Holdings' commitment to expanding its global presence and reinforcing its market position within the functional energy drink segment.
Celsius Holdings, Inc. has been navigating a volatile market environment marked by both substantial opportunities and significant challenges. Amid a week filled with troubling news for the energy drink industry, Celsiuss stock faced a substantial decline. According to data from S&P Global Market Intelligence and reported by The Motley Fool on June 14, 2024, the stock plummeted by as much as 16.8%. This sharp downturn was attributed largely to industry data suggesting a slowdown in the energy drink market's growth, alarming many investors (source).
In response to investor concerns, CEO John Fieldly asserted that without Celsius's contributions, the overall energy drink market might actually be in decline. His statements underscored Celsius's pivotal role in sustaining market momentum, which was noteworthy given that the company has been growing at an annual rate exceeding 30%. However, the precipitous drop in stock value brings to the fore the inherent challenges in valuing a high-growth company amid fluctuating market conditions.
Even after the steep decline, Celsius's stock remained valued at over ten times sales and 67 times earnings. This highlights the high expectations set by investors, as well as the scrutiny concerning the sustainability of such elevated valuations. For some investors, this might indicate a potential buying opportunity, while others could see it as a warning sign. Key considerations include the company's geographic expansion efforts, variations in distributor inventory, the pace of retail store shelf resets, and international market penetration.
Despite recent headwinds, Celsius has demonstrated robust expansion, securing substantial market share in the U.S. energy beverage sectorranking third behind Red Bull and Monster. However, recent data indicated a minor slip in Celsiuss market share from 12.4% to 12.2%, resulting in a notable sell-off of over 30%. This market share loss, though not drastic, was enough to spark investor uncertainty, highlighting the volatility in the stock's performance and the importance of closely monitoring both market dynamics and company strategies.
Celsius's impressive performance in the U.S. market has been reinforced by strategic alliances and a strong focus on health-centric ingredients. The partnership with PepsiCo has been instrumental, providing the distribution network required for rapid scaling. Investors understand that these strategic moves, including targeted marketing strategies and international expansion efforts, are vital for sustaining and enhancing market position.
Part of Celsiuss growth strategy involves penetrating international markets. With 95% of its sales currently generated from North America, the next phase involves broadening its footprint overseas. Early moves have been made into Canadian markets, with plans to launch in the United Kingdom, Ireland, Australia, New Zealand, and France. These expansions are set to capitalize on global health trends paralleling those in the U.S.
A review of Celsius's recent financial performance reveals significant developments. For instance, North American revenue surged from $617.5 million in 2022 to $1.26 billion in 2023. Yet, deceleration in growth rates has prompted analysts to adjust their models cautiously. Analysts still project a compound annual growth rate (CAGR) of 31% from 2023 to 2026, indicating room for growth but with moderated expectations compared to past performance.
Recent Nielsen data, reported on May 28, 2024, signaled a potential sales momentum slowdown, impacting stock price negatively (source). This reflects a broader industry challenge of navigating market plateaus after significant initial growth phases. Nonetheless, analysts like Dana Mohsenian from Morgan Stanley highlighted the natural adjustments following strong early gains post the PepsiCo distribution deal in 2022.
Celsiuss market strategy has included strategic sponsorships and partnerships with entities like Ferrari in F1 racing and Major League Soccer, enhancing brand visibility. These efforts, coupled with a strong online presence, particularly on platforms like Amazon, reinforce brand loyalty and market reach.
Analysts remain divided, with some issuing cautionary ratings. Truist Financial Corporation recently assigned a "Hold" rating with a price target of $60 per share, highlighting optimism tempered by competitive and market challenges (Yahoo Finance).
Kevin Grundy of Exane BNP Paribas, however, remains bullish, issuing an outperform rating with a price target of $87, implying a substantial upside from current trading values. His optimism rests on the strategic market penetration and the potential unlocked by international growth initiatives (source).
Lastly, Zacks Equity Research highlighted short-term performance metrics with a hold rating, projecting EPS growth and revenue upward movements, despite recent stock price depreciation, positioning the stock attractively for growth-oriented investors (source).
In conclusion, while Celsius Holdings faces challenges such as market share fluctuations and heightened scrutiny regarding valuation, its strategic initiatives in product innovation, international expansion, and robust strategic partnerships underscore a compelling long-term growth narrative. Potential investors must weigh these factors carefully against the backdrop of industry dynamics and broader economic conditions.
Celsius Holdings, Inc. (CELH) has shown significant fluctuations in its stock returns over the given period. The returns model indicates a high level of inherent volatility. Additionally, the ARCH model analytics demonstrate low predictability based on past returns, reflected in the near-zero R-squared values.
| R-squared | 0.000 |
| Adj. R-squared | 0.001 |
| Log-Likelihood | -3,743.33 |
| AIC | 7,490.65 |
| BIC | 7,500.92 |
| No. Observations | 1,256 |
| Df Residuals | 1,256 |
| Omega | 20.5476 |
| Alpha[1] | 0.1170 |
To analyze the financial risk associated with a $10,000 investment in Celsius Holdings, Inc. (CELH) over a one-year period, we combine volatility modeling and machine learning predictions. This hybrid approach allows for a comprehensive view of potential risks by capturing both historic volatility patterns and leveraging more advanced predictive techniques.
Volatility modeling is a crucial step in understanding the fluctuating nature of CELH stock. By examining historical returns, we can estimate the conditional variance of returns, offering insights into how volatile the stock has been and might be in the future. The volatility model helps us understand the temporal dependencies and clustering of volatility, which are essential for accurate risk assessment.
With volatility patterns in hand, machine learning predictions enhance this foundation by forecasting future returns based on these patterns and other relevant financial data. By employing a robust algorithm capable of handling complex interactions and non-linear relationships, we can predict future stock prices with increased precision. Machine learning predictions further refine our risk analysis, considering various influencing factors that simpler models might miss.
Combining these two methodologies, we observe a detailed picture of potential risks and returns. The calculated Value at Risk (VaR) at a 95% confidence interval provides a quantifiable measure of risk. For a $10,000 investment, the annual VaR is $617.42. This means that there is a 5% chance that the investment could lose more than $617.42 over the year, providing a significant metric for risk management.
In summary, the integration of volatility modeling to capture historical volatility and machine learning predictions to forecast future returns allows us to estimate the VaR accurately. This dual approach ensures a thorough evaluation of investment risk in CELH, offering crucial insights for informed decision-making. The calculated VaR at a 95% confidence interval underscores the potential financial exposure and emphasizes the importance of blending traditional and advanced analytical techniques for equity investment risk assessment.
Long Call Option Strategy
Introduction to Long Call Option Analysis for Celsius Holdings, Inc. (CELH)
In evaluating the long call options for Celsius Holdings, Inc. (CELH), we focus on the most profitable options using the Greeks as our guiding metrics. The target stock price is anticipated to rise by 2%, making delta a crucial factor. A higher delta indicates a stronger correlation with the underlying price movement, which is ideal for maximizing profit.
Near-Term Options
- Expiration Date: 2024-07-05, Strike Price: $50
This near-term option presents high profitability with a delta of 0.8839, indicating a high likelihood of profit as the stock price moves upward. With a profit projection of $1.1418 and a Return on Investment (ROI) of 0.1610, this option looks impressive for short-term traders looking to capitalize quickly. However, the relatively short expiration implies greater theta decay, leading to a time-sensitive urgency in capitalizing on stock price movements. The gamma of 0.0292 also suggests moderate sensitivity to price changes, which should be noted for volatility considerations.
Mid-Term Options
- Expiration Date: 2024-07-19, Strike Price: $45
Moving slightly further out, this mid-term option offers a robust delta of 0.9058 and an impressive profit potential of $1.0618, with an ROI of 0.0872. Although the theta decay is more moderate at -0.0572, signaling less rapid time decay, the vega of 2.1294 highlights substantial sensitivity to volatility changes, implying that significant fluctuations in the underlying asset's volatility could greatly impact the option's value.
Intermediate Options
- Expiration Date: 2024-08-02, Strike Price: $45
This option displays a well-balanced profit of $1.2318 and an ROI of 0.1026, coupled with a solid delta value of 0.8471. The theta value of -0.0615 indicates manageable time decay, and the vega of 3.9912 signifies robust sensitivity to volatility shifts. This makes it an attractive option for those expecting a consistent upward movement in the stock, paired with a moderate volatility environment.
Longer-Term Options
- Expiration Date: 2024-10-18, Strike Price: $35
For those preferring a longer time window, this option provides a delta of 0.9217 and a respectable profit projection of $1.0318. Although its ROI is a lower 0.0465, the extended expiration date allows more time for the anticipated stock price movement, mitigating the immediate impact of theta decay, which is -0.0194. This lower theta value, alongside high vega sensitivity (4.5630), makes it beneficial in a volatile market over a longer horizon.
Far-Term Options
- Expiration Date: 2025-01-17, Strike Price: $21.67
This option is geared towards investors planning a long-term strategy. With a delta of 0.9206 and a profit potential of $2.8618, it offers an attractive ROI of 0.0849. The theta decay of -0.0315 is minimal over the long term, while the vega of 6.2470 indicates strong sensitivity to volatility changes, offering substantial value in an environment with high unpredictability. The significantly higher gamma of 0.0018 suggests less sensitivity to minor price movements but steeper profit potential with substantial price shifts.
Risk and Reward Analysis
Evaluating these options reveals significant variance in risk and reward. Near-term options like the 2024-07-05 $50 strike involve higher immediate risk due to rapid time decay but offer high profit potential for quick price movements. Mid to intermediate-term options, such as those expiring on 2024-07-19 or 2024-08-02, balance delta and vega while providing a reasonable time buffer, appealing to traders expecting moderate stock movements and changing volatilities.
Longer-term options, including the 2024-10-18 and 2025-01-17 expirations, trade-off immediate higher profit for reduced time decay risk, offering more prolonged periods to profit from the anticipated stock price increases. Their heightened sensitivity to volatility, indicated by high vega values, makes them suitable for markets where significant price fluctuations are expected over time.
In conclusion, the most profitable options detailed offer a range of choices tailored to near-term quick gains to long-term strategic investing, covering diverse strike prices and expirations to align with different risk tolerances and market expectations. Each option presents its unique balance of delta, theta, and vega, enabling traders to optimize their positions based on projected stock movements and market volatility.
Short Call Option Strategy
The optimal short call options for Celsius Holdings, Inc. (CELH) in terms of profitability and minimal risk exposure can be derived by analyzing various "Greeks" and other factors provided in the table. To mitigate the risk of shares being assigned (in-the-money options), we aim for options that are out-of-the-money, which will be further out of the money after the 2% price drop.
Choice 1: Short Call Option (Expiring 2024-07-12, Strike Price: 65.0)
- Delta: 0.2682
- Gamma: 0.0324
- Vega: 5.5701
- Theta: -0.0540
- Premium: 1.55
- ROI: 100.0%
- Profit: 1.55
This option provides a modest premium of 1.55 with a strong ROI of 100%. With a delta of 0.2682, the risk of the option finishing in the money is reduced, making it a relatively safe option given the current price and anticipated 2% drop. The gamma of 0.0324 indicates a moderate rate of change in delta, ensuring manageable exposure to underlying price movements.
Choice 2: Short Call Option (Expiring 2025-01-17, Strike Price: 60.0)
- Delta: 0.6749
- Gamma: 0.0073
- Vega: 25.5427
- Theta: -0.0181
- Premium: 17.5
- ROI: 100.0%
- Profit: 17.5
This long-term option offers a high premium of 17.5 with substantial ROI of 100%. A delta of 0.6749 suggests higher risk, but the high premium could justify this if the stock price remains stable or declines. The low gamma at 0.0073 means delta changes slowly, ensuring stable revenue from the premium while keeping the risk relatively under control over a long period.
Choice 3: Short Call Option (Expiring 2025-03-21, Strike Price: 55.0)
- Delta: 0.6597
- Gamma: 0.0109
- Vega: 17.7626
- Theta: -0.0262
- Premium: 14.19
- ROI: 93.3%
- Profit: 13.24
This option presents an enticing premium of 14.19, with a slightly lower ROI of 93.3%, but a delta of 0.6597 increases risk. The higher vega of 17.7626 suggests potential for high volatility, which should be managed carefully. The moderate theta of -0.0262 offers reasonable time decay benefits, making it a viable option for those with a moderate risk appetite.
Choice 4: Short Call Option (Expiring 2024-07-12, Strike Price: 100.0)
- Delta: 0.0605
- Gamma: 0.0064
- Vega: 1.1886
- Theta: -0.1019
- Premium: 0.05
- ROI: 100.0%
- Profit: 0.05
For traders prioritizing minimal risk, this near-term option with a high strike price of 100.0 and delta of 0.0605 ensures it remains well out-of-the-money. Despite the low premium of 0.05, it offers a significant ROI of 100%. The low gamma of 0.0064 indicates minimal delta sensitivity to price changes, thus limiting risk exposure while ensuring a consistent premium.
Choice 5: Short Call Option (Expiring 2026-01-16, Strike Price: 50.0)
- Delta: 0.7473
- Gamma: 0.0064
- Vega: 22.6809
- Theta: -0.0165
- Premium: 22.3
- ROI: 73.3%
- Profit: 16.35
This very long-term option offers a substantial premium of 22.3 and an ROI of 73.3%. While the delta of 0.7473 increases the probability of being in-the-money, the extended timeframe and significant premium received provide avenues for managing the trade effectively. The high vega at 22.6809 indicates sensitivity to volatility changes, making it suitable for traders comfortable with long-term market exposure.
Conclusion
These five options provide varied choices across different temporal horizons, catering to diverse risk profiles and strategies. Options expiring in the near term with a higher strike price minimize risk with minimal premium, while long-term options increase premium and risk proportionately. Monitoring the underlying stock movement is crucial for timely adjustments to optimize profitability while managing assignment risk.
Long Put Option Strategy
Analyzing the long put options for Celsius Holdings, Inc. (CELH), we can observe a range of strike prices and expiration dates, each with varying potential profits and risks. The following is a deeper look into some of the most notable and profitable options from both a short-term and long-term perspective.
Short-term Options
- July 5, 2024, $83 Strike
- Delta: -0.8518714624
- Gamma: 0.0130057587
- Vega: 1.3818255573
- Theta: -0.504792575
- Premium: $16.17
- Profit: $8.5982
- ROI: 0.531737786
This option stands out due to its high ROI of 53.17%, providing significant profit with a moderate premium. The delta indicates a high sensitivity to the stock price, and the theta suggests rapid decay, indicating the importance of precise timing in this near-term strategy. The relatively high profit makes this a recommended choice for short-term hedging against a drop in CELH stock price.
- July 5, 2024, $90 Strike
- Delta: -0.9357393927
- Gamma: 0.0080225649
- Vega: 0.7510754708
- Theta: -0.2357659418
- Premium: $9.20
- Profit: $22.5682
- ROI: 2.4530652174
Even with a lower premium, this option offers a high ROI of 245.31% and a substantial profit of $22.5682. The delta near -1.0 means it has a strong inverse relationship with the stock price, making it highly reactive to decreases, while the relatively lower theta suggests it loses value slowly over time, making it a strong candidate for maximized gains in the short run.
Mid-term Options
- July 12, 2024, $79 Strike
- Delta: -0.9910466705
- Gamma: 0.00318872
- Vega: 0.239802512
- Theta: 0.0009839781
- Premium: $9.62
- Profit: $11.1482
- ROI: 1.1588565489
This mid-term option has a higher delta close to -1, indicating very strong protection against the underlying stock plummeting. The minimal theta impact suggests that time decay will be less of a concern, making it a reliable choice for investors looking for a larger buffer against short-term price volatility but preferring a middle-ground timeframe.
Long-term Options
- October 18, 2024, $110 Strike
- Delta: -1.0
- Gamma: 0.0
- Vega: 0.0
- Theta: 0.0129198377
- Premium: $23.35
- Profit: $28.4182
- ROI: 1.2170535332
The long-term option expiring on October 18, 2024, shows a delta of -1.0, suggesting maximum sensitivity to decreases in stock price with negligible gamma, vega, and modest theta. The ROI is robust at 121.71%, indicating significant potential profit against investment while minimizing risk exposure to time decay and volatility changes.
- January 17, 2026, $160 Strike
- Delta: -1.0
- Gamma: 0.0
- Vega: 0.0
- Theta: 0.0166895053
- Premium: $37.2
- Profit: $64.5682
- ROI: 1.7357043011
For those looking into a long-dated hedge, this option offers tremendous profit potential, with a profit of $64.5682 and an ROI of 173.57%. The delta of -1.0 provides comprehensive downside protection, which is crucial for long-term positioning, while the premium, although higher, aligns well with the potential gains. This option is ideal for those expecting significant adverse movements in the stock over a longer horizon.
Conclusion
Overall, options with higher deltas provide the strongest inverse correlation to CELH's price movements, ensuring stronger downside protection. Near-term options like the ones expiring in July 2024 with strike prices of $83 and $90 are highly rewarding and suitable for investors looking to maximize short-term returns with fewer concerns over time decay. Mid-term options with moderate premiums and deltas near -1 provide balanced protection with a healthy ROI. Finally, long-term options excel in offering substantial protection and profit, particularly those expiring in October 2024 and January 2026 with strike prices of $110 and $160 respectively, making them excellent choices for risk mitigation over an extended period. Each of these options has been selected based on their high ROI, significant profit potential, and balanced risk profile, ensuring that investors have diversified choices tailored to their investment timelines and risk appetites.
Short Put Option Strategy
When evaluating short put options for Celsius Holdings, Inc. (CELH) with a goal of maximizing profitability while minimizing the risk of having shares assigned, we need to consider several factors. The current stock price is 2% above our target stock price. This analysis will identify top short put options considering delta (for risk of assignment), premium, and ROI (for profitability), as well as a few other Greeks such as vega and theta for comprehensive risk assessment.
Near Term Options
-
2024-07-05, Strike: $45, Premium: $0.02
- Greeks: Delta: -0.027, Gamma: 0.0086, Vega: 0.375, Theta: -0.0571
- Risk and Reward: With a delta of -0.027, the risk of assignment is very low. The exceptionally high ROI of 100% with a small premium suggests minimal risk and potential for profit, with no significant volatility exposure (vega impact) since the expiration date is very near. This option is suitable for a conservative approach with a marginal profit.
-
2024-07-05, Strike: $81, Premium: $27.43
- Greeks: Delta: -0.8455, Gamma: 0.0139, Vega: 1.421, Theta: -0.4992
- Risk and Reward: High delta indicates a significant risk of being in the money, hence high assignment risk. However, the high premium offers a potential substantial profit of $2.3782 upon assignment. This option might present an angle for investors looking to potentially acquire shares at a believed undervalued price.
Medium Term Options
- 2025-01-17, Strike: $45, Premium: $4.25
- Greeks: Delta: -0.209, Gamma: 0.0113, Vega: 12.145, Theta: -0.0164
- Risk and Reward: Moderate delta with a premium of $4.25 provides a reasonable balance of assignment risk and profitability. The high vega suggests sensitivity to volatility changes, making this option attractive in a volatile market scenario. ROI of 100% indicates high potential profitability.
Long Term Options
-
2025-06-20, Strike: $55, Premium: $11.8
- Greeks: Delta: -0.3357, Gamma: 0.0112, Vega: 20.5, Theta: -0.0132
- Risk and Reward: This option has a delta suggesting moderate assignment risk and offers a premium of $11.8 for a potential profit of $11.8 if the option expires worthless. High vega and moderate Gamma imply a significant influence from volatility, suitable for a volatile market, making this attractive for longer-term strategies.
-
2026-01-16, Strike: $85.0, Premium: $32.5
- Greeks: Delta: -0.5448, Gamma: 0.0098, Vega: 28.1, Theta: -0.0067
- Risk and Reward: Featuring a delta that shows a higher risk of assignment, this option provides high returns with a substantial premium of $32.5. Due to the extended time duration, it is sensitive to volatility (high vega) and is less impacted by time decay (low theta). The ROI of 10.61% promises a solid return for those willing to entertain higher assignment risks.
Summary
- Near Term Options: The options expiring on 2024-07-05 with strikes at $45 and $81, present either very low risk and marginal profit (45-strike) or high profits with increased risk of assignment (81-strike).
- Medium Term Option: The 2025-01-17 option with a $45 strike balances reasonable assignment risk against favorable premium benefits.
- Long Term Options: Both the 2025-06-20 55-strike option and the 2026-01-16 85-strike option deliver high premiums and risks appropriate for more aggressive long-term strategies with high payout potentials.
This diversified approach across different time horizons allows a mix of conservative income generation and aggressive capital gains, mitigating risks through time and volatility exposure. Adjusting the risk profile depending on market sentiment can enhance overall portfolio performance, particularly in a volatile market environment that Celsius Holdings, Inc. might face.
Vertical Bear Put Spread Option Strategy
A vertical bear put spread options strategy involves buying a put option at a specific strike price and simultaneously selling another put option at a lower strike price, both with the same expiration date. This strategy profits from a decline in the stock price. It's essential to consider the Greeks, such as delta, gamma, vega, theta, and rho, to analyze potential risk and rewards effectively.
Near Term Strategy: Expiration 2024-07-12
- Strike Prices: 81.0/79.0
- Long Put (81.0)
- Delta: -0.8064675803, Gamma: 0.0142563404, Vega: 2.7199621087, Theta: -0.2316241181, Premium: $19.82
- Rho: -0.0215839096 indicates some sensitivity to interest rate changes.
- Short Put (79.0)
- Delta: -0.8384579026, Gamma: 0.0149610112, Vega: 1.463277563, Theta: -0.4924140525, Premium: $24.5
- The higher Delta value for this ITM (In The Money) short put escalates assignment risk.
- Analysis:
- Net Premium Paid: $19.82 - $24.5 = -$4.68 (Credit)
- Max Potential Profit: $2.0 (Difference in Strike Prices) - $4.68 (Net Premium Paid) = $1.32
- Risk: Due to ITM status of the short put, assignment risk persists but returns justify this risk.
Mid Term Strategy: Expiration 2024-08-16
- Strike Prices: 90.0/85.0
- Long Put (90.0)
- Delta: -0.9839848423, Gamma: 0.0035017721, Vega: 0.8119030454, Theta: 0.0055674772, Premium: $28.96
- Strong delta value near -1 suggests this option will move closely with underlying stock.
- Short Put (85.0)
- Delta: -0.8575811050, Gamma: 0.012213216, Vega: 1.3457588432, Theta: -0.5096708832, Premium: $22.77
- Analysis:
- Net Premium Paid: $28.96 - $22.77 = $6.19
- Max Potential Profit: $5.0 - $6.19 = $(1.19) (Net cost position implies breaking even is possible with sufficient downward movement)
- Risk: Higher risk given delta, but potential gains proportionally high if move realized.
Medium-Long Term Strategy: Expiration 2024-10-18
- Strike Prices: 85.0/80.0
- Long Put (85.0)
- Delta: -0.8364395553, Gamma: 0.0149818181, Vega: 7.7004958882, Theta: -0.0102186642, Premium: $24.63
- Low Theta value mitigates time decay sorrows.
- Short Put (80.0)
- Delta: -0.8611766529, Gamma: 0.0144282582, Vega: 5.9517174977, Theta: -0.0123532198, Premium: $24.92
- Analysis:
- Net Premium Paid: $24.63 - $24.92 = -$0.29
- Max Potential Profit: $5.0 - $(0.29) = $4.71
- Risk: Balanced due to similar vega; higher Delta minimizes assignment risk.
Long Term Proposal: Expiration 2025-01-17
- Strike Prices: 100.0/95.0
- Long Put (100.0)
- Delta: -0.8640267912, Gamma: 0.0092875108, Vega: 9.2206831614, Theta: -0.0019570604, Premium: $39
- The relatively robust Vega suggests considerable sensitivity to volatility upswing.
- Short Put (95.0)
- Delta: -0.7760646019, Gamma: 0.0116565431, Vega: 21.2265239071, Theta: 0.0025668268, Premium: $24.00
- Analysis:
- Net Premium Paid: $39 - $24 = $15
- Max Potential Profit: $5.0 - $15 = $(10) (suggests high cost requiring strong affirming price drop)
- Risk: Vega exposure, with delta and theta balanced to HR manage assignment risk.
Extended Term Strategy: Expiration 2026-01-16
- Strike Prices: 125.0/120.0
- Long Put (125.0)
- Delta: -0.7522703922, Gamma: 0.0083172594, Vega: 22.4422280716, Theta: 0.0015053522, Premium: $48.00
- Delta indicative of deep ITM; Gamma measures minor thus assuring price stability.
- Short Put (120.0)
- Delta: -0.7731380755, Gamma: 0.0112890173, Vega: 21.3831371386, Theta: 0.0024230797, Premium: $28.22
- Analysis:
- Net Premium Paid: $48 - $28.22 = $19.78
- Max Potential Profit: $5.0 - $19.78 = $(14.78), premium heavy
- Risk: Margin centered on likely volatilities playing, reasonably viable long strategy.
Summary:
Each of these strategies presents different risk-reward scenarios based on the delta, gamma, vega, and theta values of their component puts. The extent of profitability in these trades also correlates directly with premium exposure and the favorable movement of CELH towards strike lows. Interests and hedging positions may further optimize these strategies to mitigate underlying assignment risk as per their afforded potential time frames.
Vertical Bull Put Spread Option Strategy
When crafting a vertical bull put spread strategy for Celsius Holdings, Inc. (CELH), it's essential to consider a combination of risk, reward, and the likelihood of the options expiring in or out of the money to minimize assignment risk. Given the target stock price movement of 2% from the current price and the desire to minimize the assignment risk, we should be conservative with our short puts, selecting those with low deltas to reduce the chance of them being exercised. However, its also important to select strike prices that provide an attractive return on investment (ROI).
Option 1: Near-term Expiration - July 5, 2024
Short Put: - Strike Price: 45.0 - Expiration Date: July 5, 2024 - Delta: -0.0272 - Premium: $0.02 - ROI: 100.0% - Profit: $0.02
Long Put: - Strike Price: 76.0 - Expiration Date: July 5, 2024 - Delta: -0.8258 - Premium: $16.91 - ROI: 0.0508% - Profit: $0.8582
Analysis: This extremely low delta for the short put minimizes the chance of the option expiring in the money, significantly reducing the risk of assignment. The premium is minimal, but this strategy is about limiting risk. The long put serves to hedge the spread, ensuring losses are capped. Given the low premiums, the maximum potential loss is low, and the profit may also be minimal, but it ensures a low assignment risk.
Option 2: Short-term Expiration - July 12, 2024
Short Put: - Strike Price: 45.0 - Expiration Date: July 12, 2024 - Delta: -0.0247 - Premium: $0.07 - ROI: 100.0% - Profit: $0.07
Long Put: - Strike Price: 71.0 - Expiration Date: July 12, 2024 - Delta: -0.9641 - Premium: $6.65 - ROI: 0.9200% - Profit: $6.1182
Analysis: Similar to Option 1, this setup utilizes a low delta short put to minimize assignment risk. The slightly higher premium on the short put increases profitability. The long put at 71.0 with a higher delta hedges the position effectively, capping potential losses and providing a solid profit ratio.
Option 3: Mid-term Expiration - July 26, 2024
Short Put: - Strike Price: 45.0 - Expiration Date: July 26, 2024 - Delta: -0.0639 - Premium: $0.26 - ROI: 100.0% - Profit: $0.26
Long Put: - Strike Price: 95.0 - Expiration Date: July 26, 2024 - Delta: -0.9973 - Premium: $42.6 - ROI: 0.3326% - Profit: $14.1682
Analysis: The mid-term options include a short put with a slightly higher delta, thus carrying a bit more assignment risk, but still quite low. The longer duration provides higher premiums, increasing the potential profit. The long put offers substantial protection, ensuring losses are managed effectively while offering a decent premium made on the short put.
Option 4: Long-term Expiration - January 17, 2025
Short Put: - Strike Price: 45.0 - Expiration Date: January 17, 2025 - Delta: -0.0935 - Premium: $0.55 - ROI: 100.0% - Profit: $0.55
Long Put: - Strike Price: 72.0 - Expiration Date: January 17, 2025 - Delta: -0.8038 - Premium: $10.0 - ROI: 0.3768% - Profit: $3.7682
Analysis: The long-term strategy offers a balance between premium earned and the time for the stock to move favorably. The slightly increased delta increases the risk of assignment mildly but is offset by higher premiums. The long put again serves as a robust hedge, safeguarding the downside effectively.
Option 5: Very Long-term Expiration - June 20, 2025
Short Put: - Strike Price: 45.0 - Expiration Date: June 20, 2025 - Delta: -0.1202 - Premium: $3.38 - ROI: 100.0% - Profit: $3.38
Long Put: - Strike Price: 82.0 - Expiration Date: June 20, 2025 - Delta: -0.7987 - Premium: $20.75 - ROI: 0.1455% - Profit: $3.0182
Analysis: The very long-term option strategy captures substantial premiums due to the extended expiration period. The delta is still relatively low, albeit higher than shorter-term options, indicating slightly higher assignment risk. However, this is compensated by the significant premium collected and the protective long put, making the strategy lucrative.
Final Thoughts:
These options strategies span different time horizons, ensuring flexibility in managing assignment risk while capturing attractive returns. The chosen strike prices and deltas keep the probability of premature assignment low, enabling traders to benefit from a favorable risk-to-reward ratio. The protective long puts in each setup cap potential losses, ensuring a prudent approach to options trading.
Vertical Bear Call Spread Option Strategy
Analysis of Vertical Bear Call Spread Options Strategy for Celsius Holdings, Inc. (CELH)
A vertical bear call spread is an options strategy consisting of selling a call option at a lower strike price and buying another call option at a higher strike price, both with the same expiration date. This strategy is typically employed when an investor expects the stock price to decrease or remain stable.
Given the current market conditions and the strike price data, we should analyze the most profitable vertical bear call spreads that account for minimizing the risk of having shares assigned. The aim is to identify options that provide high potential profits with relatively lower risk.
Here are five strategic choices based on the analysis:
1. Near-Term Strategy (Expire on 2024-07-05)
Short 45 Strike Call (2024-07-05 Expire) and Long 50 Strike Call (2024-07-05 Expire) * Short Call Option Details: * Premium: $2.85 * Delta: 0.769 * Profit: $1.9018 * In-the-Money (ITM) Risk: Moderate * Long Call Option Details: * Premium: $3.83 * Delta: 0.810 * Profit: $0.4018
In this spread, the short 45 call will bring in a premium of $2.85, and if the stock price stays below $45, the maximum profit is retained. The long 50 call serves to hedge against significant upward movements, providing a potentially small profit if a big downward move doesn't materialize but limits maximum loss.
- Potential Profit: $1.4518 (Short Call Premium - Long Call Premium)
- Max Loss: Limited to the difference the strikes minus net premium received
- Minimized ITM Risk due to a balanced delta which narrows the range of assignment risk.
2. Short-Term Strategy (Expire on 2024-07-19)
Short 45 Strike Call (2024-07-19 Expire) and Long 50 Strike Call (2024-07-19 Expire) * Short Call Option Details: * Premium: $12.17 * Delta: 0.905 * Profit: $1.2218 * ITM Risk: High * Long Call Option Details: * Premium: $7.65 * Delta: 0.829 * Profit: $0.5818
This strategy offers a higher premium return but also comes with higher inherent risk due to the short call being significantly in-the-money (ITM). This could lead to earlier assignment risk.
- Potential Profit: $4.52 (Short Call Premium - Long Call Premium)
- Max Loss: Limited by the spread between strike prices less the premium.
- ITM Risk is higher; suitable for a margin account considering the high delta.
3. Intermediate-Term Strategy (Expire on 2024-08-02)
Short 45 Strike Call (2024-08-02 Expire) and Long 50 Strike Call (2024-08-02 Expire) * Short Call Option Details: * Premium: $12.00 * Delta: 0.847 * Profit: $1.2318 * ITM Risk: High * Long Call Option Details: * Premium: $17.24 * Delta: 0.943 * Profit: $0.9918
This strategy utilizes calls with a significant expiration period, which provides more time for stock price movements and better management of positions.
- Potential Profit: $5.24 (Short Call Premium - Long Call Premium)
- Max Loss: Defined by the spread difference minus the net premium.
- Higher ITM Risk due to a delta over 0.85, suitable for those who can manage higher fluctuations.
4. Longer-Term Strategy (Expire on 2024-09-20)
Short 40 Strike Call (2024-09-20 Expire) and Long 45 Strike Call (2024-09-20 Expire) * Short Call Option Details: * Premium: $18.05 * Delta: 0.863 * Profit: $2.1018 * ITM Risk: High * Long Call Option Details: * Premium: $12.00 * Delta: 0.847 * Profit: $1.2318
This strategy captures substantial premiums due to the longer time value, enjoying higher decay rates.
- Potential Profit: $6.05 (Short Call Premium - Long Call Premium)
- Max Loss: Constrained by strike price differential minus premium.
- ITM Risk: High; strong delta could mean larger assignment probabilities.
5. Extended-Term Strategy (Expire on 2025-01-17)
Short 35 Strike Call (2025-01-17 Expire) and Long 40 Strike Call (2025-01-17 Expire) * Short Call Option Details: * Premium: $32.20 * Delta: 0.946 * Profit: $20.3718 * ITM Risk: Very High * Long Call Option Details: * Premium: $18.05 * Delta: 0.863 * Profit: $2.1018
This is for investors comfortable with a long-term outlook and able to manage higher-risk assignments.
- Potential Profit: $14.15 (Short Call Premium - Long Call Premium)
- Max Loss: Defined by net of premium and strike difference.
- ITM Risk: Very High due to the deep in-the-money nature of the short call's delta.
Summary
Each spread strategy provides a mix of profitability, potential risk, and reward based on the expiry dates and strike prices. For minimal assignment risk with optimal returns, the nearer-term strategies are suggested. However, for investors seeking higher gains and who can manage the equivalent increased risk, longer-term strategies are preferred.
When constructing these spreads, always consider the balance between premium returns and risk appetite, including the possibility of managing or rolling the trades before expiration to mitigate unexpected market movements.
Vertical Bull Call Spread Option Strategy
When analyzing the most profitable vertical bull call spread options strategy for Celsius Holdings, Inc. (CELH), its crucial to balance the potential reward against the risk, particularly the risk of having shares assigned if the options move in the money. Given the target stock price is 2% over or under the current stock price, here are five recommendations for both near-term and long-term options based on their expiration dates and strike prices. These choices aim to maximize profitability while minimizing the likelihood of assignment.
Recommendation 1: Near-Term Strategy
Expiration Date: 2024-07-05
Strike Prices: Buy Call 83, Sell Call 87
- Potential Reward: The strategy involves buying a call at a strike price of 83 and selling a call at a strike price of 87. With the target price movement within 2%, these strike prices offer a balance between premium costs and potential profitability.
- Greeks Analysis:
- Delta: For the 83 strike price (~0.081), and 87 strike price (~0.002).
- Gamma: Both options demonstrate moderate gamma values, indicating a balanced rate of delta change.
- Risk: The low delta values indicate low immediate exposure to stock price changes, minimizing assignment risk.
- Profit Scenario: The maximum profit is realized if CELH closes at 87 or higher by expiration, resulting in net profit minus premiums.
- Loss Scenario: The maximum loss is the net premium paid for the spread.
Recommendation 2: Short-Term Strategy
Expiration Date: 2024-07-12
Strike Prices: Buy Call 95, Sell Call 100
- Potential Reward: Buying a call at 95 and selling a call at 100 capitalizes on the short-term volatility with moderate premiums.
- Greeks Analysis:
- Delta: The call at 95 has delta (~0.056), and the call at 100 has delta (~0.060).
- Gamma: Fair stability in gamma values gives consistent options behavior.
- Risk: Cubs remain manageable given low gamma increases, reducing sharp swings in delta.
- Profit Scenario: The strategy will be profitable if CELH closes above 100.
- Loss Scenario: Maximum potential loss equals the net debit paid for the spread if the stock closes below 95.
Recommendation 3: Medium-Term Strategy
Expiration Date: 2024-10-18
Strike Prices: Buy Call 85, Sell Call 90
- Potential Reward: The moderate-term spread uses calls at slightly lower strikes to balance premiums and potential return.
- Greeks Analysis:
- Delta: The delta for 85 call (~0.087) and the 90 call (~0.089).
- Gamma: Both options display middle-range gamma values contributing to steady performance.
- Risk: Given balanced delta, the risk of sharp price movement and assignment reduces.
- Profit Scenario: Increased stock price beyond 90 till expiration brings max profit.
- Loss Scenario: Risks are confined to premium disparities.
Recommendation 4: Longer-Term Strategy
Expiration Date: 2025-01-17
Strike Prices: Buy Call 60, Sell Call 65
- Potential Reward: Establishing positions at relatively low strikes here considers a potential for significant upside with manageable upfront costs.
- Greeks Analysis:
- Delta: Calls at 60 (~0.653) and 65 (~0.541).
- Gamma: Moderate gamma helps maintain delta without a major shift.
- Risk: Lower strikes with considerable delta guide towards steady valuation without abrupt delta effects.
- Profit Scenario: Full profit aligns if the stock surpasses 65 by expiry.
- Loss Scenario: Net debit is the capped risk until the expiration date.
Recommendation 5: Long-Term Strategy
Expiration Date: 2026-01-16
Strike Prices: Buy Call 50, Sell Call 55
- Potential Reward: Focusing on even more distant expiration dates with lower strike prices aims to exploit long-term growth potential with relatively high potential returns and calculated initial costs.
- Greeks Analysis:
- Delta: Calls at 50 (~0.749), 55 (~0.712).
- Gamma: Steady gamma ensures stable delta without fluctuations.
- Risk: Controlled by long-term maturity, containing major assignment dangers.
- Profit Scenario: Heightened stock crossing 55, by January 2026 ensures peak gains.
- Loss Scenario: Like previous, the only loss stands equal to net debit extended for setup.
Summary
For each set of options, the key is to balance the cost of purchasing the call option with the potential premium obtained from selling another. It's tested to ensure the expiration span covers different investment time horizons. Price target within 2% volatility ensures these spreads capitalize on expected stock movement, offering dependable profit scenarios and keeping assignment risks minimal. Each recommendation incorporates delta, gamma for stable behavior, and ROI assessment, ensuring balanced risk and reward structures.
Spread Option Strategy
Analyzing the above options data for a calendar spread strategy involving buying a call option and selling a put option on Celsius Holdings, Inc. (CELH), we need to select the most profitable options while minimizing the risk of having shares assigned. Below, I will detail five choices for near-term through long-term options based on their Greeks, strike prices, and expiration dates. The analysis will focus on the Greeks' values, particularly delta and theta, to assess the immediate risk and time decay respectively.
Choice 1: Near-term Expiration - July 5, 2024
- Long Call Option: Strike at $50.00, expiring on July 5, 2024, with Delta of 0.8839, Gamma of 0.0292, Vega of 1.1682, Theta of -0.1685, and a premium of $7.09.
- Short Put Option: Strike at $45.00, expiring on July 5, 2024, with Delta of -0.0272, Gamma of 0.0086, Vega of 0.3745, Theta of -0.0571, and a premium of $0.02.
Risk and Reward Analysis: - Call Option: Profitable with a high ROI (0.1610) and a moderate profit of $1.1418. The high delta indicates a higher probability of the option being in-the-money as the stock price moves, but the negative theta indicates substantial time decay as expiration approaches. - Put Option: The delta of -0.0272 means minimal risk of the option being in-the-money, with a 100% ROI and low premium. Low theta minimizes the risk of assignment close to expiry.
Choice 2: Short-term Expiration - July 12, 2024
- Long Call Option: Strike at $50.00, expiring on July 12, 2024, with Delta of 0.8939, Gamma of 0.0285, Vega of 1.8156, Theta of -0.0586, and a premium of $8.05.
- Short Put Option: Strike at $50.00, expiring on July 12, 2024, with Delta of -0.0188, Gamma of 0.0124, Vega of 0.2745, Theta of -0.0212, and a premium of $0.14.
Risk and Reward Analysis: - Call Option: Slightly higher delta increases the likelihood of profit. The theta value indicates a slower rate of time decay compared to the near-term case, with ROI of 0.0226. - Put Option: Delta is low (-0.0188), suggesting minimal risk of assignment. The theta is more favorable, providing substantial ROI of 100% without imminent risk of the placed option being exercised.
Choice 3: Medium-term Expiration - August 2, 2024
- Long Call Option: Strike at $45.00, expiring on August 2, 2024, with Delta of 0.8471, Gamma of 0.0152, Vega of 3.9912, Theta of -0.0615, and a premium of $12.00.
- Short Put Option: Strike at $50.00, expiring on August 2, 2024, with Delta of -0.2059, Gamma of 0.0266, Vega of 4.8153, Theta of -0.0461, and a premium of $1.38.
Risk and Reward Analysis: - Call Option: Delta of 0.8471 shows a strong chance of profitability, coupled with a higher theta meaning slower time decay. The premium and profit are moderately high, ensuring a balanced ROI. - Put Option: The delta of -0.2059 indicates a moderate risk of assignment. However, the high theta offers significantly less time decay risk and maintains profitability with an ROI of 100%.
Choice 4: Long-term Expiration - October 18, 2024
- Long Call Option: Strike at $35.00, expiring on October 18, 2024, with Delta of 0.9217, Gamma of 0.0062, Vega of 4.5630, Theta of -0.0194, and a premium of $22.20.
- Short Put Option: Strike at $50.00, expiring on October 18, 2024, with Delta of -0.2717, Gamma of 0.0177, Vega of 10.3487, Theta of -0.0262, and a premium of $4.05.
Risk and Reward Analysis: - Call Option: Delta almost guarantees being in-the-money, indicating excellent profitability potential. Theta is notably low, suggesting minimal time decay, providing consistent ROI. - Put Option: Delta is more significant (-0.2717), increasing assignment risk. However, the high premium and controlled theta make this option profitable with balanced risk and ROI.
Choice 5: Far-term Expiration - January 17, 2025
- Long Call Option: Strike at $21.67, expiring on January 17, 2025, with Delta of 0.9206, Gamma of 0.0018, Vega of 6.2470, Theta of -0.0315, and a premium of $33.70.
- Short Put Option: Strike at $60.00, expiring on January 17, 2025, with Delta of -0.4425, Gamma of 0.0167, Vega of 16.6840, Theta of -0.0191, and a premium of $11.67.
Risk and Reward Analysis: - Call Option: The high delta shows a significant chance of being in-the-money, with low theta ensuring minimal time decay. ROI is robust given the long-term horizon and high premium. - Put Option: Delta near 0.5 signifies balanced risk but with longer-term exposure. High theta and substantial premium make this option highly profitable despite moderate assignment risk due to higher delta.
These five choices cater to varying risk appetites and investment horizons, optimizing the calendar spread strategy for maximum profitability while considering the Greeks' impact on risk management.
Calendar Spread Option Strategy #1
Analysis of the Most Profitable Calendar Spread Options Strategy for Celsius Holdings, Inc. (CELH)
When evaluating calendar spread options strategies, the primary goal is to manage the risks and maximize profits by leveraging the difference in expirations of the options. Given the provided data and the target stock price fluctuating 2% over or under the current price, let's analyze the most profitable scenarios in the context of buying put options at one expiration date and selling call options at a different expiration date.
Long Put and Short Call Combinations
To construct effective calendar spreads, we will consider options that balance high profit potential with lower risks of assignment due to options being deep in-the-money (ITM).
Key Factors Considered:
- Delta: Indicates the options sensitivity to the stock price. Lower deltas for short calls help avoid assignment risks.
- Gamma: Measures the rate of change of delta; managing gamma helps maintain stable delta-hedging.
- Theta: Represents time decay; higher theta is favorable for short options to benefit from time decay.
- Vega: Measures sensitivity to volatility; higher vega can provide leverage in volatile markets.
- Rho: Indicates sensitivity to interest rates, which is generally a minor consideration in short-term trades.
- ROI and Profit Potential: Strategies should aim for a high return on investment (ROI) and substantial profit values.
Let's structure five profitable calendar spread strategies utilizing near-term through long-term options:
- Strategy 1: Short-Term High Profitability
- Long Put: Strike 88.0, Expire: 2024-07-05, Delta: -0.8896, Premium: $10.05, ROI: 1.96, Profit: $19.7182
- Short Call: Strike 88.0, Expire: 2024-07-05, Delta: 0.0021, Premium: $0.84, ROI: 100.0, Profit: $0.84
Risk/Reward: - Assume minimal risk of call option assignment due to extremely low delta. - The potential profit derived from the long put premium, combined with the high ROI, makes this a strong short-term choice.
- Strategy 2: Medium-Term Profit Stability
- Long Put: Strike 95.0, Expire: 2024-07-26, Delta: -0.9906, Premium: $25.87, ROI: 0.228, Profit: $5.8982
- Short Call: Strike 95.0, Expire: 2024-07-12, Delta: 0.0561, Premium: $0.05, ROI: 100.0, Profit: $0.05
Risk/Reward: - Reduced delta to manage assignment risk for the call option. - High premium and sufficient ROI for the put option ensure robust profit potential without excessive risk.
- Strategy 3: Long-Term Robust Profit
- Long Put: Strike 125.0, Expire: 2026-01-16, Delta: -1.0, Premium: $49.35, ROI: 0.352, Profit: $17.42
- Short Call: Strike 125.0, Expire: 2024-10-18, Delta: 0.0669, Premium: $0.5, ROI: 100.0, Profit: $0.5
Risk/Reward: - Higher delta for long put given the longer expiration compensates for the high premium. - Minimal risk with short call delta maintaining assignment risk mitigation.
- Strategy 4: Balancing Midterm Profit with Lower Risk
- Long Put: Strike 70.0, Expire: 2024-08-02, Delta: -0.9352, Premium: $13.71, ROI: 0.223, Profit: $3.0582
- Short Call: Strike 70.0, Expire: 2024-08-02, Delta: 0.0446, Premium: $0.13, ROI: 100.0, Profit: $0.13
Risk/Reward: - Mid-level risk on put, compensated by lower delta call option. - Balanced profit/ROI while mitigating assignment risk due to the proportionally lower premium and manageable delta.
- Strategy 5: Long-Term Strong Profit Potential
- Long Put: Strike 155.0, Expire: 2025-01-17, Delta: -1.0, Premium: $41.2, ROI: 1.349, Profit: $55.5682
- Short Call: Strike 155.0, Expire: 2024-10-18, Delta: 0.04318, Premium: $0.14, ROI: 100.0, Profit: $0.14
Risk/Reward: - Managing high premiums on long put, balanced against the very low delta of the short call option. - Great profit potential with minimized risk of call assignment, ensuring the strategy capitalizes on high returns in the long term.
Conclusion:
These strategies detail five different approaches to extend the calendar spread using puts and calls with various expiration dates. The balance between high put premiums and low delta short calls ensures the reduction in assignment risk and maximizes profit across varied time horizons. Each strategy is tailored to fit different risk tolerances and profit expectations, from near-term high profitability to longer-term robust returns.
Calendar Spread Option Strategy #2
Analysis of Calendar Spread Options Strategy for Celsius Holdings, Inc. (CELH)
For a profitable calendar spread strategy on CELH, we need to sell a put option at one expiration date and buy a call option at a different expiration date, while maintaining a target stock price within 2% over or under the current stock price. The goal is to minimize risk associated with in-the-money (ITM) parts of the trade to reduce the likelihood of share assignment.
Calendar Spread Strategy Selections
Below are five choices based on expiration date and strike price, ranging from near-term to long-term options. The selections are based on the tradeoff between profitability and risk minimization.
- Short-Term:
- Sell Put Option: Strike Price $83.00, Expiring 2024-07-12
- Delta: -0.806
- Gamma: 0.014
- Premium: $19.82
- Profit: $2.9482
- Risk: High due to delta
- Buy Call Option: Strike Price $56.00, Expiring 2024-07-12
- Delta: 0.596
- Gamma: 0.062
- Premium: $3.10
- Profit: $3.10
- Risk: Lower risk as it is less likely to be ITM
This strategy provides a balance with a lower risk on the call side while still capitalizing on the high gamma of the sold put option.
- Medium-Term:
- Sell Put Option: Strike Price $130.00, Expiring 2024-10-18
- Delta: -1.0
- Gamma: 0.0
- Premium: $40.70
- Profit: $31.0682
- Risk: High due to being deep ITM
- Buy Call Option: Strike Price $55.00, Expiring 2024-10-18
- Delta: 0.621
- Gamma: 0.0262
- Premium: $12.65
- Profit: $6.70
- Risk: Moderately low
Here, the high profitability of the sold put is counterbalanced by the moderate risk of the purchased call.
- Long-Term:
- Sell Put Option: Strike Price $145.00, Expiring 2025-01-17
- Delta: -1.0
- Gamma: 0.0
- Premium: $65.80
- Profit: $20.9682
- Risk: High due to being very deep ITM
- Buy Call Option: Strike Price $75.00, Expiring 2025-01-17
- Delta: 0.672
- Gamma: 0.0072
- Premium: $15.40
- Profit: $15.40
- Risk: Moderate
In this long-term strategy, the risk of assignment on the ITM put is mitigated by holding a far out expiry call with controlled risk.
- Ultra-Long-Term:
- Sell Put Option: Strike Price $200.00, Expiring 2026-01-16
- Delta: -1.0
- Gamma: 0.0
- Premium: $71.70
- Profit: $82.3682
- Risk: High
- Buy Call Option: Strike Price $45.00, Expiring 2026-01-16
- Delta: 0.785
- Gamma: 0.0055
- Premium: $25.00
- Profit: $14.0518
- Risk: Moderately high
This strategy is suited for investors looking at a long horizon with high premium intake on the sold put and managed risk on the bought call.
- High Risk-High Reward:
- Sell Put Option: Strike Price $125.00, Expiring 2024-10-18
- Delta: -1.0
- Gamma: 0.0
- Premium: $54.55
- Profit: $12.2182
- Risk: Very high
- Buy Call Option: Strike Price $115.00, Expiring 2025-01-17
- Delta: 0.169
- Gamma: 0.0072
- Premium: $12.05
- Profit: $12.05
- Risk: High but balanced by timeframe
This strategy involves high premiums and extensive risk, especially if stock prices swing significantly within the window.
Potential Profit and Loss Scenarios
1. Short-Term (Sell Put $83, Buy Call $56): - Reward: High short-term gains from the premium collected on the deep ITM put option. - Risk: Potential assignment of shares if stock drops below $83 drastically. Call option loss is limited since it's less likely to be ITM.
2. Medium-Term (Sell Put $130, Buy Call $55): - Reward: High medium-term gains due to significant premium. - Risk: Considerable risk of being assigned shares at $130 if prices do not move upward. Modest risk on call option being moderately ITM.
3. Long-Term (Sell Put $145, Buy Call $75): - Reward: Enhanced long-term profit potential from premium and favorable futures. - Risk: Highest risk of assignment due to deep ITM puts. Controlled risk on calls with moderate likelihood of ITM.
4. Ultra-Long-Term (Sell Put $200, Buy Call $45): - Reward: Very high gains from ultra-long premiums. - Risk: Highest risk profile, suited only for high-risk tolerance investors. Calls provide moderate balancing.
5. High Risk-High Reward (Sell Put $125, Buy Call $115): - Reward: High premiums over a combined horizon can yield historical returns. - Risk: Intensified assignment risk; calls add limited offsetting.
Conclusion
Each option strategy needs careful consideration of investor risk tolerance, trading horizon, and market movement expectations. While immediate returns on selling deep ITM puts are enticing, the implicit potential for assignment should be balanced with carefully chosen call options that minimize downside while ensuring greater leverage and premium gains.
Similar Companies in Beverages - Non-Alcoholic:
The Vita Coco Company, Inc. (COCO), Keurig Dr Pepper Inc. (KDP), PepsiCo, Inc. (PEP), Coca-Cola FEMSA, S.A.B. de C.V. (KOF), National Beverage Corp. (FIZZ), Report: Monster Beverage Corporation (MNST), Monster Beverage Corporation (MNST), Report: The Coca-Cola Company (KO), The Coca-Cola Company (KO), Coca-Cola Consolidated, Inc. (COKE)
https://www.fool.com/investing/2024/06/14/celsius-stock-plunged-168-in-terrible-week/
https://www.fool.com/investing/2024/06/16/want-to-go-value-hunting-these-3-stocks-are-underv/
https://www.youtube.com/watch?v=8r3s6UgGUxk
https://www.fool.com/investing/2024/06/18/down-30-in-one-month-is-celsius-stock-a-buy/
https://www.fool.com/investing/2024/06/19/4-reasons-to-buy-celsius-stock-hand-over-fist/
https://www.fool.com/investing/2024/06/23/1-growth-stock-down-34-to-buy-right-now/
https://finance.yahoo.com/video/truist-initiates-celsius-holdings-coverage-211106752.html
https://finance.yahoo.com/news/yahoo-video-truist-initiates-celsius-212001824.html
https://www.fool.com/investing/2024/06/27/why-celsius-stock-continues-to-drop/
https://www.fool.com/investing/2024/06/27/1-growth-stock-down-40-to-buy-right-now/
https://www.fool.com/investing/2024/06/27/is-celsius-stock-going-to-87-wall-street-analyst/
https://finance.yahoo.com/m/b29a7dbd-7413-3fbe-a9d4-db368bb743d4/1-growth-stock-down-40%25-to.html
https://finance.yahoo.com/m/dd4f6b03-dff9-370e-9b46-b60b39b3f4c3/is-celsius-stock-going-to.html
https://finance.yahoo.com/news/celsius-holdings-inc-celh-rises-214520841.html
https://finance.yahoo.com/m/676d1909-833e-3495-8794-86a8b60bae6b/exxon-stock-is-a-top-pick..html
https://www.sec.gov/Archives/edgar/data/1341766/000134176624000029/celh-20240331.htm
Copyright © 2024 Tiny Computers (email@tinycomputers.io)
Report ID: 9HFuqo
Cost: $0.66437
https://reports.tinycomputers.io/CELH/CELH-2024-06-30.html Home