Carpenter Technology Corp (ticker: CRS)
2024-01-07
 Carpenter Technology Corporation (CRS), established in 1889 and headquartered in Philadelphia, Pennsylvania, has positioned itself as a prominent player in the development, manufacture, and distribution of specialty alloys, including stainless steels, titanium alloys, superalloys, and various engineered products. The company serves a diverse range of industries such as aerospace, energy, medical, transportation, and defense, providing materials that are essential for advanced manufacturing processes and high-performance applications. CRS focuses on innovation and leverages its expertise in materials science to offer tailored solutions that meet the specific requirements of its customers. Its commitment to quality, precision, and reliability has enabled Carpenter Technology to build a reputation as a trusted supplier in the specialty materials sector. The company reports financial information in a transparent manner and its shares are traded on the New York Stock Exchange, providing liquidity and accessibility for investors interested in the materials and metallurgy sector.
| Full Time Employees | 4,500 | Total Pay for CEO | 2,647,727 | Total Pay for CFO | 1,096,104 |
| Total Pay for COO | 1,024,886 | Total Pay for General Counsel | 876,763 | Total Pay for Senior VP of Continuous Improvement | 806,256 |
| Previous Close | 67.91 | Open | 67.31 | Day Low | 66.52 |
| Day High | 68.48 | Dividend Rate | 0.8 | Dividend Yield | 0.012 |
| Payout Ratio | 0.3704 | Five Year Avg Dividend Yield | 2.22 | Beta | 1.631 |
| Trailing PE | 30.94444 | Forward PE | 13.640816 | Volume | 325,537 |
| Average Volume | 519,503 | Average Volume 10 Days | 293,460 | Bid | 61.6 |
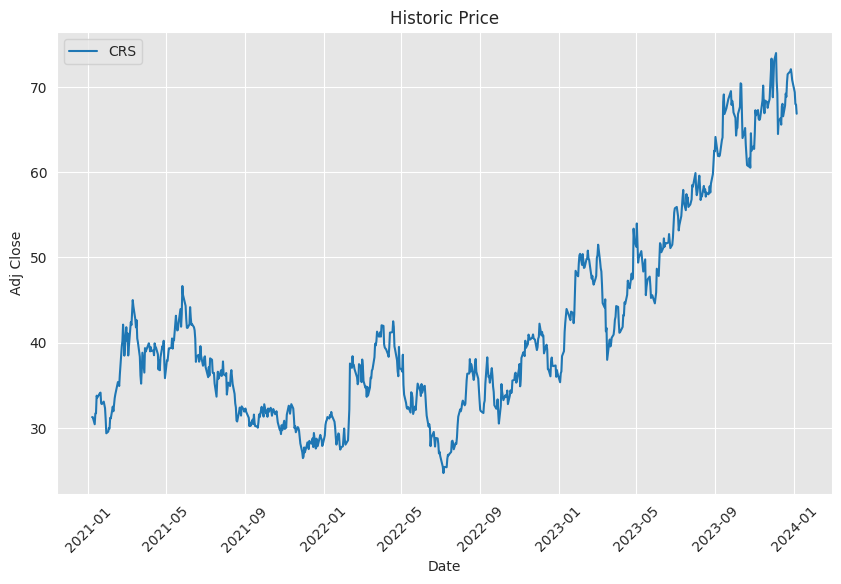
| Ask | 73.0 | Market Cap | 3,295,639,552 | Fifty Two Week Low | 38.24 |
| Fifty Two Week High | 74.06 | Price to Sales Trailing 12 Months | 1.2300375 | Fifty Day Average | 67.9852 |
| Two Hundred Day Average | 58.48445 | Trailing Annual Dividend Rate | 0.8 | Trailing Annual Dividend Yield | 0.011780297 |
| Current Price | 66.84 | Target High Price | 100.0 | Target Low Price | 75.0 |
| Target Mean Price | 86.0 | Target Median Price | 83.0 | Recommendation Mean | 1.8 |
| Number of Analyst Opinions | 3 | Total Cash | 18,100,000 | Total Cash Per Share | 0.367 |
| EBITDA | 298,300,000 | Total Debt | 702,099,968 | Quick Ratio | 1.179 |
| Current Ratio | 2.947 | Total Revenue | 2,679,300,096 | Debt to Equity | 49.122 |
| Revenue Per Share | 54.763 | Return on Assets | 0.03798 | Return on Equity | 0.07836 |
| Free Cash Flow | -27,925,000 | Operating Cash Flow | 100,100,000 | Revenue Growth | 0.247 |
| Gross Margins | 0.15176 | EBITDA Margins | 0.11134 | Operating Margins | 0.100480005 |
 Technical Analysis:
Observing the latest technical indicators and price action provided, there are several points to consider:
-
Parabolic SAR (PSAR): The absence of PSAR values for short signals and the fact that the PSAR acceleration factor remains 0.04 towards the end of the dataset suggest that the stock has been in a bullish trend. The PSAR values are below the price, confirming this uptrend.
-
On-Balance Volume (OBV): There is a slight decrease in OBV from 0.34416 million to 0.20995 million over the last few entries, which could indicate a loss of momentum or a consolidation phase after a substantial volume-supported rally.
-
Moving Average Convergence Divergence (MACD): The MACD histogram indicates decelerating bullish momentum with values trending down from 0.300396 to -0.353854. This can foretell a potential bearish crossover in the MACD, signaling a short-to-medium term reversal or consolidation.
Fundamental Analysis:
The fundamental analysis provides insight into the companys financial health:
-
Margins: The company has maintained positive gross margins, EBITDA margins, and operating margins over the review period, indicating effective cost control and profitability.
-
Net Income: There has been a significant improvement in net income from a loss in 2022 to a gain in 2023, which could support investor sentiment.
-
Debt: The company's net debt has increased from the previous year, which could put pressure on its balance sheet. However, the company has maintained its free cash flow in fluctuating conditions.
-
Revenue and Profit: The company shows an increase in total revenue and operating income, implying growth and efficient operational management.
Balance Sheet Analysis:
A glance at the balance sheet points reveals:
-
Liquidity: A decrease in cash and cash equivalents over the past year could be an area of concern regarding short-term liquidity.
-
Cash Flows: A negative free cash flow in 2023 and repayments of debt exceeding issuance suggest a tighter cash position.
Stock Price Movement Forecast:
Based on the above analysis:
-
The bullish trend indicated by the PSAR may face pressure due to decreasing momentum signaled by the OBV and MACD histogram downturn.
-
The strong fundamental improvements might provide underlying support to the stock price, but an increase in net debt and a reduction in cash holdings could dampen optimism.
-
The potential for the stock to continue its bullish trend in the medium term could be challenged by technical indicators suggesting a possible consolidation or reversal.
-
Longer-term price movement will likely depend on the companys ability to maintain or improve upon its profitability, manage debt levels, and generate positive cash flows.
Investors should monitor upcoming earnings reports, management guidance, and market conditions, as these will play a significant role in determining the stock's trajectory in the following months. Given the technical indicators suggesting a pause or pullback, careful position management and stop-loss considerations should be applied to mitigate the risk of a potential downtrend.
Market sentiment, economic factors, and industry-specific news can further influence stock performance. Thus, while the company shows substantive improvement in fundamentals, the technical indicators propose caution. It is advisable for investors to weigh the technical signs of a nearing trend reversal against the robust fundamentals and to adjust their strategies accordingly.
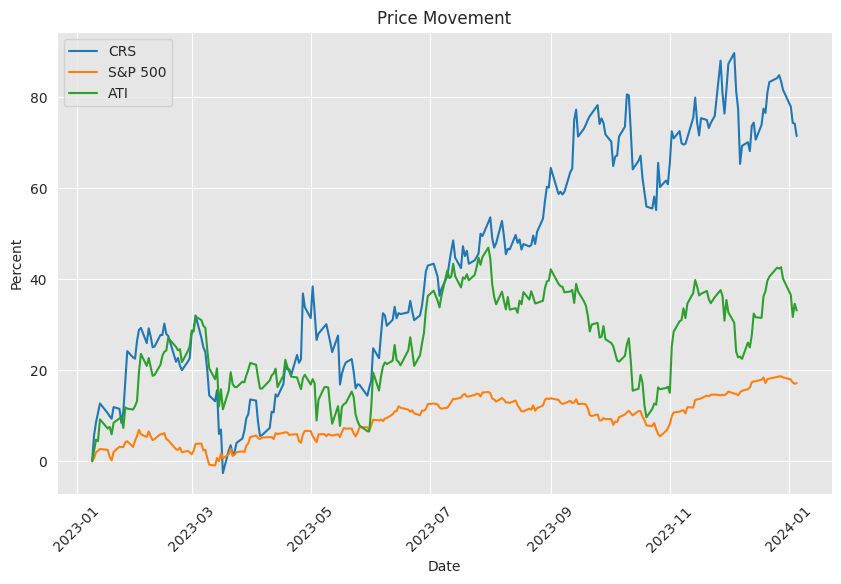
The linear regression model between CRS (assumed to be a stock or sector-specific index) and SPY (a proxy for the broader market, typically the S&P 500 index) shows a moderate degree of correlation during the observed time period, indicated by an R-squared (R2) value on the test set of approximately 0.405. R2 is a statistical measure that represents the proportion of the variance for the dependent variable that's explained by the independent variable(s) in a regression model. An R2 of 0.405 suggests that approximately 40.5% of the variability in CRS's performance can be explained by SPY's performance. This indicates that while there is some relationship between CRS and the market as represented by SPY, more than half of CRS's price movement is likely affected by factors not accounted for by the broader market's movements.
Focusing on the alpha in the linear regression, which represents the intercept of the regression line when all the independent variables are zero, alpha can be interpreted as the expected return on the investment when the market return (SPY) is zero. In this dataset, the posterior distribution of alpha contains values that suggest the relationship between CRS and SPY could result in CRS underperforming or outperforming the market when the market's return is neutral. A negative alpha would imply that CRS is expected to perform worse than the market's risk-free rate, whereas a positive alpha would suggest outperformance. The specific alpha value from the posterior distribution would help investors or analysts gauge the expected performance of CRS independent of the market's movements.
Carpenter Technology Corporation, operating under the ticker CRS, has recently bolstered its standing in the markets with an impressive track record of outperforming earnings estimates. These recurrent surges have captured the attention of investors, thrusting the specialized steel industry player into the spotlight. The company's steadfast performance above analyst expectations, particularly in the last two quarters, underscores its financial robustness. An average earnings surprise of 16.88% is telling, with the most recent quarter's $0.88 per share earnings significantly outpacing the Zacks Consensus Estimate of $0.75 per share.
The company's upward earnings trajectory has invariably led to heightened optimism among financial analysts, resulting in positive revisions of near-term earnings potential. The Zacks Earnings ESP currently being positive at +0.59% suggests an earnings beat might be on the horizon, supported by Carpenter's favorable high rank. Such metrics have historically correlated with a high likelihood of surpassing earnings predictions, especially when coupled with a Zacks Rank of #3 (Hold) or better.
Carpenter Technology's stock performance embodies the encouraging indicators, yet it doesn't operate in a vacuum, reflecting broader market movements and niche trends. The company's financial health and sustainability of this performance are key areas of consideration for investors eyeing the stock's lucrative growth potential. Analysts project, with bated breath, whether the company's streak of beating estimates will resonate in the upcoming financial disclosures.
Amidst this backdrop of positive market sentiment, Wall Street analysts have issued a promising outlook for CRS, with a possible significant upside. CRS's stock price closed at $67.91 in the latest trading session, marking a 5.4% increase over four weeks. Analysts are painting a bullish picture, with the consensus price target of $86.33 suggesting a 27.12% potential upside, yet with a notable standard deviation in estimates.
This disparity in projections accentuates the variances in analyst views and highlights the level of consensus surrounding the anticipated stock price movement. Such variations also shed light on the intrinsic uncertainties within analyst forecasts, which may be swayed by external motivations beyond objective financial analysis. Therefore, investors are advised to consider a wide array of indicators, beyond just price targets, when formulating their investment strategies.
In parallel, revisions in earnings estimates can reveal much about investor confidence. A marginal improvement in the Zacks Consensus Estimate for CRS, inching up by 0.1% over the past month, presents a more positive outlook. Moreover, CRS's designation as a Zacks Rank #1 (Strong Buy) heralds it among the top echelon of stocks, suggesting a substantial likelihood of short-term appreciation.
Carpenter Technology, a player in the Basic Materials sector, is drawing closer to its next earnings announcement, scheduled for January 25, 2024. With a commendable Zacks Rank #3 (Hold) and an Earnings ESP of 6.83%, the financial community is anticipating another possible earnings outperformance. The ESP's value rests in the assumption that the most recent analyst estimates are more reliable due to proximity to the earnings release. Thus, surpassing market earnings forecasts often precipitates a favorable response in share price, a trend that investors aim to harness.
In broader terms, the Basic Materials sector's cyclical nature and sensitivity to economic factors make understanding companies like Carpenter Technology all the more critical. Anticipation builds around the potential ripple effects of a positive earnings report, which can sway investor sentiments and subsequently influence stock prices.
Moreover, recent upward adjustments of EPS projections for the company point to a robust outlook. Current quarter estimates have risen from 77 cents to 85 cents per share, while those for the fiscal year have jumped from $3.57 to $3.96 per share. These adjustments have fortuitously positioned Carpenter Technology, bestowing upon it a Zacks Rank #1 (Strong Buy). The broader industry trends further corroborate this outlook, with the specialty steel sector standing tall at a Zacks Industry Rank of 23 out of over 250 industries.
The confluence of strong analyst revisions, an industry positioned for growth, and a promising business model, positions Carpenter Technology as an attractive investment opportunity. Its track record of beating performance estimates serves as a testament to a resilient business strategy and offers an incentive for investors looking to leverage industry momentum.
Amidst this optimistic landscape, Carpenter Technology has seen its stock price dip by 4.1% over the previous week, prompting a closer examination of the company's financials. Particularly, the Return on Equity (ROE) sits at 7.5% for the trailing twelve months to September 2023. When compared to the industry's average ROE of 11%, Carpenter's figure emerges lower, likely contributing to the recent decline in its net income.
Despite a substantial profit retention rate, the company's earnings profile presents a conundrum, as growth hasn't been as pronounced as might be expected. The constancy of dividend payments points to a cautiously optimistic future, with anticipated freeing of funds for growth. Such complexity signifies that while the company maintains healthy profit retention, the below-par return on equity tempers earnings growth expectations.
Still, analysts hold a positive outlook for Carpenter's financial growth, with an upwards adjustment of the company's earnings growth rate being a distant possibility. These forecasts may hinge on industry-wide trends or expected enhancements in the company's operational efficiency. Therefore, ongoing monitoring of these projections is crucial for investors.
Carpenter Technology has recently demonstrated a noteworthy year-to-date return of 91.7%, noticeably eclipsing the Basic Materials sector's average. This performance stands out within a sector consisting of 230 firms, as determined by Zacks Sector Rank. The company's strong Zacks Rank and upwardly revised earnings estimates have contributed to an enhanced outlook for CRS.
Another firm, United States Steel, exhibits parallel fortunes, having achieved a year-to-date return of 94.2%, showcasing strong sector performance. Both companies, surpassing industry gains, underscore the potential opportunities that lie within stocks outperforming their industry benchmarks.
Headquartered in Philadelphia, PA, Carpenter Technology's influence spans across titanium alloys, stainless steels, and various specialized materials required in critical applications. With Aerospace and Defense representing a significant revenue share, the company's solutions are foundational to diverse industries. Its strong buy rank and rising earnings estimates reflect a robust business performance, and Carpenter's stock performance has convincingly mirrored this positive trend.
Investors are invited to tune in to Carpenter Technology's conference call, scheduled for January 25, 2024, to unwrap the company's second-quarter results for the fiscal year 2024. The call will provide an opportunity to understand the company's recent operational achievements and strategic initiatives. The management's perspectives may prove crucial for current and potential investors, as Carpenter Technology navigates the complex market landscape.
Similar Companies in Metals & Mining:
Allegheny Technologies Incorporated (ATI), Haynes International, Inc. (HAYN), Valmont Industries, Inc. (VMI), TimkenSteel Corporation (TMST), Report: Reliance Steel & Aluminum Co. (RS), Reliance Steel & Aluminum Co. (RS), Report: Nucor Corporation (NUE), Nucor Corporation (NUE)
News Links:
https://finance.yahoo.com/news/wall-street-analysts-believe-carpenter-145505728.html
https://finance.yahoo.com/news/why-carpenter-technology-crs-stock-134400657.html
https://finance.yahoo.com/news/carpenter-crs-beat-estimates-again-171011531.html
https://finance.yahoo.com/news/does-market-low-tolerance-carpenter-185940769.html
https://finance.yahoo.com/news/basic-materials-stocks-lagging-carpenter-144008274.html
https://finance.yahoo.com/news/2-basic-materials-stocks-could-140007245.html
https://finance.yahoo.com/news/top-basic-materials-stock-1-144003700.html
https://finance.yahoo.com/news/carpenter-technology-announces-conference-call-133000676.html
Copyright © 2024 Tiny Computers (email@tinycomputers.io)
Report ID: x1oZCD
https://reports.tinycomputers.io/CRS/CRS-2024-01-07.html Home