Deere & Company (ticker: DE)
2024-01-09
 Deere & Company, which trades under the ticker symbol DE, is an American corporation that is renowned worldwide for its manufacturing of agricultural machinery, construction equipment, forestry machinery, diesel engines, drivetrains used in heavy equipment, and lawn care equipment. Founded in 1837 by John Deere, a blacksmith who conceived the first commercially successful cast-steel plow, the company has grown to become a global leader in its industry. Headquartered in Moline, Illinois, Deere & Company has expanded its portfolio to include smart technology, services, and solutions that are used in the agriculture and construction sectors. Its familiar green and yellow equipment is a testament to Deere's strong brand recognition and reputation for quality. The company's financial performance reflects its dominant market position, and DE's stock is commonly included in discussions pertaining to industrial and agricultural economic sectors. Deere & Company's commitment to innovation and sustainability continues to be a driving force in its enduring success and appeal to investors.
| Address | One John Deere Place | City | Moline | State | IL |
| Zip Code | 61265 | Country | United States | Phone | 309 765 8000 |
| Website | https://www.deere.com | Industry | Farm & Heavy Construction Machinery | Sector | Industrials |
| Full Time Employees | 83,000 | Previous Close | 397.98 | Open | 395.71 |
| Day Low | 390.01 | Day High | 396.85 | Dividend Rate | 5.88 |
| Dividend Yield | 1.48% | Payout Ratio | 14.58% | Five Year Avg Dividend Yield | 1.36% |
| Beta | 1.066 | Trailing PE | 11.36 | Forward PE | 13.71 |
| Volume | 1,006,824 | Average Volume | 1,659,119 | Average Volume 10 Days | 1,157,400 |
| Market Cap | 110,201,872,384 | Fifty Two Week Low | 345.55 | Fifty Two Week High | 450.00 |
| Price to Sales Trailing 12 Months | 1.80 | Fifty Day Average | 377.8268 | Two Hundred Day Average | 391.0373 |
| Trailing Annual Dividend Rate | 5.05 | Trailing Annual Dividend Yield | 1.27% | Enterprise Value | 169,247,047,680 |
| Profit Margins | 16.61% | Float Shares | 259,920,107 | Shares Outstanding | 280,255,008 |
| Shares Percent Shares Out | 0.83% | Held Percent Insiders | 0.174% | Held Percent Institutions | 78.69% |
| Short Ratio | 0.98 | Short Percent of Float | 0.83% | Book Value | 77.37 |
| Price to Book | 5.08 | Last Fiscal Year End | 1698537600 | Next Fiscal Year End | 1730160000 |
| Earnings Quarterly Growth | 5.5% | Net Income to Common | 10,165,999,616 | Trailing EPS | 34.62 |
| Forward EPS | 28.68 | Earnings Growth | 11.2% | Revenue Growth | -0.9% |
| Gross Margins | 34.49% | EBITDA Margins | 27.07% | Operating Margins | 33.95% |
| Total Cash | 5,824,000,000 | Total Cash Per Share | 20.78 | EBITDA | 16,572,000,256 |
| Total Debt | 64,768,000,000 | Quick Ratio | 1.707 | Current Ratio | 1.914 |
| Total Revenue | 61,221,998,592 | Debt to Equity | 295.933 | Revenue Per Share | 209.521 |
| Return on Assets | 10.02% | Return on Equity | 48.08% | Gross Profits | 21,117,000,000 |
| Free Cash Flow | 3,228,000,000 | Operating Cash Flow | 8,589,000,192 | Currency | USD |
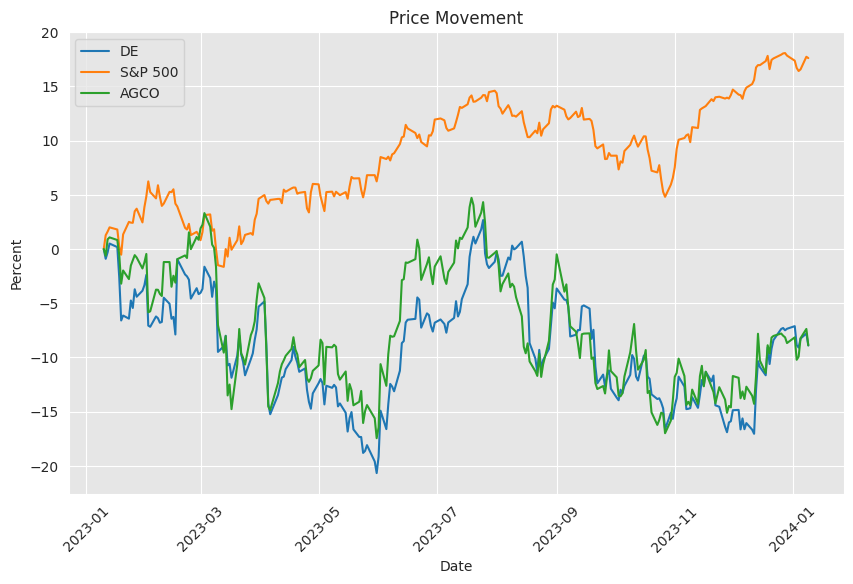
The following analysis provides insights into the stock price movement of Deere & Company (DE) for the next few months based on technical analysis, fundamental analysis, and balance sheet data.
Technical Analysis: - The price movement shows a declining trend with the opening price diminishing from $399.41 to $395.71 from September 2023 to January 2024. - The Parabolic SAR (PSAR) indicates a potential trend reversal as the dot flips from the bullish (below the price) to the bearish (above the price). - On Balance Volume (OBV) shows some distribution, suggesting a bearish sentiment as the figure moved from 0.112780 million in September 2023 to -0.637072 million in January 2024. - The Moving Average Convergence Divergence (MACD) Histogram is negative as of the last trading day, indicating bearish momentum.
Fundamental Analysis: - Gross margins have been healthy at 34.493%, showing the company maintains a significant markup over its costs. - Operating margins at 33.947% indicate strong operational efficiency. - A trailing PEG ratio of 2.1147 suggests the stock might be overvalued relative to its growth rates.
Balance Sheet Data: - Net Debt is substantial at $55.953 billion, reflecting high leverage which could be a potential concern for the company's flexibility. - However, DE also has a strong cash position at $8.404 billion, which provides liquidity and could mitigate short-term financial risk. - The company has been repurchasing capital stock, reducing the number of shares and potentially increasing earnings per share, which may be viewed as positive by investors.
Cash Flow Data: - Free Cash Flow demonstrates financial strength, with a solid $4.121 billion as of October 2023. - The Repayment of Debt exceeded Issuance of Debt in the same period, indicating efforts to manage debt levels.
Considering the amalgamation of technical indicators and fundamental analysis, the price trajectory for DE could face downward pressure in the upcoming months. The bearish technical indicators such as a negative PSAR trend, decreasing OBV, and negative MACD histogram align with this prediction. However, the strong fundamental underpinnings, including healthy margins and solid free cash flow, may provide some price support or potential upside surprises should market conditions or the company's performance positively shift investor sentiment.
Investors should monitor key indicators such as operating margins and free cash flow against industry benchmarks, as well as any significant changes in the company's leverage, which could alter the stock price trajectory. The balance between technical bearishness and fundamentally-driven buoyancy will likely define the medium-term price movement for DEs stock. While technical analysis suggests caution, strong fundamentals are indicative of underlying value which, if recognized by the market, could moderate or even counteract technical downtrends.
| Statistic Name | Statistic Value |
| R-squared | 0.395 |
| Adj. R-squared | 0.394 |
| F-statistic | 818.2 |
| Prob (F-statistic) | 6.12e-139 |
| Log-Likelihood | -2400.1 |
| No. Observations | 1,256 |
| AIC | 4,804 |
| BIC | 4,815 |
| coef (constant) | 0.0370 |
| coef (DE) | 1.0023 |
| std err (constant) | 0.046 |
| std err (DE) | 0.035 |
| t-value (constant) | 0.799 |
| t-value (DE) | 28.604 |
| P>|t| (constant) | 0.424 |
| P>|t| (DE) | 0.000 |
| [0.025 (constant)] | -0.054 |
| [0.975 (constant)] | 0.128 |
| [0.025 (DE)] | 0.934 |
| [0.975 (DE)] | 1.071 |
| Omnibus | 216.092 |
| Prob(Omnibus) | 0.000 |
| Skew | -0.351 |
| Kurtosis | 10.357 |
| Cond. No. | 1.32 |
| Alpha | 0.036950017049137446 |
| Beta | 1.0023241129749243 |
The linear regression model examining the relationship between DE (Deere & Company) and SPY (SPDR S&P 500 ETF Trust) reveals a positive beta coefficient, suggesting that DE typically moves in the same direction as the SPY, which represents the overall market. With a beta of 1.0023, it indicates that DE mostly moves in line with market changes. However, the R-squared value of 0.395 indicates that only approximately 39.5% of DE's movements are explained by movements in SPY, leaving a significant portion of DE's price variability determined by other factors or company-specific risks.
The alpha value in this regression, which represents the portion of DE's returns that are not explained by the market's movements (as represented by SPY), is 0.036950017049137446. This is a measure of DE's performance relative to the market benchmark SPY; in fact, if alpha is positive, it suggests that DE provides an additional return above what could be predicted by its market-related movements alone. However, the statistical significance of alpha must be considered in this context. Given the t-value of 0.799 and P-value of 0.424 for the constant term, this particular alpha does not appear to be statistically significant at common confidence levels, meaning that the evidence is not strong enough to conclude that DE's alpha is reliably different from zero in the period analyzed.
Executive Summary for Deere & Company's Fourth Quarter Earnings Conference Call
Introduction: The conference call for Deere & Company's fourth-quarter earnings was initiated by Josh Beal, the Director of Investor Relations, with the participation of key company executives. They intended to discuss the quarterly financial results and provide insight into the company's market position and outlook for the fiscal year 2024.
Financial Highlights: Deere & Company reported strong financial performance for the fourth quarter, with equipment operation margins reaching 20.3%. The overall year witnessed a 16% growth in net sales and revenue, with operating margins nearly hitting 22%. These figures contributed to an operating cash flow close to $12 billion. Such outcomes were attributed to vigorous market demand, efficient operational execution, and improved production costs. However, the fiscal year 2024 outlook predicts a decline in agriculture market demand, offset by the expectation to maintain profitability gains.
Segment Performance: In the fourth quarter, the company's production and precision agriculture segment faced a 6% reduction in net sales, primarily due to lowered shipment volumes despite positive price realizations and currency translations. Nevertheless, operating profit increased due to cost management, which was favorable in comparison to previous quarters affected by supply chain issues. Meanwhile, the small agriculture and turf sector saw a 13% dip in sales owing to similar causes, notwithstanding the positive influence of pricing and currency factors.
The company provided a detailed segment forecast for 2024, predicting declines in several sectors, including large agriculture equipment and construction and forestry sales. These assessments were made with considerations for market volatility, political instability, economic uncertainty, and external variables like weather conditions.
Strategic Outlook and Capital Management: Looking ahead to 2024, the company anticipates varied dynamics across different geographic markets and segments. North American large agriculture is projected to experience sound fundamentals, albeit reduced from previous peaks. The European market is expected to stabilize, while South America may see declines due to political and economic challenges. The construction and forestry segment anticipates continued benefits from infrastructure investment, yet it prepares for cautious guidance due to interest rate impacts on the residential sector.
From a technological investment standpoint, the company remains committed to innovation through various R&D initiatives, which include emphasis on retrofit solutions, autonomy, and the latest Gen-5 display operating system. Additionally, the company's financial discipline is underscored by its capital allocation efforts, which encompass organic and inorganic investments, a dividend increase, and substantial share repurchases.
Conclusion and Q&A Highlights: The executives concluded their formal commentary by emphasizing the notable achievements of the company in terms of net income and revenue, historical profitability levels, and strategic pivots that bolstered customer value creation. They also highlighted the operational normalization post previous disruptive cycles and the maintained focus on cost management as critical components of the company's consistent performance.
During the Q&A session, the executives discussed topics such as the potential for further cost reductions, pricing strategies, reconciling financial guidance with industry projections, managing inventory levels, and the decrements associated with production reductions in large agriculture. They reiterated the company's strategic positioning and ability to navigate through market cycles with strength due to implemented improvements and a concentrated effort toward innovation and customer value-driven offerings.
Overall Impression:
Deere & Company's fourth-quarter earnings call reveals a robust financial year, with strategic measures in place to manage anticipated market declines. The company has shown a resolute focus on maintaining structural profitability, continued investment in technological advancements, and capital discipline. Despite upcoming market challenges, Deere & Company exhibits confidence in its growth and value creation trajectory for the future.
In the third quarter of fiscal year 2023, ending on July 30th, Deere & Company reported robust financial results, reflecting an increase in overall net sales and revenues from the same quarter last year. Net sales were $14,284 million, marking a significant rise from the previous year's figure of $13,000 million. The segments contributing to this increase included Production & Precision Agriculture, Small Agriculture & Turf, and Construction & Forestry. Additionally, finance and interest income generated from Deere's Financial Services sector also exhibited an upward trend.
Deere's cost of sales and operating expenses also saw an uptick in line with the growth in net sales, reaching $9,624 million compared to the prior year's $9,511 million. However, despite the rise in expenses, the companys operating profit experienced significant growth across its operating segments, indicating effective cost management and sustained profitability.
The segments themselves performed remarkably well. The Production & Precision Agriculture segment witnessed a notable increase in net sales, from $6,096 million to $6,806 million, translating to a 12% change. The Small Agriculture & Turf and Construction & Forestry segments also followed suit with similar upward trends in net sales. In the Financial Services segment, revenues saw a substantial 36% increase, scaling from $903 million to $1,228 million.
Geographically, Deere's sales were bolstered in key markets such as the United States, which remained the largest contributor to net sales, followed by other important markets like Canada and Western Europe. Additionally, sales in Latin America and the Asia, Africa, Oceania, and Middle East regions contributed significantly to the net sales and revenues.
Deeres inventory reflected a continued focus on maintaining a strong supply of raw materials, work-in-process, finished goods, and parts. While the company's inventory system valued on LIFO basis, it was estimated that if valued on the FIFO basis, the inventory would witness an increase, indicating the companys readiness to meet market demand.
The balance sheet strengthened with an increase in total assets from $86,817 million in the previous year to $103,397 million in the current period. This growth was supported by an accumulated increase in numerous asset categories, including cash and cash equivalents, trade accounts and receivable, and other assets.
The companys strategic financial practices were evident in its securitization of financing receivables. By transferring certain financing receivables into specially created entities, the company managed to legally isolate these assets. As such, these securitized assets amounted to $7,154 million. The liabilities related to these restricted securitized assets totaled $6,623 million.
Goodwill and intangible assets reflected the companys acquisitions and growth strategy. Goodwill saw a rise in all operating segments, amounting to $3,994 million, emphasizing Deeres expansion and acquisition activities. Amortized intangible asset valuation indicated the companys intellectual property and customer-related assets are estimated to rise in the near future.
In terms of short-term borrowings, the company showed resilience with commercial paper amounting to $9,003 million, and its long-term borrowings also substantiated the companys robust financial structure.
Accounts payable and accrued expenses were managed efficiently despite the increased scale of operations, with trade payables, dealer sales discounts, product warranties, and employee benefits being the major contributing liabilities.
These financial highlights depict Deere & Companys enduring strength in the market and its ability to sustain growth across its diversified segments. The company successfully navigated through the quarter with effective management of costs, resources, and strategic financial planning, resulting in a positive financial outlook.
Deere & Company, commonly known as John Deere, is an iconic American brand with a rich history dating back to 1837. It has long been associated with agriculture, but its reach extends into construction and forestry machinery, underscoring the company's role in various essential industries. Investors and analysts closely track the performance of Deere's stock due to the corporation's significance in these sectors.
In recent developments, Deere's investment appeal has shown significant shifts. Analyst ratings have diverged, with one analyst issuing a new 'Buy' rating while another downgraded the stock from 'Buy' to 'Hold'. These juxtaposed views reveal a split among experts on Deere's future performance and stock potential.
The 'Buy' rating indicates optimism about Deere's prospects, possibly buoyed by improved earnings forecasts, market share growth, or favorable industry trends. Conversely, the downgrade to 'Hold' suggests caution, potentially due to challenges on the horizon or the belief that the stock is currently priced in a manner that reflects its true value, offering limited immediate upside potential.
Market scrutiny has intensified as stakeholders aim to discern the rationale behind such disparate assessments. Deere's market standing is entwined with broader economic signals, such as US and global financial markets, fluctuating agricultural commodity prices, construction sector activity, and strides in farming and construction technology that could impact the company's operational results and investor sentiment.
External influences like geopolitical tensions and regulatory shifts in agriculture and construction sectors also play crucial roles. They can affect commodity prices and supply chains, thereby altering the operational landscape for Deere. Technological advancements, particularly in precision agriculture and construction automation, could further influence Deere's product line-up and market competitiveness.
Financial factors like interest rates and bond yields are important for a capital-heavy company like Deere. Changes in these rates affect financing costs for the company and its customers, thus influencing investment decisions and stock valuations.
As Deere & Company prepares for its upcoming earnings release, attention is drawn to key performance indicators. Projections suggest a decrease in quarterly earnings per share and revenue compared to the prior year. These anticipated contractions in earnings and revenue reflect wider economic pressures and raise questions about future growth trajectories.
However, it's vital to note that revisions of analyst estimates can be precursors to short-term stock movements. A marginal uptick in Deere's consensus EPS estimate within the past month reflects subtle optimism, yet Deere's Zacks Rank at #4 (Sell) signals pessimism based on a quantitative model with a record of outperforming stocks. Valuation measures place Deere slightly above the industry with respect to Forward P/E but with a PEG ratio suggesting potential undervaluation based on growth expectations.
Deere's industry rank is currently positioned in the lower echelons, indicating relative underperformance against other sectors. This underscores potential headwinds but must be weighed against the company's strengths, such as its dividend yield and financial management acumen.
On the dividend front, Deere stands out as one of the safe dividend stocks, boasting a low payout ratio, thereby attracting income investors looking for stability and growth potential. The company's enduring market leadership and vast global presence, coupled with a solid distribution network, act as formidable barriers to entry for competitors, fortifying its strategic position.
The financial results for the fourth quarter of fiscal 2023 demonstrated various dynamics, notably a slight decline in sales but an impressive increase in EPS. These results showcased Deere's adaptability and operational resilience. Growth factors such as market expansion through strategic acquisitions, such as the Wirtgen Group purchase, and increased global food demand due to population growth, signify that Deere is well-positioned for future advances. The company's track record of share buybacks and a forecasted low dividend payout ratio for 2024 further reinforce the optimistic outlook for its dividend growth.
The average brokerage recommendation paints a favorable picture for Deere, while the Zacks Rank indicates caution. The disparity between these assessments necessitates investor discernment. A weakening in analyst consensus on earnings alongside cautionary indicators points to potential future challenges for the stock, inviting investors to scrutinize the company's prospects more critically.
Deere has also been tagged as one of the "3 Stocks That Are Absurdly Cheap Right Now" according to The Motley Fool, underlined by its valuation and robust cash flow growth. Deere's efforts in advancing technology and broadening its product lines align with the push for increased agricultural productivity and infrastructure development, bolstering its market position.
The company's recent share price gain post-earnings suggests confidence in its strategies and market conditions favorable to its business model. This uptick, against a backdrop of a conservative outlook for 2024 and the projected sales and net income declines, paints a mixed picture. A robust financial situation characterized by healthy cash reserves and a large cash flow from operations indicates structural stability.
Investor sentiment over the past months has been a rollercoaster, with Deere's stock experiencing both appreciation and decline. The overall financial community's response is calibrated, acknowledging Deere's challenges but also its potential for robust growth.
In summation, Deere & Company's known ability to navigate economic cycles, its resilience in face of cost pressures and its business model innovations, position it as an intriguing option for the shrewd investor. While the market response to various analyses and projections regarding the stock ranges from cautionary to opportunistic, Deere's consistency in delivering substantial shareholder value and lucrative dividends cannot be ignored. As the market landscape evolves, so will the interpretations of Deere's performance and prospects. Therefore, continued vigilance and holistic assessment of market trends, financial statements, and sector-specific dynamics remain key for stakeholders considering an investment in this legacy company.
Similar Companies in Farm & Heavy Construction Machinery:
AGCO Corporation (AGCO), Report: Caterpillar Inc. (CAT), Caterpillar Inc. (CAT), CNH Industrial N.V. (CNHI), Report: The Toro Company (TTC), The Toro Company (TTC), Kubota Corporation (KUBTY), Titan International, Inc. (TWI), Lindsay Corporation (LNN), Alamo Group Inc. (ALG)
https://www.fool.com/investing/2023/12/22/3-stocks-that-are-absurdly-cheap-right-now/
https://www.zacks.com/stock/news/2207228/deere-de-advances-but-underperforms-market-key-facts
https://finance.yahoo.com/news/3-safe-dividend-stocks-low-150930745.html
https://finance.yahoo.com/m/7b858fc8-15a7-3393-a508-34af853d672d/deere-stock-gets-a-new-bull%2C.html
https://finance.yahoo.com/news/brokers-suggest-investing-deere-read-143005414.html
https://www.zacks.com/stock/news/2201686/why-is-deere-de-up-6-1-since-last-earnings-report
https://finance.yahoo.com/news/deere-advances-underperforms-market-key-225017297.html
https://finance.yahoo.com/news/those-invested-deere-nyse-five-120014797.html
https://www.zacks.com/stock/news/2188058/deere-de-q4-earnings-beat-shares-dip-on-muted-fy24-view
https://www.zacks.com/stock/news/2199473/deere-de-gains-from-pricing-actions-despite-elevated-costs
https://www.sec.gov/Archives/edgar/data/0000315189/000155837023015380/de-20230730x10q.htm
Copyright © 2024 Tiny Computers (email@tinycomputers.io)
Report ID: bnqZ9nd