EOG Resources, Inc. (ticker: EOG)
2024-01-30
 EOG Resources, Inc. (ticker: EOG) is a leading American petroleum and natural gas exploration company, with a strong presence in major United States hydrocarbon-producing basins. Founded in 1999 and headquartered in Houston, Texas, EOG's business strategy has consistently emphasized technological innovation, cost-efficiency, and sustainable practices to enhance its drilling and production capabilities. By utilizing advanced horizontal drilling and hydraulic fracturing techniques, EOG has secured its position as one of the most prolific producers of shale oil and gas in the nation. Its extensive asset portfolio includes significant holdings in the Eagle Ford Shale, Permian Basin, and Bakken formation. EOG Resources prides itself on its low debt-to-equity ratio and a strong balance sheet, contributing to its reputation for financial rigor and shareholder value creation. The company also places a strong emphasis on minimizing its environmental footprint while striving to meet the growing global energy demand.
| Full Time Employees | 2,850 | Previous Close | 114.96 | Open | 114.32 |
| Day Low | 113.839 | Day High | 115.28 | Dividend Rate | 3.64 |
| Dividend Yield | 0.0317 | Payout Ratio | 0.2392 | Five Year Avg Dividend Yield | 2.12 |
| Beta | 1.417 | Trailing PE | 8.522255 | Forward PE | 9.541528 |
| Volume | 599,121 | Average Volume | 3,279,437 | Average Volume (10 Days) | 2,959,260 |
| Bid | 114.55 | Ask | 114.6 | Bid Size | 1,000 |
| Ask Size | 1,800 | Market Cap | 66,992,271,360 | Fifty Two Week Low | 98.52 |
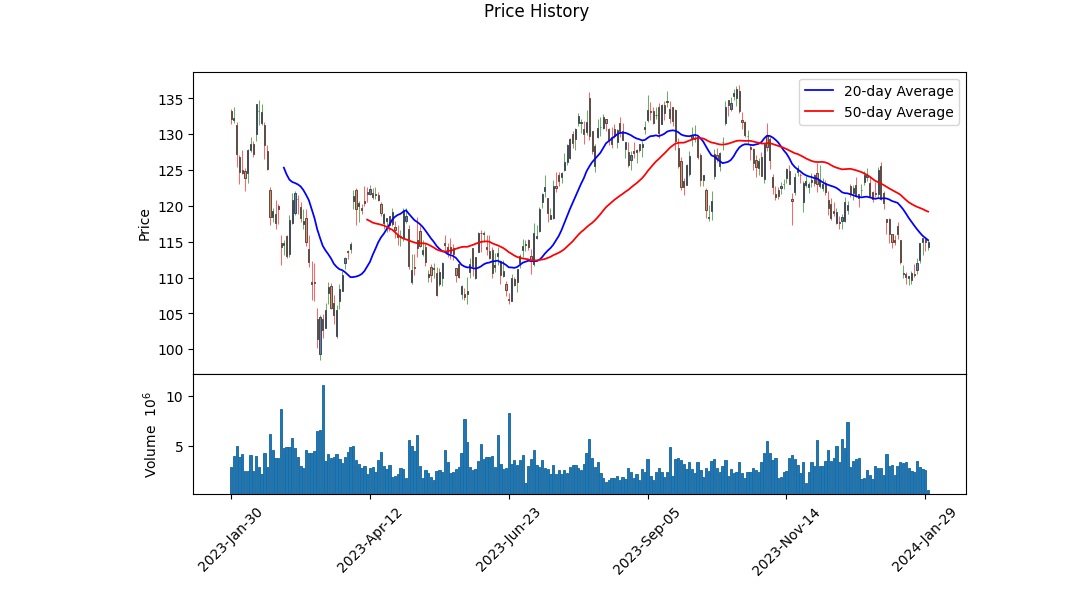
| Fifty Two Week High | 136.79 | Price to Sales (TTM) | 2.8234615 | Fifty Day Average | 119.3528 |
| Two Hundred Day Average | 121.4134 | Trailing Annual Dividend Rate | 3.3 | Trailing Annual Dividend Yield | 0.028705636 |
| Enterprise Value | 65,855,877,120 | Profit Margin | 0.33224 | Float Shares | 580,799,509 |
| Shares Outstanding | 583,150,016 | Shares Short | 6,460,527 | Shares Percent Shares Out | 0.0111 |
| Held Percent Insiders | 0.00488 | Held Percent Institutions | 0.91113 | Short Ratio | 1.98 |
| Short Percent Of Float | 0.0111 | Book Value | 47.608 | Price to Book | 2.4130397 |
| Last Fiscal Year End | 1672444800 | Most Recent Quarter | 1696032000 | Earnings Quarterly Growth | -0.289 |
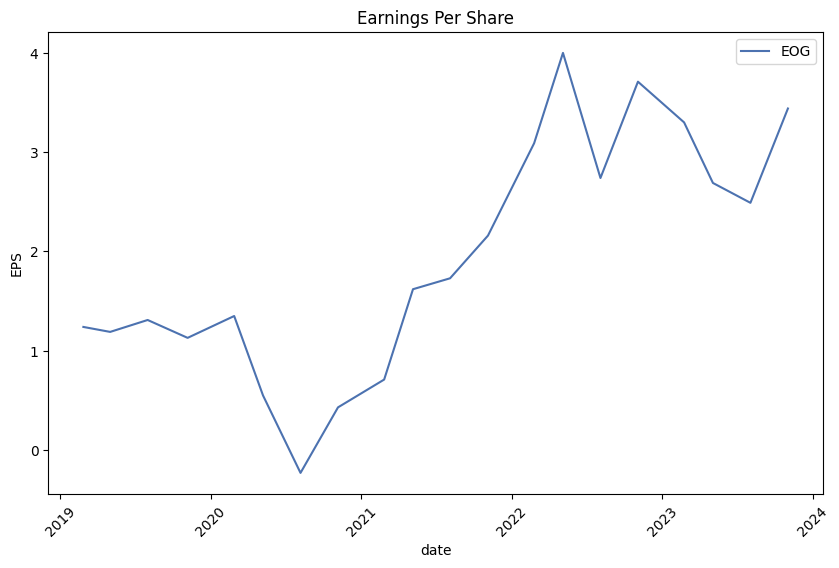
| Net Income to Common | 7,882,999,808 | Trailing EPS | 13.48 | Forward EPS | 12.04 |
| Peg Ratio | -9.79 | Enterprise to Revenue | 2.776 | Enterprise to EBITDA | 4.855 |
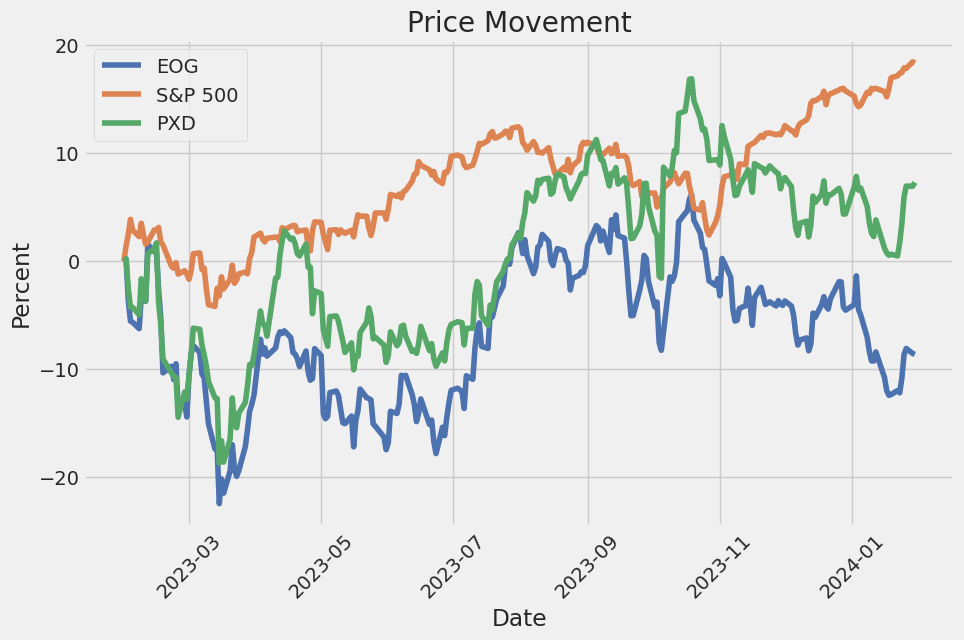
| 52 Week Change | -0.13073725 | S&P 52 Week Change | 0.20883334 | Current Price | 114.88 |
| Target High Price | 172.0 | Target Low Price | 113.0 | Target Mean Price | 139.67 |
| Target Median Price | 140.0 | Recommendation Mean | 2.2 | Number of Analyst Opinions | 27 |
| Total Cash | 5,326,000,128 | Total Cash Per Share | 9.133 | EBITDA | 13,564,000,256 |
| Total Debt | 4,143,000,064 | Quick Ratio | 1.953 | Current Ratio | 2.428 |
| Total Revenue | 23,726,999,552 | Debt to Equity | 14.925 | Revenue Per Share | 40.803 |
| Return on Assets | 0.14698 | Return on Equity | 0.3055 | Free Cash Flow | 3,514,249,984 |
| Operating Cash Flow | 11,680,000,000 | Earnings Growth | -0.284 | Revenue Growth | -0.196 |
| Gross Margins | 0.63118 | EBITDA Margins | 0.57167 | Operating Margins | 0.41131002 |
| Sharpe Ratio | -14.130607078427124 | Sortino Ratio | -231.92767082884865 |
| Treynor Ratio | -0.07788252840157214 | Calmar Ratio | -0.35905895566510954 |
Technical and Fundamental Analysis of EOG:
EOG Resources, Inc. operates as an oil and gas company, engaging in the exploration, development, production, and marketing of crude oil and natural gas. Upon reviewing the provided data for EOG, including technical indicators, fundamental analysis, and balance sheet information, the following insights are drawn:
Technical Analysis: The On-Balance Volume (OBV) trend shows a decline (from 0.26251 million to -3.10054 million over the period surveyed), suggesting that selling volume is outpacing buying volume, indicative of potential selling pressure. Meanwhile, the Moving Average Convergence Divergence (MACD) histogram appears to be stabilizing, with the latest values turning positive. This change typically suggests a shift towards bullish momentum.
Fundamental Analysis: Reviewing EOG's fundamentals reveals strong gross (63%), EBITDA (57%), and operating margins (41%), signifying efficient operations and profitability. Nonetheless, the various risk-adjusted performance metrics are negative, such as the Sharpe, Sortino, Treynor, and Calmar ratios, indicating that the stock underperformed on a risk-adjusted basis compared to the risk-free rate, showing that holding the stock has been more risky than profitable for investors over the past year.
Balance Sheet: EOG shows a formidable tangible book value of approximately $24.8 billion, which is indicative of a solid financial foundation. The net debt is not specified for the latest period; however, the total debt is $5.958 billion, showing a commitment to managing leverage effectively.
Cash Flows and Financial Performance: The company generated a healthy free cash flow of $6.093 billion. There was a significant amount of capital expenditure, indicating investment for future growth. Despite the large amount of dividends paid, EOG maintains a favorable cash position.
Analyst Expectations: The analyst expectations, showing a slight decrease in the EPS estimate for the current year, could induce investors to take caution, although there seems to be a positive outlook for the upcoming year with expected revenue growth of 5.3% and a 2.6% growth in the next year.
Score Summary: EOG sports an Altman Z-Score of 4.71 and a Piotroski Score of 7, suggesting the company is financially healthy and with solid profitability, respectively. The market capitalization suggests that EOG is a substantial player in its sector, and the revenue figure supports robust business activity.
In conclusion, the combination of EOG's strong fundamental base, as revealed by the analysis of the balance sheet and good financial health (as evidenced by the Altman Z-Score and Piotroski Score), is somewhat incongruent with the poor risk-adjusted performance ratios and negative sentiment reflected in the technical indicators. The anticipated growth in the next year's earnings and favorable revenue estimates, however, suggest that there might be a reversal of fortunes in the months ahead. Investors should monitor inventory, cost control, and production levels, as these will be key drivers of EOG's future performance. Given the market's forward-looking nature, coupled with the company's solid operational margins and financial health, the stock price is likely to stabilize and potentially appreciate, provided that broader market conditions do not deteriorate and that EOG continues to manage its financial and operational risks effectively.
In the context of the investment principles laid out in "The Little Book That Still Beats the Market," we have calculated two critical metrics for EOG Resources, Inc. (EOG), namely Return on Capital (ROC) and Earnings Yield. With a ROC of 40.07%, EOG demonstrates exceptional efficiency in deploying its capital to generate profits. This figure is substantially higher than the average within the industry and indicates that the company has a strong competitive position and a high-quality business operation, which is capable of delivering robust returns on the capital invested. Meanwhile, the Earnings Yield for EOG, calculated at 11.63%, is a measure of the company's profitability relative to its share price. An 11.63% earnings yield suggests that the company is generating substantial earnings compared to its stock price, indicating that the shares may be undervalued. Typically, a higher earnings yield can be more attractive to value investors looking for opportunities to buy into companies at a lower cost relative to their earnings. Both metrics are key components of Joel Greenblatt's "Magic Formula" investing strategy, which seeks out companies with high returns on capital and attractive earnings yields as potential investment opportunities. Based on these metrics, EOG Resources, Inc. seems to be performing very well and could be an interesting candidate for further analysis and investment consideration.
According to Benjamin Graham's principles, a strong history of dividend payments can be an indicator of a company's financial health and stability. Dividend payments demonstrate that a company generates enough cash flow not only to sustain its operations and invest in growth but also to return value to its shareholders.
Examining the dividend history provided for EOG Resources, Inc. (EOG), it is clear that the company has paid dividends consistently over the past years. The adjusted dividends over the years show progressive increases, which reflects positively on the company's ability to maintain and grow its dividend payouts, indicating strong financial management and a commitment to shareholder returns.
Here is a summary of the key points from the dividend history:
-
Dividend Growth: The dividend payouts have been growing incrementally over the analyzed period. For example, EOG's dividend was $0.03 per share in October 1998, and it has grown to $0.91 per share as of the latest data from January 2024. This represents an increase and suggests a continuous effort from EOG to enhance shareholder value.
-
Dividend Frequency: EOG appears to pay dividends quarterly, which is a common frequency for stable and mature companies. This regularity can be attractive to investors looking for steady income streams.
-
Special Dividends: There seem to be instances where EOG pays higher dividends than usual, for instance, a dividend of $1.5 on multiple occasions. This could indicate special circumstances or additional profitability that the company chose to share with its shareholders.
-
Consistency: There have been no observable interruptions in dividend payments over the years provided, which indicates a reliable and consistent approach to dividends and strong financial discipline.
When comparing EOG's dividend history to Graham's criteria, it's apparent that the company fulfills the preference for firms with a solid record of dividend payments. Consistent and growing dividends can imply a stable profit and cash flow, which Graham valued as a measure of a company's financial health.
Given the provided data, EOG's dividend history seems to align well with Benjamin Graham's criteria. However, it's important to remember that dividend history is just one aspect of an investment's attractiveness. The full investment profile of EOG should be analyzed in conjunction with other factors such as earnings growth, price-to-earnings (P/E) ratio, Price-to-Book (P/B) ratio, and debt-to-equity ratio, which have been provided. Graham would have considered these metrics collectively to assess the overall value and potential risk of investing in EOG.
Based on the data given: - The P/E ratio of 16.94 is relatively moderate, suggesting that the stock may not be overvalued, which could meet Graham's preference for stocks with low P/E ratios. - The P/B ratio of 1.62 indicates that the stock is trading above its book value but still may be considered reasonable by Graham's standards, especially if other fundamentals are strong. - A debt-to-equity ratio of 0.22 is low, pointing to limited financial risk, which would align with Graham's preference for companies with low leverage.
In summary, EOG Resources, Inc. appears to have strong dividend performance and financially conservative ratios which resonate with the general principles outlined by Benjamin Graham. However, investors should consider a comprehensive analysis including current market conditions, corporate strategic outlook, and possible sector-specific risks before making investment decisions.
| Statistic Name | Statistic Value |
| Alpha | 0.0076 |
| Beta | 1.1068 |
| R-squared | 0.230 |
| Adj. R-squared | 0.229 |
| F-statistic | 375.0 |
| Prob (F-statistic) | 2.65e-73 |
| Log-Likelihood | -3015.2 |
| AIC | 6034 |
| BIC | 6045 |
| No. Observations | 1,257 |
| Df Residuals | 1255 |
| Df Model | 1 |
| Standard Error | 0.057 |
| t-statistic | 19.365 |
| P-value | <0.001 |
| 95% CI Lower Bound | 0.995 |
| 95% CI Upper Bound | 1.219 |
| Skewness | -0.093 |
| Kurtosis | 9.478 |
| Cond. No. | 1.32 |
In the linear regression model between EOG Resources Inc. (EOG) and SPDR S&P 500 ETF Trust (SPY), alpha represents the expected return of EOG when SPY's return is zero. For the time period under analysis, the alpha value is 0.0076, indicating a slight positive expected return for EOG that is not dependent on the market's performance. This could imply that EOG has a small positive performance on its own, independent of the market trends represented by SPY.
The beta coefficient of this model is 1.1068, suggesting that for every 1% change in the SPY's return, EOG's return is expected to change by approximately 1.1%. With an R-squared value of 0.230, the model explains 23% of the variability in EOG's return based on SPY's return. This indicates that while there is some correlation between EOG and SPY, a significant portion of EOG's price movements is not explained by SPY's returns, pointing towards the presence of other factors influencing EOG's performance.
Summarized EOG Resources Q3 2023 Earnings Call:
Introduction: Tim Driggers, the CFO, initiated the call with a cautionary note on forward-looking statements and non-GAAP measures. He introduced other participating executives, including Ezra Yacob, Chairman and CEO, and various senior VPs and EVPs in charge of key business areas.
Financial and Operational Performance Overview (Ezra Yacob & Tim Driggers): Ezra Yacob shared the company's achievements over the past five years, which included significant production increase, free cash flow generation, net income, dividend growth, and debt reduction. He emphasized EOG's culture and employee performance, attributing the successful Q3 results to them. These results included better-than-expected production volumes, controlled capital expenditures, and reduced operating costs, allowing them to raise the full-year oil production guidance and lower the cash operating costs guidance. The company increased its regular dividend by 10% and announced a special dividend, reflecting confidence in its business outlook. Yacob highlighted their cost structure improvements, leveraging technology, and the diversified asset portfolio as enablers of a competitive dividend yield. Projecting into the future, he stated EOG could maintain current production levels and cover dividend commitments at oil prices as low as $45 WTI.
Tim Driggers, CFO, detailed a strong financial performance in Q3 with increased oil production, cost management, and strong operational execution. Adjusted net income and free cash flow were also reported, and he shared the allocation of capital for dividends and share repurchases. They plan to return a major chunk of free cash flow to shareholders, exceeding their minimum commitment for the year.
Operational Updates (Billy Helms & Jeff Leitzell): Billy Helms, COO, praised the operational team for exceeding forecasts in the third quarter. Efficiency gains, especially in the Eagle Ford play, led to reduced well costs and increased productivity. Helms mentioned cost guidance reductions for the full year and confirmed stable activity levels and spends similar to the current year for 2024. Emerging plays in Utica and Dorado are expected to receive slightly increased attention.
Jeff Leitzell, EVP, shared insights on the Utica asset, including low costs of entry, favorable geology, and existing infrastructure, which provide operational advantages. He outlined plans for continued delineation and efficient operation in 2024, aiming for improved well spacing and cost reductions reminiscent of EOGs exploration strategy.
Marketing and Future Outlook (Lance Terveen & Ezra Yacob): Lance Terveen, SVP Marketing, talked about pipeline projects in South Texas that will serve future gas flows, mentioning completed projects and plans for further expansion. They expect the pipeline to offer multiple market access and transportation cost savings.
In his wrap-up, Ezra Yacob reiterated the companys commitment to its value proposition and competitive edge, citing a high investment return standard and a strategic focus on organic exploration. He emphasized the diversity, high-return, and low-cost nature of their asset portfolio and the use of advanced technologies to keep improving well productivity, reduce costs, and expand margins.
Q&A and Closing Remarks: During the Q&A, numerous topics were discussed, with analysts inquiring about the rationale behind the company's increased shareholder cash returns and its confidence in doing so. Questions were also raised about the 2024 outlook, with speculations on increased activities in key plays such as the Utica and Dorado basins. There was interest in the cost and adoption of new well completion techniques and their impact on production and recovery rates. The company was asked about its strategy regarding exploration and development activities given the current market conditions, including offshore prospects and Carbon Capture and Storage (CCS) initiatives.
In closing, Ezra Yacob restated the companys focus on shareholder value and confidence in its strategic approach through asset management and free cash flow commitments, poised to face future energy industry changes.
EOG Resources, Inc. reported operating revenues of $6.2 billion for the third quarter of 2023, a decrease of $1.4 billion from the third quarter of the previous year. This decrease was primarily due to a reduction in wellhead revenues, which dropped by $1.4 billion. The company experienced decreased prices for crude oil and condensate, natural gas liquids (NGLs), and natural gas, which contributed to the decline in wellhead revenues despite a slight uptick in production volumes. Notably, EOGs total wellhead revenues were impacted by lower composite average prices, including a 13% decrease in composite wellhead crude oil and condensate prices and a 35% decrease in composite NGL prices.
The company also recognized net gains on the mark-to-market of financial commodity derivative contracts of $43 million during the third quarter of 2023, contrasting with net losses of $18 million in the same quarter of the previous year. Gathering, processing, and marketing revenues were also down by $83 million, and net gains on asset dispositions were reported at $35 million for the quarter.
Operating expenses for the third quarter of 2023 totaled $3.7 billion, a reduction of $274 million from the third quarter of 2022. This was due to a combination of factors across various cost categories, such as decreased transportation costs and lower depreciation, depletion, and amortization (DD&A) expenses related to both oil and gas properties.
Exploration costs increased by $8 million, totaling $43 million for the third quarter of 2023, primarily owing to increased administrative expenses in the United States. Impairment charges totaled $54 million for the quarter, a decrease from the same period in the previous year. Taxes other than income increased marginally to $341 million, reflecting a higher percentage of wellhead revenues than in the prior year.
EOG reported an income tax provision of $543 million for the third quarter of 2023, which was less than the $809 million provision recorded in the third quarter of 2022. This reduction was mainly due to lower pretax income, with the effective tax rate decreasing slightly to 21% from 22% in 2022.
Lastly, EOG's capital expenditures for the full year 2023 are forecasted to range between $5.9 billion and $6.1 billion, excluding acquisitions and non-cash transactions. The capital expenditure budget was primarily allocated to development drilling in the United States, particularly in the Delaware Basin and Eagle Ford plays. The company's cash balance decreased by $646 million during the first nine months of 2023, ending with $5.3 billion in cash and cash equivalents. The company also repurchased shares, declared dividends, and managed its debt levels during this period.
EOG Resources, Inc. (NYSE: EOG) encountered a stock price decline despite overall market gains, as observed by Zacks Equity Research on January 23, 2024. EOG shares fell by 0.24%, closing at $110.37 on a day when the S&P 500 advanced by 0.29%. The decrease is a part of a broader monthly dip of 9.51% in EOG's stock, countering the 5.56% sector loss and the S&P 500's 2.08% expansion within the same period.
Looking ahead, EOG Resources is projected to announce its earnings on February 22, 2024. The market expects earnings per share of $3.31, reflecting a 0.3% growth from the prior year's quarter, with revenues expected to be $6.32 billion, decreasing by 5.96% year-over-year. Investors and analysts will be paying close attention to these figures, considering recent adjustments in EOGs analyst estimates that suggest short-term business trends are in the state of flux.
Analysts have revised EOG Resources' consensus EPS estimate down by 5.86% in the past 30 days, and the company currently holds a Zacks Rank #3 (Hold). In comparison to its industry's forward P/E of 7.45, EOGs valuation appears richer, trading at a forward P/E of 8.71. The company's PEG ratio is at 0.3, below the industry average of 0.6.
Within the Oil and Gas - Exploration and Production - United States industry, EOG holds a Zacks Industry Rank of 251, placing it in the bottom 1% of more than 250 tracked industries. Industry rankings have historically been a strong forecaster of performance, indicating potential headwinds for the company in its sector.
Market analysts from Bank of America anticipate EOGs profits to rebound in the year ahead following a prior 5% decline. Furthermore, sales forecasts signal optimism for growth in 2024, while dividend distributions are likely to increase in the short term. EOG's zero net debt balance sheet and commitment to return 70% of free cash flow to shareholders through regular and special dividends underscore its attractive investment appeal.
EOG Resources is acknowledged for its strategic focus on capital returns and compelling valuation even amidst a challenging sector environment. With oil prices remaining in the low to mid-$70s and domestic natural gas prices around $3, the company continues to draw interest from investors due to its low price-earnings ratio and high yield. Its significant operations in New Mexico and Texas, as well as international ventures, demonstrate a strong operational footprint.
On the investment radar, EOG Resources has been recognized as one of the top energy stocks to watch. Its impressive third-quarter financial results, including an 11% quarter-over-quarter revenue increase to $6.21 billion, a 31% growth in net income, and an achievement of free cash flow worth $1.5 billion, speak to financial savvy and operational effectiveness. Analysts have stood by a "Strong Buy" rating, setting an ambitious price target for the stock with substantial upside potential.
Amidst the broader market scenario, the 2024 crude oil pricing outlook appears favorable, averaging around $77.99 per barrel, with production constraints by OPEC+ buoying prices. This contemplates well for EOG Resources, which is projected to flourish thanks to undrilled premium locations and an anticipated earnings growth of 6.8% in 2024.
The drilling landscape illustrates a cautious period for the industry. Baker Hughes Company anticipates a reduction in North American drilling and well completion spending for 2024, reflecting the volatility of commodity prices. In response, EOG Resources and other shale producers have scaled back drilling initiatives, focusing on investor returns over aggressive expansion.
This conservative approach towards drilling is further evidenced by a two-week consecutive decline in the Permian oil drilling rig count. With the United States rig count refuting a prolonged downturn, industry analysts hint at an emerging efficiency-driven slowdown in drilling activities. EOG, maintaining a Zacks Rank #3 (Hold), rejuvenates its commitment to capital efficiency and robust production potential despite the undercurrents of industry recalibration.
In contrast to sector dynamics, EOG Resources showed resilience in a recent trading session. The stock closed at $115.54, a bit higher than the prior day, outperforming the S&P 500's loss. This development came as investors continued to engage with the varying signals surrounding the company, including recent downward adjustments to EPS estimates and current valuations that reflect a premium over industry peers.
Finally, FERC's recent approval of two gas pipeline projects has interconnected EOG Resources' trajectory with national energy infrastructure developments. EOG has secured a 15-year contract for the Texas to Louisiana Energy Pathway project, a decision subject to industry debate but nonetheless a significant step towards augmenting natural gas transition strategies.
EOG Resources continues to keep investors informed, announcing a scheduled conference call and webcast to discuss 2023 fourth-quarter and full-year financial results on February 23, 2024. This forthcoming communication will provide clarity on the company's performance trajectory and future strategic maneuvers.
For additional information on EOG Resources, interested parties are encouraged to stay apprised of updates and reports available on Zacks.com and by following relevant links to articles detailed in this narrative.
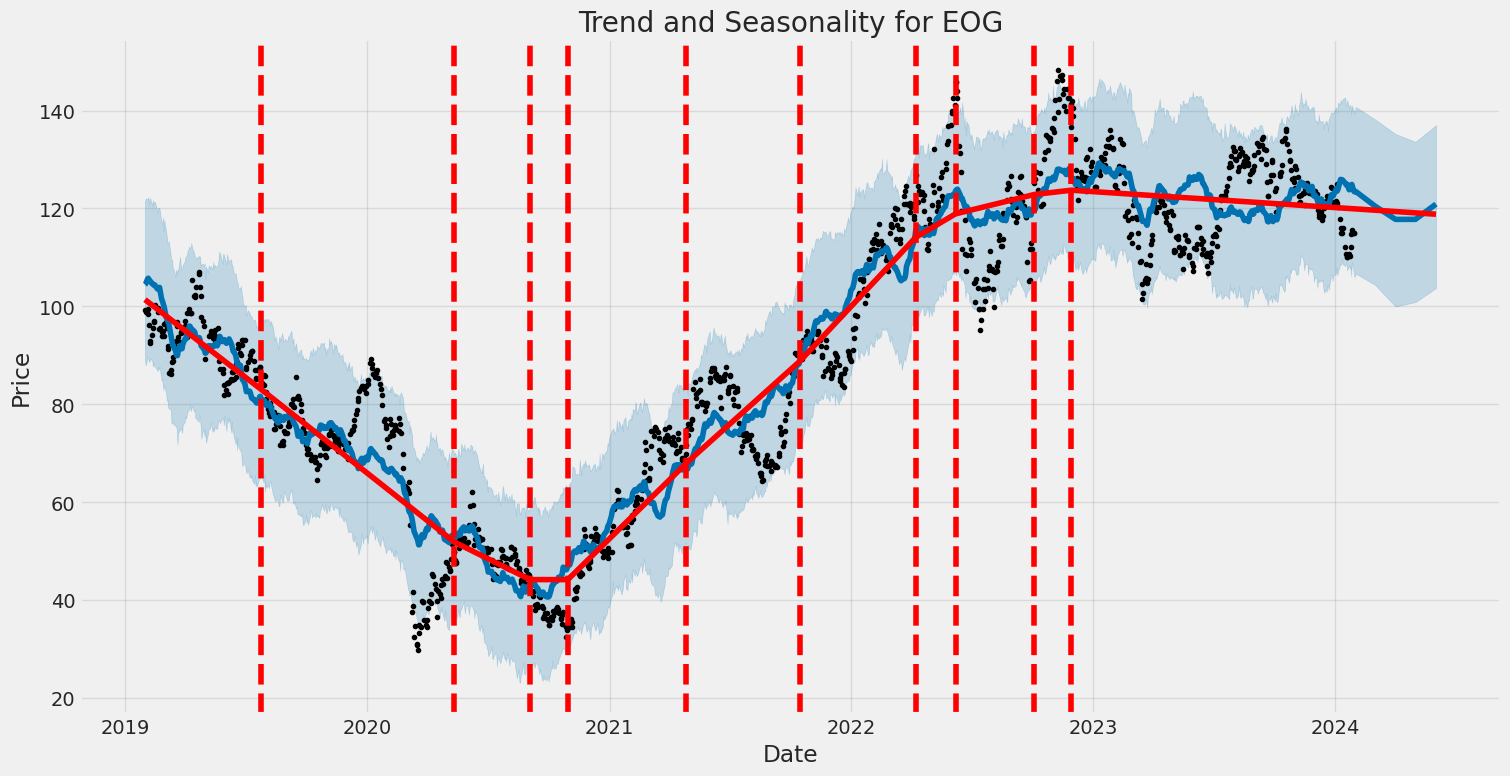
Over the specified period from January 31, 2019, to January 30, 2024, the volatility of EOG Resources, Inc. (EOG) was modeled using an ARCH process, indicating fluctuations in stock returns. Evidence of volatility is suggested by both the omega and alpha values; omega represents a long-term average volatility, and a significant positive omega of 6.8244 suggests a baseline level of variation in returns. Alpha, the parameter indicating the impact of previous time periods' shocks on current volatility, is also significant with a value of 0.2437, showing that past returns have a substantial influence on current volatility.
The associated HTML table for the ARCH model statistics is as follows:
| Statistic Name | Statistic Value |
|---|---|
| Log-Likelihood | -3118.01 |
| AIC | 6240.03 |
| BIC | 6250.30 |
| No. Observations | 1,257 |
| omega | 6.8244 |
| alpha[1] | 0.2437 |
To analyze the financial risk associated with a $10,000 investment in EOG Resources, Inc. (EOG) over a one-year period, both volatility modeling and machine learning predictions are instrumental. The volatility modeling method employed is designed to capture the temporal variance in stock price returns, which is essential in forecasting the level of risk in future time periods.
This volatility modeling approach is adept at understanding the changing risk profile of EOG Resources, Inc. by estimating the magnitude of expected fluctuations in the stock's price. It uses historical data to model the variance of the returns, allowing for clearer expectations of future volatility. This can be particularly useful in the energy sector where EOG operates, as it is often subject to price swings due to factors such as commodity prices, regulatory changes, and shifts in supply and demand.
On the other hand, machine learning predictions serve to forecast future stock returns by analyzing patterns within historical price data and various other financial indicators. The framework engaged for this purpose, akin to RandomForestRegressor, uses an ensemble of decision trees to make predictions about the stock's future performance. It leverages a myriad of input variables to generate a collective decision, which helps in capturing the complex relationships that could affect EOG's stock price.
When integrating both the volatility modeling and machine learning predictions, it is possible to gain a multifaceted view of the potential financial risk associated with the investment. Volatility modeling sets the groundwork for understanding the degree of expected price movement, while machine learning predictions contribute insights on the direction and magnitude of potential stock price returns based on historical trends and patterns.
The calculated Annual Value at Risk (VaR) at a 95% confidence level for a $10,000 investment in EOG Resources, Inc. stands at $308.71. This implies that there is a 5% probability that the investment in EOG could lose more than $308.71 over the next year. This figure is indicative of the investment's exposure to market risk and is a critical metric for investors looking to manage their portfolios effectively. It encapsulates the integrated findings from the volatility modeling and machine learning predictions, reflecting the maximum expected loss with a high degree of confidence, given normal market conditions.
The VaR metric at 95% confidence is instrumental for risk management purposes, as it quantifies potential losses in a standardized way. It enables investors to discern the level of capital that may be at risk and serves as a benchmark for assessing whether the investment aligns with the individual's or institution's risk tolerance. By combining the insights garnered from the two analytical approaches, investors can develop a more robust risk mitigation strategy for their investment in EOG Resources, Inc.
Similar Companies in Oil & Gas E&P:
Pioneer Natural Resources Company (PXD), Permian Resources Corporation (PR), Devon Energy Corporation (DVN), Coterra Energy Inc. (CTRA), Report: Marathon Oil Corporation (MRO), Marathon Oil Corporation (MRO), Diamondback Energy, Inc. (FANG), ConocoPhillips (COP), Hess Corporation (HES), Report: APA Corporation (APA), APA Corporation (APA), Range Resources Corporation (RRC), Murphy Oil Corporation (MUR), Occidental Petroleum Corporation (OXY), Cabot Oil & Gas Corporation (COG), Cimarex Energy Co. (XEC)
https://seekingalpha.com/article/4660602-my-top-10-high-yield-dividend-stocks-for-january-2024
https://seekingalpha.com/article/4660666-my-top-15-high-growth-dividend-stocks-for-january-2024
https://seekingalpha.com/article/4662467-5-upcoming-dividend-increases
https://www.gurufocus.com/news/2145761/eog-resources-is-returning-cash-to-shareholders
https://seekingalpha.com/article/4663110-eog-resources-continued-growth-and-the-utica-shale
https://finance.yahoo.com/news/international-paper-keysight-technologies-highlighted-085800436.html
https://finance.yahoo.com/m/b4d7c0fd-a377-3f54-8efc-24754d9d7bc7/ferc-approves-gas-pipeline.html
https://finance.yahoo.com/news/q1-rising-stars-3-energy-181614201.html
https://finance.yahoo.com/news/permian-oil-drilling-rig-count-130100922.html
https://finance.yahoo.com/news/eog-resources-eog-stock-dips-231520405.html
https://finance.yahoo.com/news/baker-hughes-bkr-expects-drop-153000931.html
https://finance.yahoo.com/news/eog-resources-eog-advances-while-230020747.html
https://www.sec.gov/Archives/edgar/data/821189/000082118923000051/eog-20230930.htm
Copyright © 2024 Tiny Computers (email@tinycomputers.io)
Report ID: PINZM4
Cost: $0.80707
https://reports.tinycomputers.io/EOG/EOG-2024-01-30.html Home