iShares U.S. Regional Banks ETF (ticker: IAT)
2024-01-28
 The iShares U.S. Regional Banks ETF (ticker: IAT) offers investors an opportunity to gain exposure to the U.S. regional banking sector through a single investment vehicle. This Exchange Traded Fund (ETF) tracks the performance of an index composed of U.S. equities in the regional banking sector, providing a diversified portfolio of regional bank stocks. The ETF is designed to represent an investment in medium-sized banks that typically focus on domestic operations as opposed to the larger multinational financial institutions. The regional banking industry often reflects the health of domestic economies and can provide insight into local economic trends. IAT is managed by BlackRock and aims for investment results that correspond generally to the price and yield performance of its underlying index. It is traded on the NYSE Arca, making it accessible to both individual and institutional investors who are looking to potentially benefit from the growth and dividend yield that regional banking firms may offer. Investors should consider the fees, risks, and investment profile of IAT in the context of their portfolios and investment objectives.

| Previous Close | 41.9 | Open | 41.92 | Day Low | 41.92 |
| Day High | 42.4293 | Trailing P/E | 9.7540455 | Volume | 130,497 |
| Average Volume | 325,026 | Average Volume (10 days) | 354,830 | Bid | 41.67 |
| Ask | 43.27 | Bid Size | 1,000 | Ask Size | 1,100 |
| Yield | 0.0356 | Total Assets | 733,911,296 | 52-Week Low | 28.8 |
| 52-Week High | 53.92 | 50-Day Average | 39.8344 | 200-Day Average | 35.73425 |
| NAV Price | 41.92998 | YTD Return | 0.0028681 | 3-Year Average Return | -0.021871 |
| 5-Year Average Return | 0.016478099 | Beta (3-Year) | 1.04 | Fund Inception Date | 1146441600 |

| Sharpe Ratio | -11.43557636477344 | Sortino Ratio | -173.1740012068982 |
| Treynor Ratio | -0.05620246615899208 | Calmar Ratio | -0.33069736722987986 |
An analysis of technical, fundamental, and balance sheet data for the IAT, as encapsulated by the provided information, provides insights into the stock's near-term price movement projection.
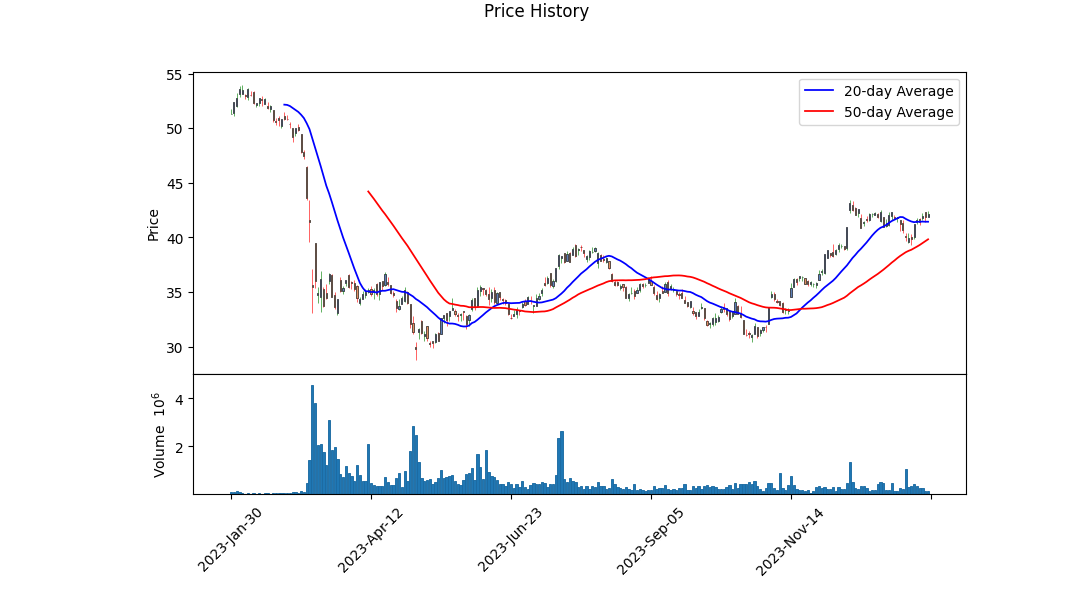
The technical indicators suggest that the stock has been on an upward trajectory, reflected by the increase in the opening price from $33.52 on 2023-10-02 to $41.92 on the last trading day. Furthermore, the on-balance volume (OBV) in millions has shown a positive accumulation, indicating buying pressure since October 2023. However, the momentum reflected by the MACD histogram is waning, with the value approaching zero. Such a convergence may be indicative of a potential reversal or consolidation phase in the near term.
The fundamental data points towards a relatively low trailing Price-to-Earnings (PE) ratio of 9.75, which could signal that the stock is undervalued compared to earnings, supporting a bullish sentiment. However, when considering the negative Sharpe, Sortino, Treynor, and Calmar ratios, there's an indication of adverse risk-adjusted returns over the past year, which may give pause to investors seeking stability.
The assets yield of 3.56% is relatively attractive and its NAV at $41.93 aligns closely with the stock's closing price, suggesting that the market is accurately pricing the ETF's underlying assets. Albeit, one must acknowledge that IAT's underlying sector, financials, is traditionally sensitive to interest rate changes which may affect yield-sensitive investments.
Balance sheet, cash flows, and financials summaries being empty could imply a lack of recent data, thus making it challenging to assess the company's health from a fundamental perspective thoroughly.
From the analyst expectations, a notable figure is the expense ratio of 0.40%, which is within acceptable ranges for an ETF, thus not likely to deter investment based on costs.
Given the absence of a complete picture from financials and balance sheet data, reliance on technical analysis becomes more prominent. Considering the improving OBV despite a flat MACD histogram, one might infer that while there is buying interest, caution is warranted due to momentum loss.
The projected movement over the next few months could see the stock's price move into a consolidation pattern as it encounters resistance from previously established highs. The proximity to its 52-week high could act as a psychological barrier and contribute to market consolidation. Given the low PE ratio and positive overall asset trend, barring adverse market conditions or unexpected news, we should anticipate sideways movement short-term, with a potential for a breakout on the upside as positive market forces prevail. Nonetheless, investors should keep an eye on interest rates and broader market indicators, as changes therein could have a notable impact on the financial sector and, consequently, IAT's price trajectory.
| Statistic Name | Statistic Value |
| R-squared | 0.509 |
| Adj. R-squared | 0.509 |
| F-statistic | 1,303 |
| Prob (F-statistic) | 2.45e-196 |
| Log-Likelihood | -2,404.1 |
| No. Observations | 1,257 |
| AIC | 4,812 |
| BIC | 4,822 |
| coef (const) | -0.0470 |
| coef (IAT) | 1.2683 |
| std err (const) | 0.046 |
| std err (IAT) | 0.035 |
| t (const) | -1.015 |
| t (IAT) | 36.104 |
| P>|t| (const) | 0.310 |
| P>|t| (IAT) | 0.000 |
| [0.025 0.975] (const) | -0.138 0.044 |
| [0.025 0.975] (IAT) | 1.199 1.337 |
| Omnibus | 219.281 |
| Prob(Omnibus) | 0.000 |
| Skew | -0.199 |
| Kurtosis | 11.585 |
| Cond. No. | 1.32 |
The linear regression model delineates the statistical relationship between the iShares U.S. Regional Banks ETF (IAT), which tracks an index of US regional bank stocks, and the SPDR S&P 500 ETF Trust (SPY), which represents the broader US stock market. The coefficient (also known as the 'beta' value) for IAT is 1.2683, indicating that on average, for every single unit increase in the SPY, the IAT increases by approximately 1.2683 units. The R-squared value is 0.509, meaning that about 50.9% of the variability in IAT can be explained by its relationship with SPY. The alpha (intercept) value of the regression is -0.0470, which suggests that when the SPY is at zero, the expected value of IAT is -0.0470.
Analysis of the regression's alpha coefficient, which is -0.0470, shows that it is not significantly different from zero, given the P-value of 0.310, which exceeds the common significance level threshold of 0.05. This implies that the intercept of the model is statistically insignificant and that IAT's average return does not significantly deviate from the performance expected by the model if SPY were neutral (no growth or decline). The broad relationship indicates potential positive movement of IAT in sync with SPY; however, the lack of significance of the alpha value means that over the time period studied, there is no evidence that IAT's performance is different from what could be expected based on the SPY index alone, after accounting for the slope of the line.
The iShares U.S. Regional Banks ETF (IAT) is an exchange-traded fund offering investors exposure to the regional banking sector within the United States stock market. Having launched on May 1, 2006, IAT is part of the BlackRock fund family and is designed to track the performance of the Dow Jones U.S. Select Regional Banks Index. IAT aims to provide investment results that, before fees and expenses, correspond generally to the price and yield performance of its underlying index.
BlackRock, the worlds largest asset manager, is known for its expertise in passive investment strategies, which is evident in the management approach for IAT. Passive management strategies like that of the iShares U.S. Regional Banks ETF are highly favored due to the cost efficiency, reduced tax overhead, and the transparency they provide. Both retail and institutional investors may find this approach to investing beneficial due to these attributes.
As of the latest data, the fund has amassed over $713.93 million in assets, a figure which suggests it is a moderate-sized player in the Financials - Regional Banks sector, according to the broader Zacks Industry classification. Within this classification, Financials - Regional Banks is strategically positioned, and IAT offers investors an opportunity to tap into this niche yet significant market segment.
When it comes to the cost of investment, IAT has an expense ratio of 0.40%. This figure is in line with other funds in the same category, allowing it to remain competitive. For investors in search of yield, IAT's 3.66% trailing 12-month dividend yield can be a compelling aspect of the fund, as it aims to provide a steady income stream.
Diving deeper into the fund's composition, it is important to note that it is entirely focused on the Financials sector, reflecting a specialized investment theme. The major holdings in the fund are significant players in the regional banking space, with U.S. Bancorp being the largest single holding, accounting for roughly 14.96% of the fund's total assets. PNC Financial Services Group Inc and Truist Financial Corp are also amongst the top holdings. As a collective, the top 10 holdings provide the backbone of the fund's assets.
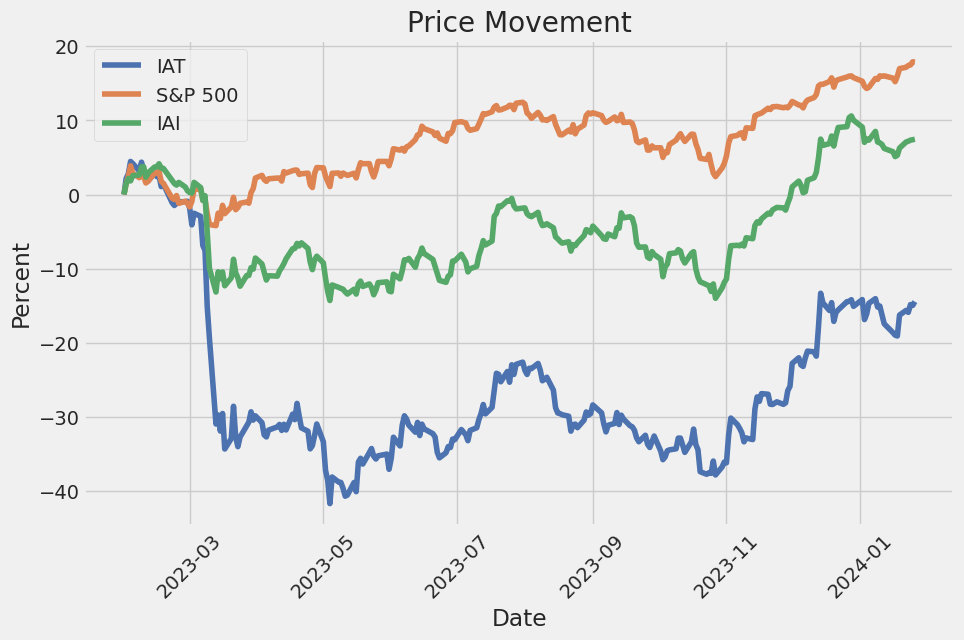
Performance-wise, IAT has shown a year-to-date decline of -2.77% as of January 15, 2024. The past 12-month performance also indicates a downtrend, with the ETF decreasing by approximately -16.26%. Price fluctuations over the last year have seen IAT trade between $29.75 and $53.61. The beta of 1.14 signifies a volatility higher than the general market, which is underscored by a high standard deviation, revealing the heightened risk associated with the fund. However, with around 39 holdings, IAT follows a more concentrated investment strategy, which is a common characteristic amongst similar ETFs in this space.
Taking a broader viewpoint, investors contemplating alternatives to IAT may also consider examining other similar ETFs like Invesco KBW Regional Banking ETF (KBWR) and the SPDR S&P Regional Banking ETF (KRE). These funds also focus on regional banking indices and have similar costs associated with them.
Despite the benefits, IAT carries a Zacks ETF Rank of 4 (Sell), which may predict an underperformance in comparison to its peers over the coming months. This rank is based on a range of factors, including the ETF's expected returns, its expense ratio, and current momentum in the market.
For those looking for further insights into the iShares U.S. Regional Banks ETF (IAT), exploring Zacks ETF Center can provide a more extensive resource base to aid investment decision-making. (Source: "Should You Invest in the iShares U.S. Regional Banks ETF (IAT)?" - Zacks.com, January 15, 2024)
| company | symbol | percent |
|---|---|---|
| U.S. Bancorp | USB | 14.87 |
| PNC Financial Services Group Inc | PNC | 13.61 |
| Truist Financial Corp | TFC | 10.86 |
| M&T Bank Corp | MTB | 5.02 |
| Fifth Third Bancorp | FITB | 4.64 |
| Huntington Bancshares Inc | HBAN | 4.11 |
| Regions Financial Corp | RF | 4.02 |
| First Citizens BancShares Inc Class A | FCNCA | 3.76 |
| Citizens Financial Group Inc | CFG | 3.44 |
| KeyCorp | KEY | 3.01 |
Recent analysis indicates optimistic trends for bank ETFs, particularly those like IAT that are focused on regional banks. As detailed in a Zacks.com article dated December 21, 2023, there are multiple contributing factors to a potential upward trend in the banking sector for the coming year.
One positive signal is the shifting yield curve, which after experiencing a period of flattening, is now expected to steepen, contributing to broader net interest rate margins that directly benefit regional banks. This is alongside a general repricing in the market, where many bank ETFs are currently seen as undervalued when compared to broad-market indices like the S&P 500, suggesting potential upside for investors.
Moreover, earnings reports from big banks have been robust, reflecting strong performance in both consumer and commercial banking services. This enduring banking strength is a good omen for regional banks and their associated ETFs.
Lastly, there is an affirmative trend in banking indicators, such as increased regional deposits and loans. The signals from the Federal Reserve that rate hikes might have reached their peak also imply that regional bank investments could begin to see a more positive trajectory moving forward.
These broad trends in the banking sector are pertinent for investors considering the iShares U.S. Regional Banks ETF. A harmonizing of these elements could drive growth within regional bank stocks and the ETFs harboring them, portraying a bright outlook for this financial segment in 2024. For detailed information and analysis, reference can be made to the Zacks.com article titled 4 Reasons Why Bank ETFs Can Rebound in 2024.
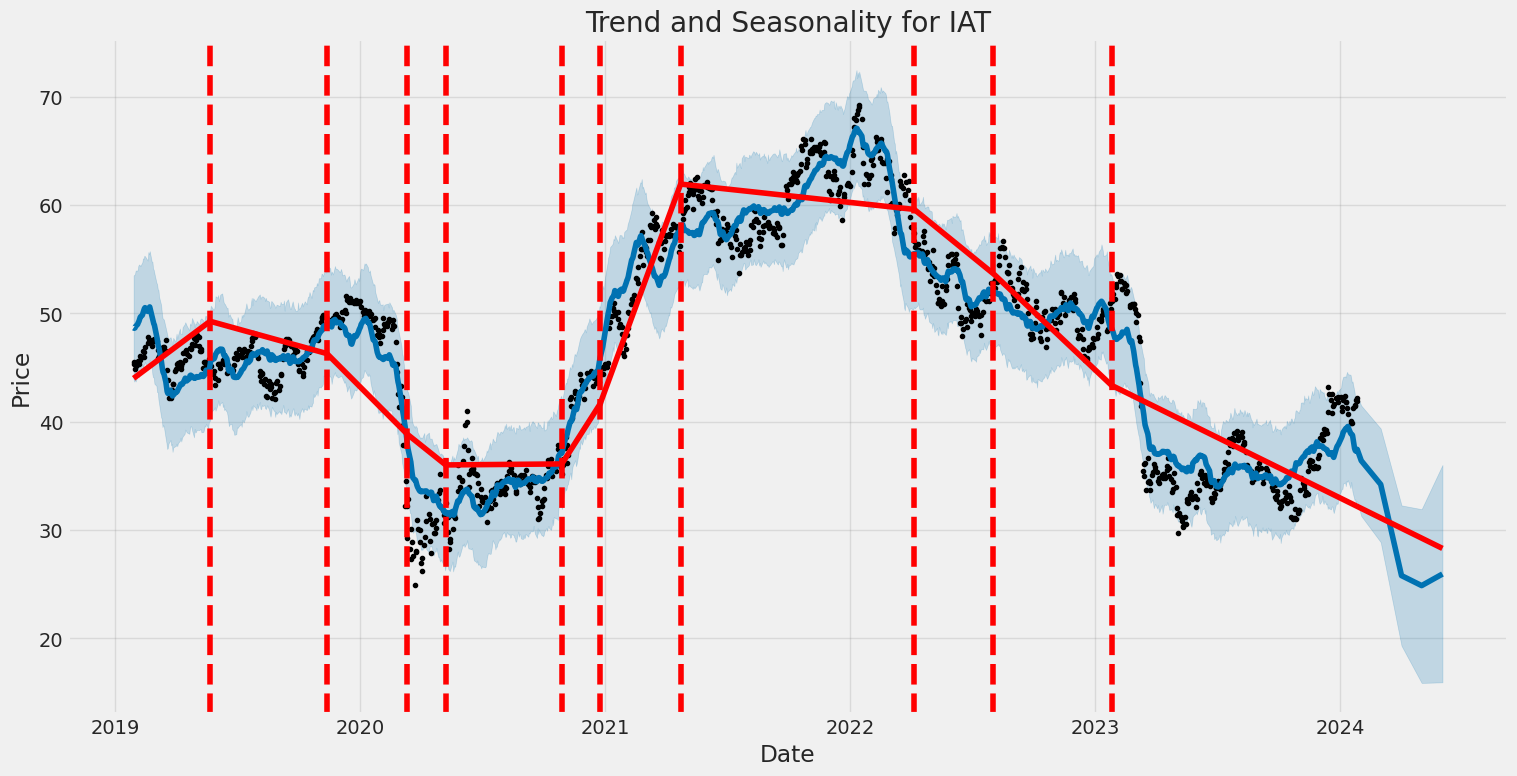
The volatility of the iShares U.S. Regional Banks ETF (IAT) from 2019 to 2024 can be summarized by noting that the returns of the ETF showed no appreciable linear trend over time, as suggested by the near-zero R-squared value. The ARCH model indicates that there is a significant level of volatility clustering, with large changes in asset returns tending to follow large changes, and vice versa, as indicated by the positive and significant alpha coefficient. Lastly, the omega value in the model points to a baseline level of variance, representing a starting point for the volatility process independent of past shocks.
| Statistic Name | Statistic Value |
|---|---|
| R-squared | 0.000 |
| Adj. R-squared | 0.001 |
| Log-Likelihood | -2714.86 |
| AIC | 5433.71 |
| BIC | 5443.99 |
| No. Observations | 1,257 |
| omega | 2.9746 |
| alpha[1] | 0.4686 |
To analyze the financial risk associated with a $10,000 investment in iShares U.S. Regional Banks ETF (IAT) over one year, we employ a combination of volatility modeling and machine learning predictions. This multifaceted approach allows for a thorough understanding of both the historical price behavior and potential future earnings.
Volatility modeling is a statistical method that is used to estimate the future fluctuations in the price of an asset, indicating how much an investment's price might change. In this case, we apply it to the IAT ETF to grasp its price volatility. Specifically, it is instrumental in comprehending how volatile the ETF is over time by examining the conditional variance in the series of ETF returns. The higher the volatility, the riskier the investment since the price is more unpredictable.
On the other side, machine learning predictions contribute by incorporating various factors and historical data to forecast future returns of the IAT ETF. A machine learning model, like a decision tree-based approach, is trained on historical return data to identify patterns and make predictions about future returns. This model can account for a multitude of nonlinear relationships and interactions that traditional statistical models may overlook, potentially improving the accuracy of the predictions.
Combining these two models, we determine the Value at Risk (VaR) at a 95% confidence interval. VaR is a widely used risk measure that provides an estimate of how much an investment might lose, with a given level of confidence, over a certain period. For the $10,000 investment in the IAT ETF, the calculated VaR is $392.58. This means that there is a 95% chance that the investment will not lose more than $392.58 over the one-year period, under normal market conditions.
This dual-model approach, integrating both the historical volatility and predictive insights from machine learning, provides a comprehensive view of the potential risks. The volatility model identifies the inherent risk based on historical fluctuations, while the machine learning model projects future returns based on complex patterns in data. The VaR figure derived from these analyses gives investors a quantifiable measure of what they might expect to lose, assisting in making more informed investment decisions.
Similar Companies in None:
iShares U.S. Broker-Dealers & Securities Exchanges ETF (IAI), iShares U.S. Insurance ETF (IAK), iShares U.S. Financial Services ETF (IYG), Report: iShares U.S. Financials ETF (IYF), iShares U.S. Financials ETF (IYF), iShares U.S. Oil Equipment & Services ETF (IEZ), Report: SPDR S&P Regional Banking ETF (KRE), SPDR S&P Regional Banking ETF (KRE), Invesco KBW Regional Banking ETF (KBWR), Vanguard Financials ETF (VFH), Report: Financial Select Sector SPDR Fund (XLF), Financial Select Sector SPDR Fund (XLF)
https://www.zacks.com/stock/news/2200942/4-reasons-why-bank-etfs-can-rebound-in-2024
https://seekingalpha.com/article/4661950-iat-etf-some-good-some-bad
https://www.zacks.com/stock/news/2209918/should-you-invest-in-the-ishares-u-s-regional-banks-etf-iat
Copyright © 2024 Tiny Computers (email@tinycomputers.io)
Report ID: adtlNg
Cost: $0.20227
https://reports.tinycomputers.io/IAT/IAT-2024-01-28.html Home