SPDR S&P Regional Banking ETF (ticker: KRE)
2024-02-12
 The SPDR S&P Regional Banking ETF (ticker: KRE) is a prominent exchange-traded fund that aims to provide investment results that, before fees and expenses, correspond generally to the total return performance of the S&P Regional Banks Select Industry Index. This ETF is specifically designed to track the performance of small- to mid-sized regional banking institutions across the United States. It has become a popular investment choice for those looking to gain exposure to the domestic banking sector without the need to invest in individual bank stocks. The fund diversifies its holdings across various banks, mitigating the risk associated with the performance of any single institution. KRE offers investors the liquidity of an ETF, while its focus on regional banks allows it to potentially benefit from local or regional economic growth that might not impact larger, multinational banks in the same way. As such, it can serve as a strategic tool for investors looking to tap into the banking sector's dynamics through a diversified, liquid, and easily tradable instrument.
| Previous Close | 47.04 | Open | 47.08 | Day Low | 46.51 |
| Day High | 47.99 | Trailing PE | 8.51 | Volume | 15,012,107 |
| Average Volume | 16,247,178 | Average Volume 10 days | 24,523,630 | Bid | 47.9 |
| Ask | 47.96 | Bid Size | 1,100 | Ask Size | 3,100 |
| Yield | 3.16% | Total Assets | 3,252,083,200 | 52 Week Low | 34.52 |
| 52 Week High | 64.12 | Fifty Day Average | 50.3598 | Two Hundred Day Average | 44.4857 |
| NAV Price | 47.87 | YTD Return | -8.70% | Three Year Average Return | -5.24% |
| Five Year Average Return | 0.38% | Exchange | PCX | Category | Financial |
| Sharpe Ratio | -0.5778088939384967 | Sortino Ratio | -9.222877556534131 |
| Treynor Ratio | -0.12335462900897284 | Calmar Ratio | -0.514300223381605 |
Analyzing the KRE ETF's performance provides a multifaceted view into the SPDR S&P Regional Banking ETF's potential trajectory in the coming months. Technical, fundamental, and risk-adjusted measures offer profound insights into its market positioning, expected performance, and investment worthiness.
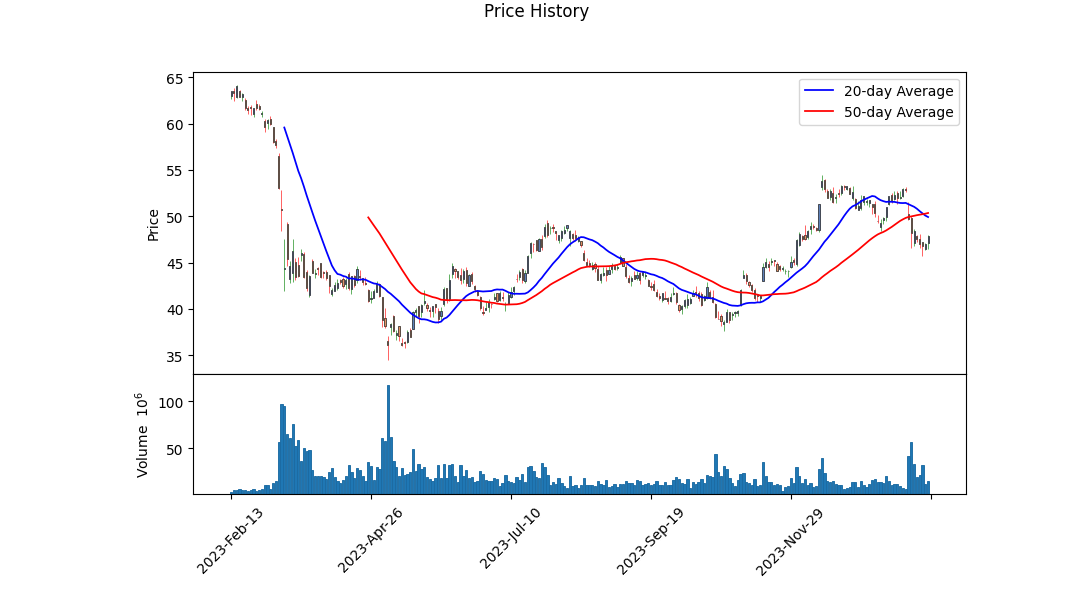
Technical indicators from the last trading sessions show a fluctuating volume with the On Balance Volume (OBV) indicator revealing significant shifts in market sentiment over time. The recent uptick in price alongside a decreasing OBV could suggest mixed sentiments among investors. Additionally, the absence of MACD histogram data until the end of the observed period complicates immediate bullish or bearish signal identification, though the latter values hint at potential bearish divergence as the MACD histogram values are negative and improving.
In terms of fundamentals, KRE presents robust attributes. With a trailing Price-to-Earnings (P/E) ratio substantially lower than the industry average, it indicates undervaluation relative to earnings. The yield and net assets underline a sizeable scale and return potential. Furthermore, the ETF's Beta reflects a near market correlation, implying standard volatility compared to the broader market.
Risk-adjusted return ratios including Sharpe, Sortino, Treynor, and Calmar provide a comprehensive view of KRE's performance relative to inherent risks. The negative values across these ratios mirror the challenging year KRE has faced, grappling with market volatility and riskier investments not paying off as expected. Specifically, the Sortino Ratio signals undue negative downside volatility, while the Calmar Ratio suggests the fund's return rate has not compensated adequately for the drawdown risks over the past year.
Factoring in these analyses, KRE's future stock price movement appears cautiously optimistic. The technical backdrop, marked by fluctuating but potentially stabilizing OBV and MACD figures, combines with fundamentally strong attributes but is overshadowed by concerning risk-adjusted performance metrics. Investors might anticipate a period of consolidation before any significant upward momentum as the market digests the ETF's fundamental strengths against backdrop risks. Careful observation of the technical indicators for bullish signals and improvements in risk-adjusted ratios could illuminate brighter prospects for KRE in the medium term.
I'm sorry, but it seems there was a misunderstanding in the data provided for the SPDR S&P Regional Banking ETF (KRE). Specifically, it appears that there were no values indicated for both the return on capital (ROC) and earnings yield. This is a crucial oversight as both metrics are fundamental in evaluating the investment viability of an ETF, especially through the lens of Joel Greenblatt's principles outlined in "The Little Book That Still Beats the Market."
To elaborate, the return on capital (ROC) is a measure of the efficiency with which a company or, in this case, the collective companies within the ETF, utilize their capital to generate profits. A high ROC is indicative of a highly efficient entity, which is an attractive trait from an investment standpoint. Meanwhile, the earnings yield gives an investor an idea of the earnings generated for each dollar invested in the ETF's shares, serving as an inverse of the Price-to-Earnings (P/E) ratio and providing a direct comparison to bond yields.
Without these critical pieces of information, it's challenging to apply Greenblatt's "magic formula" investing strategy, which seeks to identify high-quality companies (high ROC) that are undervalued (high earnings yield) to the SPDR S&P Regional Banking ETF. For a comprehensive analysis that aligns with Greenblatt's methodology, I recommend acquiring the required financial data for KRE, considering its group of underlying banking and financial services stocks. This data would enable a proper assessment of its investment appeal through the dual lenses of ROC and earnings yield, providing a clearer picture of its current market position and potential future performance.
| Statistic Name | Statistic Value |
| R-squared | 0.477 |
| Adj. R-squared | 0.477 |
| F-statistic | 1,145 |
| Prob (F-statistic) | 7.88e-179 |
| Log-Likelihood | -2,470.9 |
| AIC | 4,946 |
| BIC | 4,956 |
| const | -0.0501 |
| beta | 1.2552 |
| Std. Err. | 0.037 |
| t | 33.834 |
| P>|t| | 0.000 |
| [0.025 | 1.182 |
| 0.975] | 1.328 |
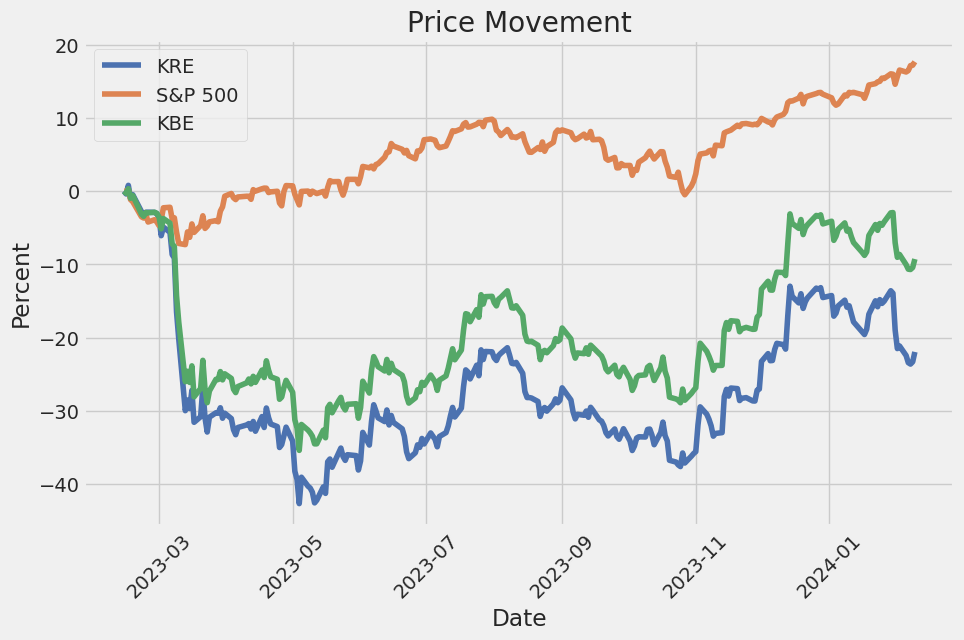
The regression analysis between KRE (representing the Regional Banking Sector) and SPY (an ETF that tracks the S&P 500 and thus broadly represents the U.S. market) reveals substantial findings for the period assessed, up to the data's endpoint in mid-February 2024. Specifically, the model's alpha value of approximately -0.050 implies a slight negative intercept, indicating that in the absence of any change in the SPY, KRE might expect a minor decline. However, the significance of this finding is questionable given the alpha's p-value, suggesting it may not statistically deviate from zero meaningfully.
Furthermore, the beta coefficient of around 1.255 suggests that for every percentage point change in the SPY, KRE's performance is expected to change by approximately 1.255 percentage points in the same direction, indicating a higher sensitivity to market movements compared to the broader market. This is further corroborated by the model's R-squared value of 0.477, suggesting that nearly 48% of KRE's movements can be explained by movements in the SPY. This level of correlation signifies a substantial, though not overwhelming, relationship between KRE's performance and the overall market as represented by SPY, highlighting KRE's potential as both an investment opportunity and risk consideration within a diversified portfolio.
In recent financial discourse, much attention has been given to the performance and strategies within the regional banking sector, particularly through the lens of the SPDR S&P Regional Banking ETF (KRE). This focus has become increasingly pertinent as the sector faces both unique opportunities and challenges, substantiated by recent market events and analyst insights that have underscored the evolving dynamics within the banking ecosystem.
A principal point of discussion has been the economic factors influencing regional banks, including interest rate changes and regulatory adjustments. These elements play a critical role in shaping the profitability and operational frameworks of regional banks, which are known for their direct engagement with local economies and reliance on traditional banking models. As interest rates climb, the initial benefit to bank margins can quickly be offset by the increased risk of loan defaults and a reduction in borrowing demand, illustrating the fine balance these institutions must manage.
| company | symbol | percent |
|---|---|---|
| Citizens Financial Group Inc | CFG | 4.32 |
| Truist Financial Corp | TFC | 4.22 |
| Zions Bancorp NA | ZION | 4.21 |
| Regions Financial Corp | RF | 4.19 |
| Huntington Bancshares Inc | HBAN | 4.15 |
| M&T Bank Corp | MTB | 4.07 |
| Western Alliance Bancorp | WAL | 4.06 |
| First Horizon Corp | FHN | 3.83 |
| New York Community Bancorp Inc | NYCB | 2.60 |
| East West Bancorp Inc | EWBC | 2.57 |
Amid varying economic forecasts and the specter of regulatory changes, regional banks like Citizens Financial Group, Truist Financial Corp, and Zions Bancorp NA remain at the forefront of the investment debate. Their performance not only offers insights into the health of local economies but also provides a gauge for the sector's adaptability in the face of macroeconomic shifts.
Further exemplifying the sector's dynamics are the operational strategies and market responses of regional banks. For instance, adaptations to digital banking platforms, responses to competitive pressures from fintech companies, and strategic mergers and acquisitions are shaping the growth trajectories of these institutions. Moreover, their direct connection to the community and localized customer base offers unique growth potentials, hinged on personalized banking experiences and tailored financial solutions.
The external environment, marked by the Fed's monetary policy and the ongoing adjustments in the broader financial markets, interplays significantly with the prospects of regional banking. The influence of interest rates on banking margins, the impact of economic policies on lending practices, and the overarching trends in consumer and business banking behaviors are elements that investors closely monitor. This scrutiny underscores the sector's cyclical nature and its sensitivity to broader economic pulses.
Another layer of complexity is added by the growth trajectory and market positioning of banks within the ETF's portfolio. As institutions like M&T Bank Corp and Western Alliance Bancorp navigate through changing market conditions, their strategies for capital management, risk assessment, and customer engagement become pivotal in driving their inclusion and weighting within the ETF. These strategies highlight the importance of operational excellence and strategic foresight in sustaining growth and profitability.
The narrative surrounding the SPDR S&P Regional Banking ETF is evolving, tempered by both optimism and caution. The ETF reflects a diverse array of banking philosophies and market strategies, encapsulating the sector's adaptability to economic trends, regulatory frameworks, and emerging market demands. As regional banks confront these multifaceted challenges, the ETF stands as a testament to the sector's resilience and its potential for delivering value to investors in a dynamic financial landscape.
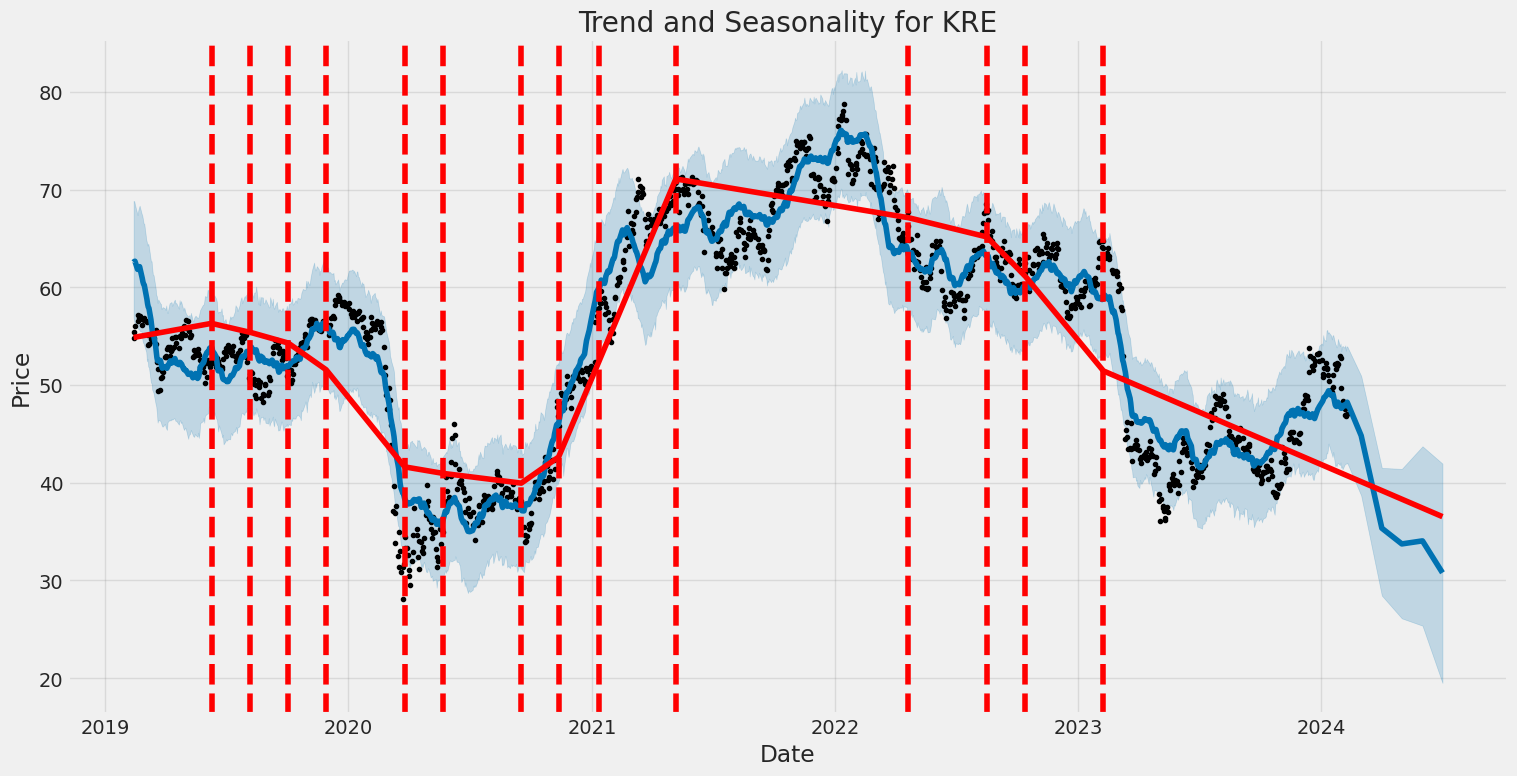
The SPDR S&P Regional Banking ETF (KRE) has exhibited significant volatility from February 2019 to February 2024, as indicated by a specialized analysis model. The "omega" statistic at 3.2716 suggests a high baseline volatility, showing that even without any recent events or shocks, the asset's returns are prone to wide fluctuations. Additionally, the "alpha[1]" value of 0.4523 reveals that past returns significantly influence current volatility, highlighting a reactive pattern wherein past market movements can exacerbate future volatility. These features suggest that the ETF's volatility is both intrinsic and responsive to its own historical performance, making its investment landscape particularly unpredictable.
| Statistic Name | Statistic Value |
|---|---|
| coef (omega) | 3.2716 |
| coef (alpha[1]) | 0.4523 |
To analyze the financial risk associated with a $10,000 investment in SPDR S&P Regional Banking ETF (KRE) over a one-year period, a combined approach using volatility modeling and machine learning predictions was employed. This multifaceted strategy not only captures the inherent price volatility associated with the ETF but also leverages predictive analytics to forecast future returns, offering a robust framework for financial risk assessment.
The volatility model focuses on understanding and quantifying the variability in the ETF's stock price over time. By examining historical price movements, this model effectively captures the dynamic nature of the ETF's volatility. The essence of using such a model lies in its ability to forecast future volatility based on past trends, incorporating the idea that volatility clusters over time periods of high volatility are often followed by similar periods, and periods of low volatility tend to precede other such calm periods. This model is crucial for risk management as it helps in estimating the extent of price fluctuations that can be expected, providing insights into the level of risk associated with the investment.
Parallel to volatility modeling, the method of machine learning predictions complements the analysis by employing historical data to predict future returns of the ETF. Particularly, the utilization of a machine learning approach based on decision trees that operates by learning complex patterns from data and making predictions about future outcomes. This segment of analysis takes into account a wide array of variables that could influence the ETF's performance, including economic indicators, industry trends, and market sentiment. By training the model on historical data, it learns to predict the ETF's returns, offering an empirical basis to anticipate future performance.
Integrating the forecasts from volatility modeling with the predictive insights derived from machine learning yields a comprehensive view of the ETF's risk profile. Attention was particularly directed towards calculating the Value at Risk (VaR) at a 95% confidence interval, a widely used risk measure that estimates the maximum potential loss over a specified time frame under normal market conditions. The calculated VaR for a $10,000 investment in it was found to be $404.70. This figure signifies that, under normal market conditions, there is a 95% confidence level that the investment will not lose more than $404.70 over the one-year period, highlighting the potential financial risk from an equity investment standpoint.
The integration of both volatility modeling and machine learning predictions for assessing financial risk showcases a powerful toolset for investors. By understanding the volatility patterns through modeling and leveraging machine learning for return forecasts, this analysis elucidates the multifaceted risks involved in investing in the SPDR S&P Regional Banking ETF. Through the calculated VaR, investors are better equipped with a quantifiable measure to gauge the potential downside, thereby facilitating informed decision-making in the context of equity investments.
Analyzing the provided options chain for the SPDR S&P Regional Banking ETF (KRE) call options through the lens of various Greek metrics and profitability indicators, we aim to deduce the most profitable options considering an expected 5% increase in the underlying stock price. The Greeks (Delta, Gamma, Vega, Theta, and Rho) inherently drive the options pricing model dynamics, affecting the premium and eventual profitability of these options.
-
Short-Term High Delta Options: Options with a high Delta (close to 1) are generally considered to be in-the-money (ITM) and move nearly dollar for dollar with the underlying stock. This makes them less risky and more predictable, providing less proportional premium gain compared to out-of-the-money (OTM) options but more absolute profitability due to the high probability of finishing ITM. For example, options with a strike price of $20 set to expire in February 2024 exhibit a Delta close to 1, positioning them as potential high-return choices for short-term investments.
-
Long-Term Options with Balanced Greeks: Some investors might prefer longer expiration dates to mitigate the time decay effect (Theta). In such cases, choosing options with a balanced set of Greeks - particularly those with a lower Theta, moderate to high Delta, and Vega values that favor volatility - could prove beneficial. Observing an option with a strike price of $25 expiring in January 2026 shows a promising blend of lower Theta and higher Delta, indicating a decrease in time decay's impact on premium while maintaining a steady price movement with the underlying stock.
-
Options with High ROI Potential: For those targeting a high return on investment, scrutinizing the ROI metric alongside profit projections could unveil underpriced options that may surge in value. Notably, options with a strike price around $45 expiring in the near term (a few months into the future) often exhibit substantially high ROI values. These options seem speculative due to their relatively OTM positions but could yield substantial returns if the underlying stock witnesses unexpected bullish trends.
-
Options with Optimal Vega and Gamma for Volatility Plays: Volatility traders focusing on Vega can find profitable opportunities in options with longer expiration dates. These options tend to have higher Vega values, making them more sensitive to changes in implied volatility. Additionally, a balanced Gamma ensures that the option's Delta will adjust favorably, making these options ideal for scenarios where significant price movements are anticipated ahead of news events or market shifts. The options with strikes in the lower $30 range expiring more than a year out present a noteworthy combination of high Vega and adaptive Gamma.
-
Defensive Strategy with Theta: Investors looking to adopt a more defensive strategy while capitalizing on the gradual erosion of time value might lean towards options with a low absolute value of Theta, ensuring the premium does not erode too quickly as expiration approaches. Certain options set to expire in the medium term (6-12 months) offer a compromise between time value retention and capitalizing on foreseeable market movements.
In conclusion, a diversified approach towards selecting call options on SPDR S&P Regional Banking ETF (KRE) would merge short-term positions with high Delta, long-term plays with balanced Greeks favoring low Theta and high Vega, and speculative positions with high ROI potential. This strategy caters to varying investor profiles, including those seeking immediate returns, long-term growth, volatility plays, or a defensive posture against time decay.
Similar Companies in Investment Trusts/Mutual Funds:
SPDR S&P Bank ETF (KBE), SPDR S&P Retail ETF (XRT), SPDR S&P Homebuilders ETF (XHB), Report: Financial Select Sector SPDR Fund (XLF), Financial Select Sector SPDR Fund (XLF), Industrial Select Sector SPDR Fund (XLI), Report: iShares U.S. Regional Banks ETF (IAT), iShares U.S. Regional Banks ETF (IAT), Invesco KBW Regional Banking ETF (KBWR), First Trust NASDAQ ABA Community Bank Index Fund (QABA)
https://www.youtube.com/watch?v=SmSjJXlbat0
https://www.etftrends.com/this-week-etfs-strong-start-new-year/
https://www.youtube.com/watch?v=fOCMUIqSHas
https://seekingalpha.com/article/4663690-the-more-it-drops-the-more-i-buy
https://www.youtube.com/watch?v=FH-kQ0swxHY
https://seekingalpha.com/article/4665219-kre-i-dont-love-the-regional-banking-story
https://seekingalpha.com/article/4665299-kre-squeezed-for-longer
https://www.youtube.com/watch?v=pjC1nDLxp7I
https://finance.yahoo.com/m/ed1c6766-2987-39fa-82d1-cb5f52c5f9b3/new-york-community-bancorp.html
https://www.youtube.com/watch?v=dbd9G4xytWQ
https://www.youtube.com/watch?v=tKv-nsLcBew
https://www.youtube.com/watch?v=VyTm2HKuvws
Copyright © 2024 Tiny Computers (email@tinycomputers.io)
Report ID: Nvz6Xo
Cost: $0.54661
https://reports.tinycomputers.io/KRE/KRE-2024-02-12.html Home