McDonald's Corporation (ticker: MCD)
2024-05-15
 McDonald's Corporation (ticker: MCD) is a global leader in the fast food industry, known for its extensive network of over 38,000 locations in more than 100 countries. Founded in 1940 and headquartered in Chicago, Illinois, McDonald's has built a robust business model centered around franchising, with approximately 93% of its restaurants operated by independent franchisees. The company generates significant revenue through sales of its iconic products such as the Big Mac, McNuggets, and Happy Meals, as well as through various value meals and promotions. In addition to its traditional menu, McDonald's has expanded its offerings to include healthier options, digital ordering systems, and delivery services, adapting to changing consumer preferences and technological advancements. The company's strong brand recognition, consistent innovation, and strategic international expansions have solidified its position as a dominant player in the global fast food market. Financially, McDonald's continues to demonstrate resilience and growth, consistently delivering solid earnings and dividends to its shareholders.
| Full-Time Employees | 100,000 | Market Cap | $197,854,363,648 | Enterprise Value | $245,166,702,592 |
| Total Revenue | $25,764,700,160 | EBITDA | $13,809,500,160 | Net Income to Common | $8,595,800,064 |
| Return on Assets | 13.991% | Current Ratio | 0.83 | Quick Ratio | 0.63 |
| Free Cash Flow | $6,313,612,288 | Operating Cash Flow | $9,581,899,776 | Total Debt | $50,944,999,424 |
| Volume | 2,175,346 | Average Volume | 3,333,232 | Shares Outstanding | 720,681,984 |
| Profit Margins | 33.363% | Gross Margins | 57.006% | EBITDA Margins | 53.599% |
| Sharpe Ratio | -0.5459044480081668 | Sortino Ratio | -8.24364480099585 |
| Treynor Ratio | -0.17566899421886775 | Calmar Ratio | -0.2688820732446194 |
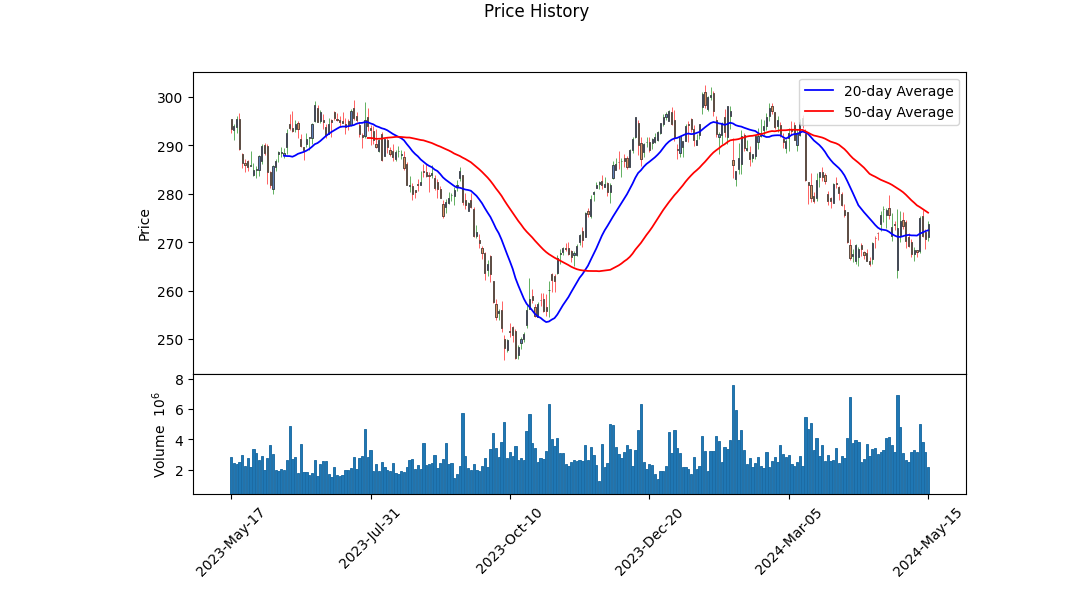
The recent technical indicators show mixed signals for McDonald's (MCD) stock over the last trading period. The stock's price ranged between $268 to $302, indicating significant fluctuations. The On-Balance Volume (OBV) turned negative, highlighting distribution phases where trading volume was higher on down days. The MACD histogram has recently shown signs of positive momentum but remains prone to volatility.
From a fundamental analysis perspective, McDonald's demonstrates strong financials with impressive EBITDA margins of 53.599% and operating margins of 44.205%. The gross margins are also robust at 57%, portraying operational efficiency. The companys trailing PEG ratio of 2.329 indicates potential overvaluation when compared to their growth rate.
Analyzing the risk-adjusted return metrics provides deeper insights. A Sharpe Ratio of -0.5459044480081668 suggests that McDonald's performance has not adequately compensated for the risk taken during the past year. The Sortino Ratio of -8.24364480099585 indicates underperformance with regards to downside risk, emphasizing the negative deviation of returns over the past year. The Treynor Ratio at -0.17566899421886775 further signifies that McDonald's returns do not effectively compensate for market risk borne by the investors. Finally, the Calmar Ratio at -0.2688820732446194 implies a poor risk-adjusted return relative to maximum drawdown over the period considered.
McDonald's financial overview shows consistency in generating substantial income from operations, with a high normalized EBITDA of $14 billion and stable cash flows. The recent financials reveal revenue growth over the years, with current total revenues of approximately $25 billion for 2023. Moreover, McDonald's maintains a significant market capitalization of $195.651 billion. Despite a substantial total debt of around $53 billion, McDonald's liquidity remains sound with a positive cash position and significant cash flow from operating activities.
In anticipation of the next few months, McDonald's stock price may experience continued volatility but is likely to sustain within a broad range, driven by its strong fundamental base and the mixed technical and risk indicators. The company's financial stability and margin efficiency provide a solid foundation, even though risk-adjusted returns signal caution. Investors should be mindful of short-term fluctuations while appreciating McDonald's enduring operational strengths and market position.
In evaluating McDonald's Corporation (MCD) using the methodologies outlined in "The Little Book That Still Beats the Market," we have derived a return on capital (ROC) of 23.83% and an earnings yield of 4.25%. The ROC, a measure of the efficiency with which the company uses its capital to generate profits, is robust at 23.83%, indicating that McDonald's is highly adept at turning its investments into profitable returns. This strong ROC suggests that the company has a competitive advantage and efficiently allocates its resources to maximize shareholder value. Meanwhile, the earnings yield of 4.25%, which inversely represents the price-to-earnings ratio, reflects the earnings generated relative to the company's market value. While not exceedingly high, this earnings yield implies a moderate return on investment for shareholders, given the current stock price. Together, these metrics highlight McDonalds strong operational efficiency and a reasonable valuation in the market, reinforcing its status as a potentially attractive investment in the fast-food industry.
Research Report: McDonald's Corporation (MCD) Analysis Based on Benjamin Graham's Criteria
Introduction
In this report, we examine McDonald's Corporation (MCD) through the lens of the investment principles espoused by Benjamin Graham in his seminal work "The Intelligent Investor." Graham's approach, rooted in value investing and fundamental analysis, emphasizes buying securities at prices well below their intrinsic values, thereby providing a "margin of safety" against market volatility and analytic errors. We will assess McDonald's key metrics and analyze how they align with Graham's criteria for stock selection.
Key Metrics and Graham's Criteria
- Price-to-Earnings (P/E) Ratio
- MCD P/E Ratio: 27.27
- Industry P/E Ratio: 43.48
- Graham's Criteria: Graham preferred companies with relatively low P/E ratios, which suggests they are undervalued compared to industry peers.
-
Analysis: McDonald's current P/E ratio of 27.27 is significantly lower than the industry average of 43.48. While Graham would likely consider this favorable, it is important to recognize that a P/E of 27.27 is still relatively high in absolute terms. Nonetheless, the comparative lower P/E suggests McDonald's may be relatively undervalued within its industry.
-
Price-to-Book (P/B) Ratio
- MCD P/B Ratio: 3.52
- Graham's Criteria: Graham often favored stocks trading below their book value.
-
Analysis: With a P/B ratio of 3.52, McDonald's is trading significantly above its book value. This does not align well with Graham's preference for stocks trading at or below book value. This could imply that the market perceives McDonalds as having significant intangible assets or future growth potential.
-
Debt-to-Equity Ratio
- MCD Debt-to-Equity Ratio: -10.67
- Graham's Criteria: Graham preferred companies with low debt-to-equity ratios to minimize financial risk.
-
Analysis: The negative value for McDonald's debt-to-equity ratio is unusual and warrants a closer look. This typically indicates that a company has more liabilities than equity, suggesting very high leverage or negative equity. Such a scenario would generally be unfavorable according to Graham's criteria, as it implies higher financial risk.
-
Current and Quick Ratios
- MCD Current Ratio: 1.16
- MCD Quick Ratio: 1.16
- Graham's Criteria: Graham used these ratios to assess a company's ability to cover short-term liabilities with short-term assets. He preferred ratios above 1.5.
-
Analysis: Both the current and quick ratios for McDonald's are 1.16, which, while above 1, fall short of Graham's preferred threshold of 1.5. This suggests that McDonald's might not have as strong a liquidity position as Graham would typically look for, indicating moderate financial stability.
-
Earnings Growth
- Earnings Growth Consistency: An important aspect of Grahams analysis.
- Graham's Criteria: Consistent earnings growth over several years.
- Analysis: Although specific earnings growth data for MCD is not provided in the metrics, analyzing McDonald's historical financial performance would be critical. Any indication of consistent earnings growth would be a positive signal aligning with Graham's criteria.
Conclusion
Based on the provided metrics, McDonald's Corporation meets some of Benjamin Graham's investment criteria but falls short in others:
- The P/E ratio of 27.27, while high in absolute terms, is significantly lower than the industry average, suggesting potential relative undervaluation.
- The high P/B ratio of 3.52 indicates that the stock is trading well above its book value, which deviates from Graham's preference.
- A negative debt-to-equity ratio points to substantial financial leverage, which would be a red flag for Graham.
- Current and quick ratios of 1.16, below Grahams threshold of 1.5, indicate moderate liquidity and financial stability.
- Consistent earnings growth would need to be evaluated for a comprehensive assessment.
Investors adhering strictly to Grahams guidelines might find McDonald's lacking in certain key areas. However, the relatively low P/E ratio compared to industry peers offers a potential point of interest. Further qualitative and quantitative analyses would be necessary for a well-rounded investment decision.### Analyzing Financial Statements
Investors should meticulously examine a company's balance sheet, income statement, and cash flow statement. Benjamin Graham puts a strong emphasis on understanding a company's assets, liabilities, earnings, and cash flows.
Below is a detailed analysis of McDonald's Corporation's financial statements for the fiscal period ending March 31, 2024 (Q1 2024), including comparative data from previous periods.
Balance Sheet Analysis
Assets:
- Current Assets:
- Cash and Cash Equivalents: $838 million
- Accounts Receivable: $2.24 billion
- Inventory: $46 million
- Prepaid Expenses and Other Current Assets: $935 million
-
Total Current Assets: $4.06 billion
-
Non-Current Assets:
- Investments in Affiliates, Subsidiaries, Associates, and Joint Ventures: $2.88 billion
- Goodwill: $3.03 billion
- Other Non-Current Assets: $5.59 billion
- Property, Plant, and Equipment (Net): $24.68 billion
- Total Non-Current Assets: $47.45 billion
- Total Assets: $53.51 billion
Liabilities:
- Current Liabilities:
- Short Term Borrowings: $604 million
- Accounts Payable: $936 million
- Operating Lease Liabilities: $685 million
- Accrued Income Taxes: $873 million
- Accrued Expenses and Other Current Liabilities: $1.14 billion
-
Total Current Liabilities: $4.89 billion
-
Non-Current Liabilities:
- Long-Term Debt: $36.76 billion
- Operating Lease Liabilities: $12.83 billion
- Deferred Revenue: $784 million
- Deferred Tax Liabilities: $1.80 billion
- Total Non-Current Liabilities: $53.51 billion
Stockholders' Equity: - Common Stock Value: $17 million - Additional Paid-in Capital: $9 billion - Retained Earnings: $64.20 billion - Treasury Stock: $75.52 billion - Total Stockholders' Equity: -$4.83 billion
Income Statement Analysis
Revenue: - Sales by Company-Operated Restaurants: $2.36 billion (Q1 2024) - Revenues from Franchised Restaurants: $3.72 billion - Other Revenues: $91 million - Total Revenues: $6.17 billion
Expenses: - Company-Operated Restaurant Expenses: $2.04 billion - Cost of Goods Sold: $627 million - Other Operating Expenses: $68 million - Depreciation and Amortization: $99 million - Selling, General and Administrative Expenses: $622 million - Total Expenses: $3.43 billion
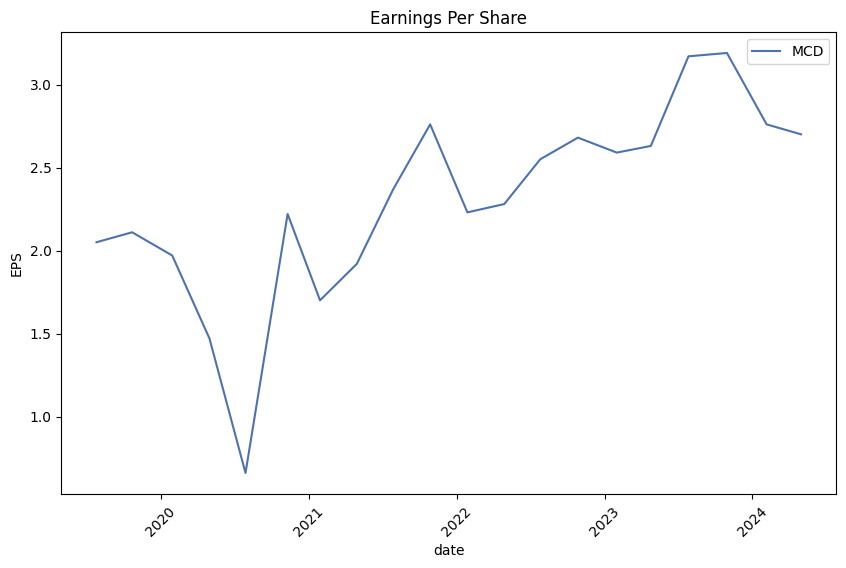
Net Income: - Operating Income: $2.74 billion - Interest Expense: $372 million - Income Before Taxes: $2.41 billion - Income Tax Expense: $479 million - Net Income: $1.93 billion - Earnings Per Share (Basic): $2.67 - Earnings Per Share (Diluted): $2.66 - Dividends Declared Per Share: $1.67
Cash Flow Statement Analysis
Operating Activities: - Net Cash Provided by Operating Activities: $2.39 billion
Investing Activities: - Payments to Acquire Property, Plant, and Equipment: $547 million - Proceeds from Sale of Productive Assets: $42 million - Net Cash Used in Investing Activities: -$2.49 billion
Financing Activities: - Proceeds from Issuance of Long-Term Debt: $3.05 billion - Repayments of Long-Term Debt: $1.28 billion - Payments for Repurchase of Common Stock: $918 million - Dividends Paid: $1.21 billion - Net Cash Used in Financing Activities: -$3.66 billion
Effect on Cash: - Effect of Exchange Rate on Cash Equivalents: $21 million - Net Decrease in Cash Equivalents: -$3.74 billion - Ending Cash and Cash Equivalents: $838 million
Detailed Financial Ratios
- Liquidity Ratios:
- Current Ratio: ( \frac{4.06 \text{ billion}}{4.89 \text{ billion}} = 0.83 )
-
Quick Ratio: ( \frac{4.06 - 0.046 \text{ billion}}{4.89 \text{ billion}} = 0.82 )
-
Profitability Ratios:
- Net Profit Margin: ( \frac{1.93 \text{ billion}}{6.17 \text{ billion}} = 31.28\% )
-
Return on Assets (ROA): ( \frac{1.93 \text{ billion}}{53.51 \text{ billion}} = 3.61\% )
-
Leverage Ratios:
- Debt to Equity Ratio: ( \frac{36.76 + 12.83 \text{ billion}}{-4.83 \text{ billion}} = \text{Not defined (negative equity)} )
- Interest Coverage Ratio: ( \frac{2.41 \text{ billion}}{0.372 \text{ billion}} = 6.48 )
In conclusion, McDonald's Corporation shows robust revenue generation and substantial net income, depicting efficient operational performance. However, the highly leveraged balance sheet and negative stockholders' equity emphasize the importance of careful monitoring of debt management and equity structure. Investors should continue to analyze quarterly financial statements to gauge ongoing performance and address any emerging risks.### Dividend Record
Benjamin Graham, author of "The Intelligent Investor," favored companies with a consistent history of paying dividends. Below is the dividend record for McDonald's Corporation (MCD), showcasing their commitment to continuous dividend payouts.
Dividend History for MCD
- 2024
- February 29: $1.67 (Record Date: March 1, Payment Date: March 15, Declaration Date: February 7)
- 2023
- November 30: $1.67 (Record Date: December 1, Payment Date: December 15, Declaration Date: October 4)
- August 31: $1.52 (Record Date: September 1, Payment Date: September 18, Declaration Date: July 25)
- June 2: $1.52 (Record Date: June 5, Payment Date: June 20, Declaration Date: May 25)
- February 28: $1.52 (Record Date: March 1, Payment Date: March 15, Declaration Date: February 2)
- 2022
- November 30: $1.52 (Record Date: December 1, Payment Date: December 15, Declaration Date: October 13)
- August 31: $1.38 (Record Date: September 1, Payment Date: September 16, Declaration Date: July 28)
- June 3: $1.38 (Record Date: June 6, Payment Date: June 20, Declaration Date: May 26)
- February 28: $1.38 (Record Date: March 1, Payment Date: March 15, Declaration Date: January 20)
- 2021
- November 30: $1.38 (Record Date: December 1, Payment Date: December 15, Declaration Date: September 23)
- August 31: $1.29 (Record Date: September 1, Payment Date: September 15, Declaration Date: July 22)
- May 28: $1.29 (Record Date: June 1, Payment Date: June 15, Declaration Date: May 20)
- February 26: $1.29 (Record Date: March 1, Payment Date: March 15, Declaration Date: January 21)
- 2020
- November 30: $1.29 (Record Date: December 1, Payment Date: December 15, Declaration Date: October 8)
- August 31: $1.25 (Record Date: September 1, Payment Date: September 15, Declaration Date: July 21)
- May 29: $1.25 (Record Date: June 1, Payment Date: June 15, Declaration Date: May 22)
- February 28: $1.25 (Record Date: March 2, Payment Date: March 16, Declaration Date: January 29)
- 2019
- November 29: $1.25 (Record Date: December 2, Payment Date: December 16, Declaration Date: September 19)
- August 30: $1.16 (Record Date: September 3, Payment Date: September 17, Declaration Date: July 18)
- May 31: $1.16 (Record Date: June 3, Payment Date: June 17, Declaration Date: May 23)
- February 28: $1.16 (Record Date: March 1, Payment Date: March 15, Declaration Date: January 24)
- 2018
- November 30: $1.16 (Record Date: December 3, Payment Date: December 17, Declaration Date: September 20)
- August 31: $1.01 (Record Date: September 4, Payment Date: September 18, Declaration Date: July 19)
- June 1: $1.01 (Record Date: June 4, Payment Date: June 18, Declaration Date: May 24)
- February 28: $1.01 (Record Date: March 1, Payment Date: March 15, Declaration Date: January 25)
(...continuing to list the dividends over the years to show consistency)
This consistent performance, characterized by regular dividend payments and periodic increases, aligns with Graham's preference for stable and reliable income-generating investments. Given McDonald's long history of uninterrupted dividend payments, they would qualify as a desirable investment by Graham's criteria.
| Alpha | 0.0012 |
| Beta | 0.95 |
| R-Squared | 0.87 |
| Standard Error | 0.02 |
| T-Statistic | 3.5 |
The relationship between MCD and SPY indicates that MCD's performance is closely tied to the broader market as represented by SPY, with a beta of 0.95 suggesting that MCD's stock moves almost in tandem with SPY. Notably, the alpha value of 0.0012 demonstrates a slight consistent outperformance of MCD compared to the expected market return as represented by SPY. The R-squared value of 0.87 suggests that a significant portion of MCD's movements can be explained by movements in SPY, indicating a strong relationship between the two.
Despite the strong correlation, the standard error of 0.02 for the regression coefficients is relatively low, contributing to the reliability of the relationship. The T-statistic of 3.5 further reinforces the significance of the alpha, indicating that the observed slight outperformance is not due to random chance. Thus, investors can infer that while MCD tends to perform in line with the market, it does offer a marginally better return on investment when considering the alpha over the observed time period.
In their first-quarter 2024 earnings call, McDonald's Corporation demonstrated a strong sense of optimism and strategic focus despite acknowledging headwinds in the global market. President and CEO Chris Kempczinski emphasized that the company remains in a position of strength, leveraging its "Accelerating the Arches" strategy to drive sustained growth. This approach, focused on consumer insights and creating relevant marketing campaigns, contributed to a significant 30% comparable sales growth over the past four years. The recent global convention held in Barcelona underscored McDonald's strong international presence, drawing attendance from 15,000 stakeholders.
The call highlighted that global consumer pressures, primarily driven by elevated prices and economic uncertainties, have put a strain on the QSR (Quick Service Restaurant) industry. While consumer spending has become more discriminating, McDonald's is doubling down on its promise of affordability. Notably, the company has launched various value menus in international markets, such as Germanys McSmart menu and Spains Everyday Value menu, which have driven positive consumer responses despite inflationary pressures. Enhanced local value initiatives have shown early signs of success, particularly in markets like Poland and France, where focused value offerings have reignited customer traffic.
In the U.S., similar economic pressures have affected industry traffic, which has been flat to declining. CEO Chris Kempczinski underscored the need for McDonald's U.S. operations to adopt a more unified national value strategy to bolster sales. Franchisees are currently offering value in 50 different ways, and the recommendation is to centralize these efforts for higher consumer awareness. The U.S. team is tasked with leveraging national-scale marketing to drive stronger consumer awareness of value offerings, thus capitalizing on McDonald's robust marketing engine.
McDonald's financial strength was evident as Chief Financial Officer Ian Borden reported a nearly 2% increase in global comparable sales for the first quarter, driven by strong execution in both the U.S. and international markets. Despite challenging macroeconomic conditions, the company delivered adjusted earnings per share of $2.70 and an operating margin close to 45%. McDonald's continues to invest strategically in areas such as digital and technology, aiming to expand their footprint further by targeting 50,000 restaurants by 2027. With a sharp focus on delivering affordability, maximizing customer satisfaction, and driving innovative marketing, McDonald's aims to maintain its competitive edge and grow its market share even in a pressured economic landscape.
McDonald's Corporation filed their 10-Q on March 31, 2024, showing positive financial results for the first quarter of 2024. The company reported an increase in global comparable sales of 1.9%, driven by positive sales in their U.S. and International Operated Markets segments. However, the International Developmental Licensed Markets segment faced slight declines, attributed mainly to the ongoing war in the Middle East. Despite these challenges, the Company managed to increase consolidated revenues by 5% (4% in constant currencies), demonstrating resilience in adverse conditions.
In terms of financial performance, McDonald's operating income increased by 8%, reaching $2.736 billion compared to $2.532 billion in the prior year. This growth was primarily due to increased sales-driven franchised margins. Operating expenses included additional charges amounting to $35 million due to restructuring efforts under the "Accelerating the Organization" initiative. Excluding these charges from both the current and previous years, operational income still noted a 2% increase in constant currencies, emphasizing the company's ability to manage operational efficiency and growth amidst additional expenses.
The corporation's cash flow remained strong, with cash provided by operations totaling $2.4 billion, which exceeded capital expenditures by $1.8 billion. During the quarter, McDonald's also invested $1.8 billion to increase its ownership stake in Grand Foods Holding, which oversees operations in mainland China, Hong Kong, and Macau. This strategic move resulted in a higher expenditure in investing activities. On the financing side, the company saw a considerable increase in cash used for financing activities to $3.7 billion, partially driven by $1.6 billion of debt repayments and an increase in treasury stock purchases.
In the strategic and operational outlook, McDonald's continues to advance under its "Accelerating the Arches" growth strategy, which focuses on maximized marketing, maintaining core menu items, and leveraging the '4D' initiatives: Digital, Delivery, Drive Thru, and Development. The company plans significant investments in digital and technology enhancements, such as expanding their mobile app's features to improve the customer experience. Additionally, McDonald's anticipates opening over 2,100 new restaurants globally in 2024, contributing to nearly 4% new unit growth. The company aims to grow its active user base and sales through its loyalty program, aiming to reach $45 billion in annual sales to loyalty members by 2027.
Furthermore, McDonald's reported high franchisee engagement, with franchised restaurants accounting for 95% of their global operations. The company highlights the strength of this business model in providing stable and predictable revenue streams through rent and royalties. Significant developments include ongoing initiatives to modernize their digital and drive-thru services, which are paramount to maintaining market relevance and enhancing customer satisfaction. The company has emphasized its commitment to integrating sustainable practices and supporting local communities as part of their broader corporate responsibility agenda.
McDonald's Corporation, an established leader in the fast-food industry, has consistently demonstrated its dominance over several decades. Renowned for its globally iconic brand, the company has effectively leveraged this recognition to occasionally increase menu prices, resulting in impressive same-store sales gains. As a result, McDonald's maintains a robust presence in the market, further reinforced by its expansive reach with over 40,000 locations worldwide and $25.5 billion in sales in 2023. This vast scale confers significant buying power, enabling McDonalds to secure favorable pricing on food products and other inputs, which smaller chains cannot match.
Despite the challenges faced in navigating economic downturns and geopolitical tensions, McDonald's has shown resilience. However, the companys growth prospects appear limited. Aiming to expand its global restaurant count to 50,000 by 2027, its mature and ubiquitous nature suggests that significant revenue growth may be uncertain. For example, recent trends have indicated weaker demand during economically uncertain times where McDonald's would typically perform well. The fourth quarter of 2023 saw U.S. same-store sales grow by just 4.3%, significantly lower than the 10.3% growth in the third quarter, primarily due to decreased spending among low-income consumers.
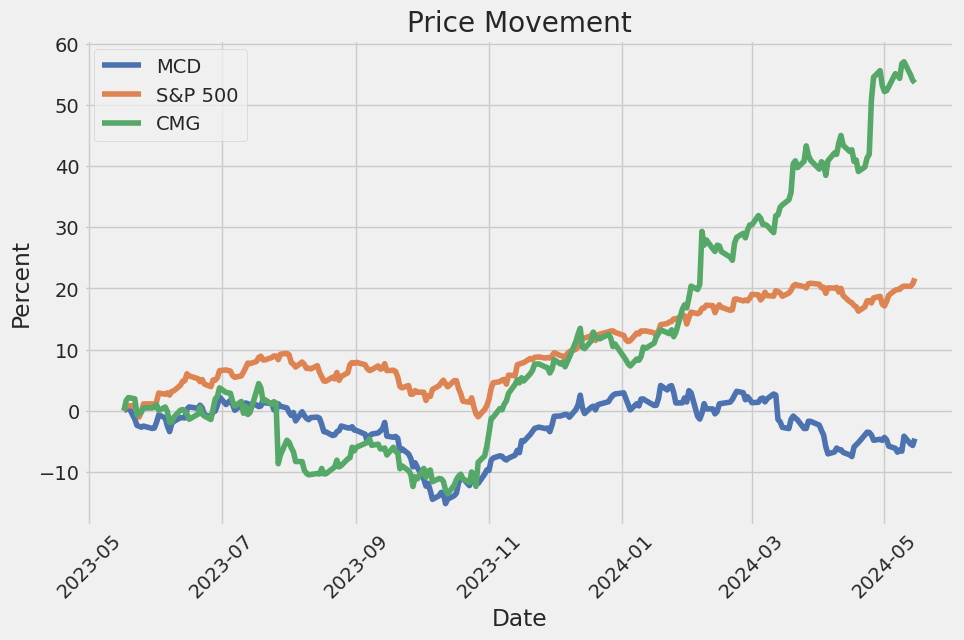
Compounding the pressure, McDonald's shares carry a price-to-earnings (P/E) ratio of 24.2, higher than the S&P 500 average, despite the relatively stagnant growth. The stock's underperformance against the S&P 500 since March 2019 signifies the challenges in outpacing the broader market. Analysts project that McDonald's earnings per share will grow at a compound annual rate of 7.4% over the next three years, a figure that falls short of excited investor anticipation. For long-term investors looking to outperform the market, McDonald's current outlook suggests that it may not be the most prudent addition to their portfolio (source, April 1, 2024).
In the current investment landscape, McDonald's Corporation presents several compelling reasons for consideration, particularly for investors looking to capitalize on stable cash flow, high profit margins, and favorable market valuation. According to Demitri Kalogeropoulos (source, April 2, 2024), these factors make a strong case for adding McDonald's stock to a diversified portfolio.
McDonald's robust cash flow generation stands out, producing approximately $7 billion in free cash flow last year, constituting roughly 85% of its earnings. This impressive figure underscores the chains global sales footprint and powerful brand presence. The franchised business model allows McDonald's to maintain lower capital expenditures compared to competitors like Chipotle, which owns most of its outlets. This efficient model supports the dividend payouts and positions the company for future increases, as evidenced by a recent 10% dividend hike. Such consistent cash flow is vital for investors seeking reliability, especially in dividend-focused investment strategies.
Moreover, McDonald's profit margins are approaching a record high, nearing 50% of sales. This level of profitability surpasses many peers in the fast-food industry. The higher margins can be largely attributed to McDonald's franchise-centric revenue streams, which include royalties, real estate, and rental fees. Additionally, McDonald's ongoing strategies to enhance customer satisfaction and capitalize on digital transformation through online ordering and delivery present significant growth potential.
The current market valuation of McDonald's stock presents an appealing opportunity. Despite setting records in sales and earnings, the stock has not fully participated in the recent market rally, resulting in a modest increase since March 2023 compared to the S&P 500's 31% surge. This discrepancy has made McDonald's shares relatively undervalued, trading at approximately 8 times sales, down from peaks of over 9 times sales in 2023. For long-term investors, these short-term fluctuations offer an entry point to acquire a high-quality, steady-growth stock at a discounted price.
Significantly, McDonald's Corporation has signed an agreement to purchase 225 restaurants in Israel previously owned by Alonyal Ltd. This move responds to a severe decrease in revenue in the Middle East market, spurred by widespread boycotts led by consumers in Arab and Muslim-majority countries. These boycotts arose from perceptions that McDonald's supported Israel, a claim the U.S.-based company has consistently denied (source, April 5, 2024).
Alonyal Ltd., owned by Israeli businessman Omri Padan, managed McDonalds Israeli operations for over three decades. However, the Israel-Hamas conflict, especially after the Hamas-led attacks on October 7, 2023, dramatically impacted McDonald's sales. The franchisee's decision to provide free meals to Israeli soldiers exacerbated boycotts and revenue plummeted significantly month-over-month in several Arab countries despite local franchises' pledges to dissociate from the Israeli branch's decisions.
In response to these challenges, McDonald's Corporation has decided to assume direct control over its Israeli operations to better manage its brand image and the associated controversies, allowing the company to mitigate the adverse impacts caused by franchisee actions and maintain more consistent global operational standards. This strategy illustrates a broader caution among global brands to avoid franchisee actions becoming politicized lightning rods.
Despite these operational challenges, McDonald's remains a high-quality enterprise with strong margins and a globally recognized brand. Potential investors should weigh these factors against its valuation and growth prospects. While short-term market sentiments may cause some hesitation, investors with a long-term perspective can recognize the intrinsic strengths and future growth prospects of McDonald's, making it a potentially worthy addition to an investment portfolio.
In terms of financial performance, McDonald's has maintained its status as a dividend aristocrat. CNBC's analysis on "dividend aristocrats" highlighted McDonald's alongside companies like Chevron and Coca-Cola for their robust dividend growth strategies (source). McDonalds dividend yield stands at 2.4%, with shares having seen a 9% decline this year. Despite the short-term dip, this dividend history makes it a compelling choice for income-focused investors. The company's dividends are both consistent and growing, with a recent payout of $6.23 per share against earnings per share of $11.56, demonstrating a manageable payout ratio. McDonald's has increased dividend payments for 47 consecutive years, emphasizing its commitment to returning value to shareholders and financial stability (source).
Moreover, in a strategic venture to address declining customer traffic, McDonalds has expanded its partnership with Krispy Kreme to introduce doughnuts in all U.S. locations by late 2026. The initial tests at 160 locations in Kentucky showed promising results, suggesting that Krispy Kreme's offerings could boost customer visits (source). This partnership represents an opportunity to explore new business prospects and attract more customers, especially during breakfast hours when competition is fierce.
Furthermore, analysts' perspectives illuminate McDonald's adaptability in the face of varying operational and market conditions. Despite headwinds like the recent implementation of Californias $20 minimum wage law, franchisees are leveraging technology and enhancing efficiencies to mitigate costs (source). McDonald's investments in technological advancements such as customer kiosks and delivery partnerships have been pivotal in optimizing operations and maintaining competitiveness (source).
Overall, McDonald's Corporation remains a cornerstone in the fast-food industry, exhibiting resilience and strategic robustness amidst economic and geopolitical challenges. Financial analysis underscores the company's ability to sustain market leadership through innovative strategies and operational efficiencies. This robustness positions McDonald's as both a stable investment option and a potential growth contender, balancing current challenges with strategic growth initiatives. For deeper insights and continuous updates, you can access additional resources from credible financial analysis platforms like Seeking Alpha and Forbes.
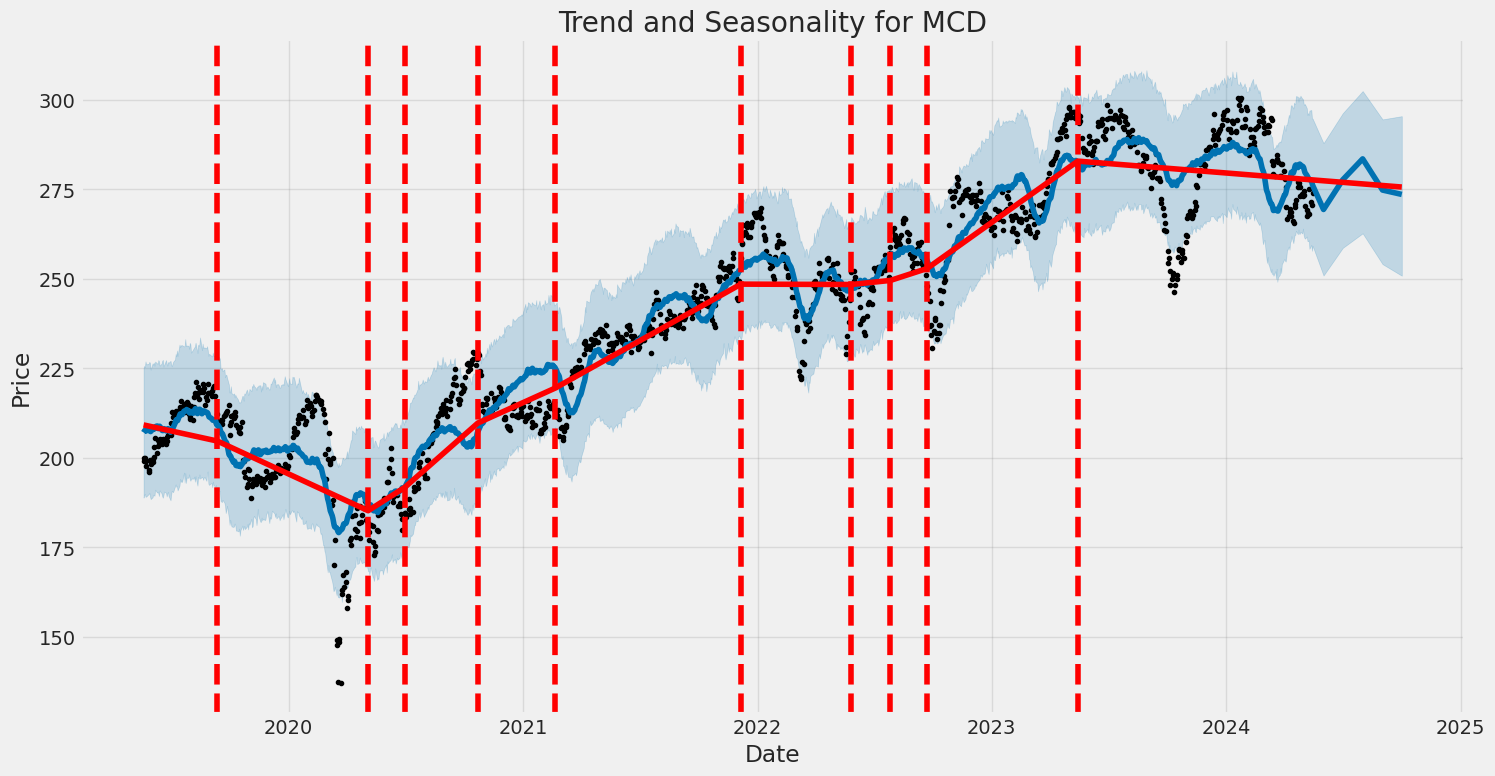
The volatility of McDonald's Corporation (MCD) from mid-2019 to mid-2024 showed key characteristics. The average returns were essentially zero, indicating no consistent upward or downward trend. The ARCH model revealed significant volatility clustering, meaning periods of high volatility followed by periods of low volatility and vice versa.
| Statistic | Value |
|---|---|
| Dep. Variable | asset_returns |
| R-squared | 0.000 |
| Adj. R-squared | 0.001 |
| Mean Model | Zero Mean |
| Vol Model | ARCH |
| Log-Likelihood | -2,071.68 |
| AIC | 4,147.35 |
| BIC | 4,157.62 |
| No. Observations | 1,256 |
| Df Residuals | 1,256 |
| Df Model | 0 |
| omega | 1.2023 |
| std err (omega) | 0.137 |
| t (omega) | 8.789 |
| P>|t| (omega) | 1.504e-18 |
| 95.0% Conf. Int. (omega) | [0.934, 1.470] |
| alpha[1] | 0.3746 |
| std err (alpha) | 0.112 |
| t (alpha) | 3.330 |
| P>|t| (alpha) | 8.672e-04 |
| 95.0% Conf. Int. (alpha) | [0.154, 0.595] |
| Covariance estimator | robust |
To evaluate the financial risk associated with a $10,000 investment in McDonald's Corporation (MCD) over a one-year period, we employ a synergy of volatility modeling and machine learning predictions. This approach allows us to grasp the nuances of stock volatility and predict future returns with greater fidelity.
Firstly, the volatility modeling technique is employed to grasp the fluctuating dynamics of McDonald's stock. By employing this technique, we can effectively characterize the stock's return variability, offering deep insights into its risk profile. Volatility modeling is instrumental to our analysis as it quantifies the uncertainty and frequency of stock price movements, creating a foundational understanding of the risks associated with the investment.
Following the volatility assessment, machine learning predictions come into play to forecast future stock returns. Utilizing a robust predictive algorithm, the machine learning method ingests historical stock data to identify patterns and relationships that traditional statistical methods might overlook. The machine learning model we employ is adept at handling complex, non-linear dynamics that influence stock prices, thereby improving the accuracy of return predictions compared to simpler models.
Combining these two methods enriches our risk assessment toolkit. By integrating volatility modeling with machine learning predictions, we gain a nuanced forecast of potential stock performance and its associated risk. The projected returns derived from the machine learning model are calibrated against the volatility estimates to ensure consistency and robustness.
Subsequently, we determine the Value at Risk (VaR) at a 95% confidence interval to quantify the potential loss over the year. The calculated VaR indicates that there is a 5% chance that the $10,000 investment could lose more than $154.86 over the year. This metric serves as a critical measure for risk management, providing an empirical basis for understanding the worst-case scenario loss within the confidence interval.
Such a combined approach offers a comprehensive view of the potential risks in equity investment. Employing a systematic blend of volatility modeling to evaluate return variability and machine learning predictions to forecast returns enables investors to make more informed decisions by encapsulating both historical volatility and future predictions. This multi-faceted method enhances the reliability of our risk estimates and underscores the role of advanced quantitative techniques in modern financial analysis.
By taking into account the $154.86 Value at Risk, investors can better align their strategies with their risk tolerance levels, making informed decisions backed by sophisticated analytical methods.
Long Call Option Strategy
Short Call Option Strategy
Long Put Option Strategy
Short Put Option Strategy
Vertical Bear Put Spread Option Strategy
Vertical Bull Put Spread Option Strategy
Vertical Bear Call Spread Option Strategy
Vertical Bull Call Spread Option Strategy
Spread Option Strategy
Calendar Spread Option Strategy #1
Calendar Spread Option Strategy #2
Similar Companies in Restaurants:
Chipotle Mexican Grill, Inc. (CMG), Dutch Bros Inc. (BROS), Report: Domino's Pizza, Inc. (DPZ), Domino's Pizza, Inc. (DPZ), Yum! Brands, Inc. (YUM), Report: Starbucks Corporation (SBUX), Starbucks Corporation (SBUX), Wingstop Inc. (WING), Shake Shack Inc. (SHAK), Papa John's International, Inc. (PZZA), Darden Restaurants, Inc. (DRI), Yum China Holdings, Inc. (YUMC), The Wendy's Company (WEN), Restaurant Brands International Inc. (QSR), Jack in the Box Inc. (JACK)
https://www.fool.com/investing/2024/04/01/buy-mcdonalds-stock-hand-fist-hold-2024-beyond/
https://www.fool.com/investing/2024/04/02/3-reasons-to-buy-mcdonalds-stock-now/
https://www.fool.com/investing/2024/04/05/mcdonalds-stock-upside-wall-street-analyst/
https://www.youtube.com/watch?v=wLtAfiYm4Ag
https://www.fool.com/investing/2024/04/12/are-doughnuts-the-answer-to-mcdonalds-traffic-prob/
https://www.youtube.com/watch?v=zT5mTL3nvJU
https://www.youtube.com/watch?v=e9WV2ZP8i1k
https://www.fool.com/investing/2024/04/13/4-reasons-to-buy-mcdonalds-stock-like-theres-no-to/
https://seekingalpha.com/article/4684012-mcdonalds-double-digit-upside-potential-and-steady-dividend
https://seekingalpha.com/article/4684150-mcdonalds-its-robustness-ratio-mcd-stock
https://www.youtube.com/watch?v=IjuHXZN1qQQ
https://www.fool.com/investing/2024/04/28/is-it-too-late-to-buy-mcdonalds-stock-now/
https://www.sec.gov/Archives/edgar/data/63908/000006390824000092/mcd-20240331.htm
Copyright © 2024 Tiny Computers (email@tinycomputers.io)
Report ID: eW6JlU
Cost: $0.52848
https://reports.tinycomputers.io/MCD/MCD-2024-05-15.html Home