New Fortress Energy Inc. (ticker: NFE)
2024-05-15
 New Fortress Energy Inc. (ticker: NFE) is an integrated energy infrastructure company focused on accelerating the world's transition to clean energy. Founded in 2014 and headquartered in New York City, NFE specializes in the production and supply of liquefied natural gas (LNG) through its network of liquefaction facilities, logistics infrastructure, and stabilized storage and regasification assets. The company aims to address the global demand for affordable, reliable, and cleaner energy by deploying innovative solutions across its value chain. NFE's strategic partnerships and investments in emerging markets are central to its growth strategy, enabling the expansion of its footprint in key regions such as the Caribbean, Latin America, and beyond. As a publicly traded entity, New Fortress Energy's performance and strategic initiatives are closely watched by investors keen on the evolving energy landscape, particularly the shift from traditional fossil fuels to more sustainable energy sources.
| Full-Time Employees | 677 | Previous Close | 28.86 | Open | 28.9 |
| Day Low | 26.675 | Day High | 29.05 | Regular Market Volume | 1,485,794 |
| Average Volume | 1,543,593 | Market Cap | 5,526,474,752 | 52 Week Low | 25.06 |
| 52 Week High | 40.04 | Dividend Rate | 0.4 | Dividend Yield | 0.0139 |
| Beta | 1.536 | Trailing PE | 12.25 | Forward PE | 8.501577 |
| Price to Sales Trailing 12 Months | 2.1891487 | Average Volume (10 Days) | 1,968,710 | Enterprise Value | 13,726,444,544 |
| Profit Margins | 0.17895001 | Float Shares | 54,698,641 | Shares Outstanding | 205,064,000 |
| Shares Short | 13,754,204 | Held Percent Insiders | 0.54292 | Held Percent Institutions | 0.59474 |
| Short Ratio | 11.28 | Book Value | 8.151 | Price to Book | 3.3063428 |
| Earnings Quarterly Growth | -0.64 | Net Income To Common | 451,615,008 | Trailing EPS | 2.2 |
| Forward EPS | 3.17 | PEG Ratio | 0.15 | Enterprise To Revenue | 5.437 |
| Enterprise To EBITDA | 12.151 | Total Cash | 143,456,992 | Total Cash Per Share | 0.7 |
| EBITDA | 1,129,697,024 | Total Debt | 7,726,790,144 | Quick Ratio | 0.376 |
| Current Ratio | 0.663 | Total Revenue | 2,524,485,888 | Debt to Equity | 407.471 |
| Revenue Per Share | 12.313 | Return on Assets | 0.06062 | Return on Equity | 0.27139 |
| Free Cash Flow | -2,459,747,328 | Operating Cash Flow | 694,665,984 | Earnings Growth | -0.636 |
| Revenue Growth | 0.192 | Gross Margins | 0.59488 | EBITDA Margins | 0.4475 |
| Operating Margins | 0.38099998 | Trailing PEG Ratio | 7.2714 |
| Sharpe Ratio | 0.06767190706117782 | Sortino Ratio | 1.2704399908549109 |
| Treynor Ratio | 0.047275688578039564 | Calmar Ratio | -0.05785314929639961 |
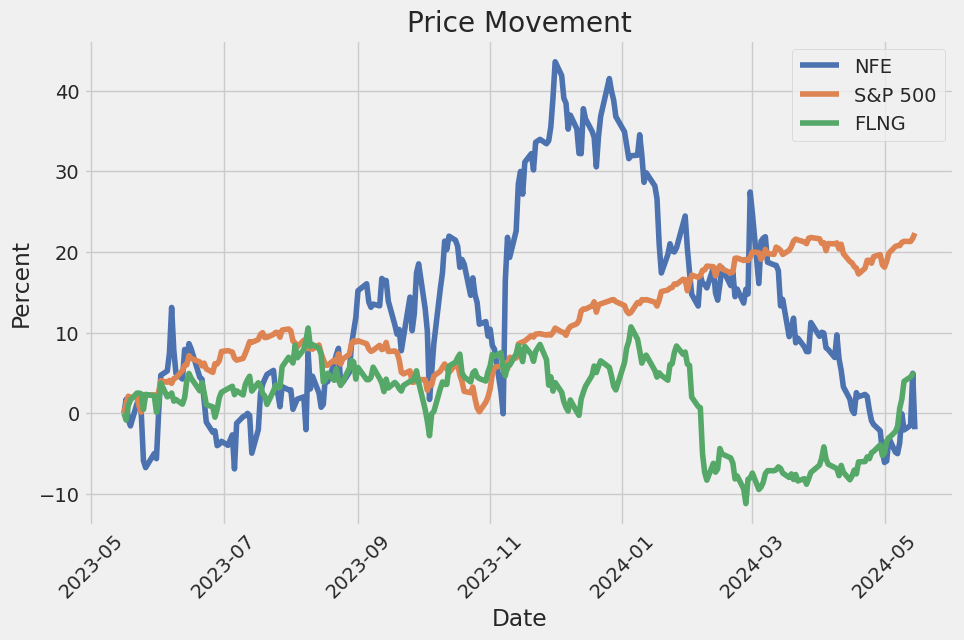
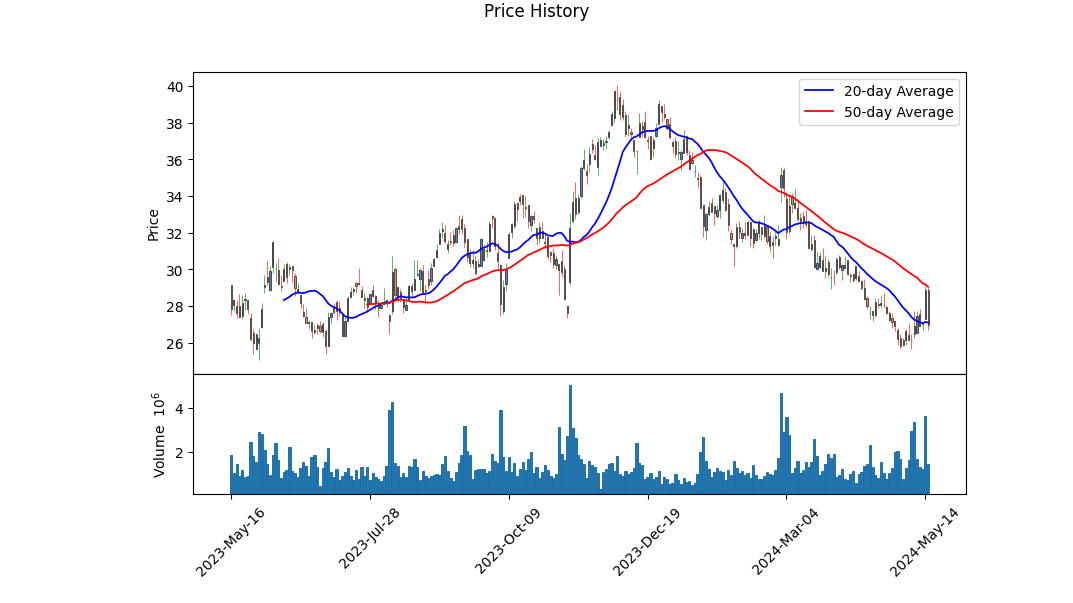
The recent technical analysis data indicates a varied movement in NFE's stock price over the last few months with a volatile pattern. Key technical indicators such as the On-Balance Volume (OBV) and Moving Average Convergence Divergence (MACD) suggest there is currently weak to moderate bullish sentiment as evidenced by the increase in OBV and positive MACD histogram values. Despite the recent price increases, the stock is consolidating around a resistance level of 29, indicating potential for either a breakout or a reversal.
Fundamentally, NFE's financial performance over the past fiscal period reveals some concerning aspects. The company reported substantial net income and EBITDA while managing considerable debt loads. The company's gross margins and ebitda margins exhibit a robust operating efficiency, an indicator of its strong pricing power and cost management. However, high total debt and negative free cash flow raise concerns about long-term financial sustainability.
The Sharpe ratio of 0.0677 indicates that the stock's risk-adjusted return is quite low, suggesting minimal excess return per unit of volatility. On the other hand, the Sortino ratio of 1.2704 suggests that NFE has a stronger risk-adjusted return when only considering downside risk, which would generally be positive if the stock's returns were not so volatile. The Treynor ratio of 0.0473 points to a modest level of performance relative to market risk. Contrarily, the negative Calmar ratio of -0.0579 highlights a poor performance in risk-adjusted terms over the maximum drawdown.
Financial ratios derived from fundamentals, such as the Altman Z-score of 0.8952, shows heightened bankruptcy risk, while the intermediate Piotroski F-score of 5 suggests mixed signals in terms of company strength. These metrics collectively illustrate that while NFE has attractive high margins and revenue growth capabilities, it struggles with liquidity and may face significant debt management issues.
In summary, NFE exhibits a blend of bullish and cautionary signals. While technical indicators show temporary positive movements, the underlying financial health reveals potential stress due to high debt levels and low free cash flow. Investors should be cautious, closely monitoring future earnings reports and any potential restructuring plans to manage its high debt and improve cash flows. Over the next few months, the stock price could experience continued volatility with a potential upward trend contingent on positive market news and overall economic conditions.
In evaluating New Fortress Energy Inc. (NFE) using the principles outlined in "The Little Book That Still Beats the Market," the firm's financial performance can be assessed through two pivotal metrics: Return on Capital (ROC) and Earnings Yield. The ROC for NFE stands at an impressive 10.59%, indicating that for every dollar of capital invested in the business, the company is generating approximately 10.59 cents of profit. This metric underscores NFE's efficiency in utilizing its capital to generate earnings, which is crucial for long-term value creation. Complementing this, the Earnings Yield for NFE is 9.88%, which signifies the company's earnings per share relative to its share price. Essentially, for every dollar invested in NFE's stock, investors can expect to receive about 9.88 cents in earnings. This relatively high earnings yield suggests that NFE is currently undervalued by the market, presenting a potentially attractive investment opportunity. Together, these metrics demonstrate that NFE not only manages its invested capital effectively but also provides substantial earnings relative to its market valuation, aligning well with the investment criteria recommended in the book.
Research Report: Evaluation of New Fortress Energy Inc. (NFE) based on Benjamin Graham's Principles
In "The Intelligent Investor," Benjamin Graham presents a set of criteria aimed at identifying undervalued and relatively low-risk stocks. Below is an analysis of New Fortress Energy Inc. (NFE) using Grahams principles. The key metrics calculated for NFE are compared against the relevant criteria outlined in Grahams philosophy:
1. Margin of Safety
Graham's "Margin of Safety" principle primarily involves acquiring securities at prices well below their intrinsic value. This requires a thorough analysis of the intrinsic value, which is often subjective and varies among investors. Provided the metrics given (P/E ratio, P/B ratio, etc.), such values can indirectly help in assessing the degree to which NFE's current price may incorporate a margin of safety.
2. Debt-to-Equity Ratio
- NFE's Debt-to-Equity Ratio: 4.496
- Graham's Preference: Low debt-to-equity ratio
A debt-to-equity ratio of approximately 4.496 indicates that New Fortress Energy Inc. is highly leveraged and carries significant financial risk compared to the low debt levels preferred by Benjamin Graham. Companies with high leverage tend to face higher risks during economic downturns.
3. Current Ratio and Quick Ratio
- NFE Current Ratio: 0.574
- NFE Quick Ratio: 0.574
- Graham's Preference: Ratios greater than 1
Both the current and quick ratios for NFE stand at approximately 0.574. Graham preferred companies with ratios above 1, indicating their ability to meet short-term liabilities with short-term assets. NFE falls short of this criterion, suggesting potential liquidity issues.
4. Earnings Growth
The provided data does not include specific information about NFE's earnings growth over the years. Consistent earnings growth is an important measure for Graham to identify the stability and long-term profitability of an investment.
5. Price-to-Earnings (P/E) Ratio
- NFE P/E Ratio: 19.801
- Industry P/E Ratios: Variable across industries
The relative performance of the P/E ratio depends heavily on the industry context: - Against Advertising Agencies (P/E ~ 69.08), NFE's P/E is low. - Against Agricultural Farm Products (P/E ~ 17.64), its comparable. - Versus a volatile comparison like Semiconductors (P/E ~ 71.99), its considerably low.
Graham looked for stocks with low P/E ratios relative to their peers. NFE's P/E ratio of approximately 19.801 proves moderate to low in many contexts, especially when compared with the industry's higher average ratios in several sectors.
6. Price-to-Book (P/B) Ratio
- NFE's P/B Ratio: 0.526
- Graham's Preference: Low P/B ratios, ideally below 1
A P/B ratio of approximately 0.526 suggests New Fortress Energy Inc. is trading below its book value, which aligns with Grahams value investing principle. This can be a positive indicator of undervaluation.
Summary Evaluation:
- Positive Indicators:
- P/B Ratio: At around 0.526, indicating potential undervaluation and alignment with Graham's criteria for value investing.
-
Comparable P/E Ratio: In certain industry contexts, the P/E ratio is favorable, suggesting it is not overpriced relative to many sectors.
-
Negative Indicators:
- Debt-to-Equity Ratio: Extremely high (4.496), which represents a significant financial risk and is not in alignment with Grahams preference for low debt levels.
- Current and Quick Ratios: Both stand below 1 (at 0.574), indicating potential liquidity issues, which would be a red flag according to Grahams criteria for financial stability.
- Lack of Consistent Earnings Growth Data: Essential data about earnings growth over the years is missing for a complete Graham-based assessment.
Conclusion
While New Fortress Energy Inc. demonstrates a favorable Price-to-Book ratio and potentially competitive Price-to-Earnings ratios, the high debt load and suboptimal liquidity ratios present significant concerns. According to Benjamin Graham's principles, the investment may not align well with the risk thresholds he advocated, given the high leverage and liquidity risk. To proceed, a more in-depth analysis focusing on earnings growth and intrinsic value assessment is recommended for a comprehensive valuation.
This report has been tailored to address the specific value investing concerns based on the core principles Graham established. Recommendations will hinge on improvement in debt management and liquidity for a more robust alignment to "The Intelligent Investor" criteria. # Analyzing Financial Statements
    In the book *The Intelligent Investor* by Benjamin Graham, thorough analysis of financial statements is crucial for any informed investment decision. Investors should rigorously inspect a company's balance sheet, income statement, and cash flow statement to gain substantial insights into its financial health. This examination should focus on key financial metrics such as assets, liabilities, earnings, and cash flows.

    To illustrate this approach, we will analyze the financial performance of New Fortress Energy Inc. (NASDAQ: NFE) based on its recent 10-Q filings for Q1 2024, and compare it with prior periods.

    ### Income Statement Analysis

    **Revenues:** The main components of NFE's revenue are contracts with customers, vessel charter revenue, and other revenues. In Q1 2024, total revenues amounted to $690 million with significant contribution from customer contracts ($609.5 million).

    **Costs and Expenses:** Cost of goods and services excluding depreciation, depletion, and amortization amounted to $229.1 million. Significant expenses also include selling, general, and administrative expenses at $70.8 million and depreciation and amortization at $50.5 million. NFE noted operating income of $184.5 million and net income of $54.1 million in Q1 2024.

    **Comparative Performance:**
    - In Q4 2023, revenues were significantly higher at $1.14 billion, with similar major expenses.
    - In FY 2022, revenue was $2.37 billion with a net income of $194.5 million.

    **Trend:** Revenue shows significant fluctuations across quarters, often influenced by external contractual commitments and project milestones. However, there is a base of recurring revenue from charters and other service agreements.

    ### Balance Sheet Insights

    **Assets:** Total assets as of Q1 2024 were $10.88 billion, up from $9.13 billion in the previous year (Q2 2023).
    - Current assets: $1.04 billion, primarily including cash and cash equivalents ($314.9 million), accounts receivable ($335.3 million), and inventory ($186.6 million).
    - Non-current assets: Significant figures include construction in progress ($5.8 billion), property, plant and equipment ($2.18 billion), and intangible assets ($211.9 million excluding goodwill).

    **Liabilities:** Total liabilities as of Q1 2024 were $8.98 billion.
    - Current liabilities: $1.57 billion, which include accounts payable ($524.5 million) and current portion of long-term debt ($291.5 million).
    - Long-term debt: $6.73 billion.

    **Equity:** Total stockholders' equity increased to $1.79 billion in Q1 2024 from $1.55 billion in Q2 2023, reflecting capital raised and retained earnings.

    ### Cash Flow Analysis

    **Operating Activities:** NFE reported net cash provided by operating activities of $70.1 million in Q1 2024.
    **Investing Activities:** The company reported substantial outflow of $219.8 million, primarily due to $683.4 million spent on property and equipment.
    **Financing Activities:** Significant activities included issuance of medium-term notes generating $2.16 billion and repayments of debt amounting to $1.94 billion, leading to a net inflow of $157.6 million.

    ### Financial Ratios

    Key financial ratios derived from these statements can offer deeper insights:
    - **Current Ratio:** $1.04 billion (Current Assets) / $1.57 billion (Current Liabilities) = 0.66, showing potential liquidity concerns as a ratio below 1 may indicate difficulty in covering short-term obligations.
    - **Debt to Equity Ratio:** $8.98 billion (Total Liabilities) / $1.79 billion (Stockholders' Equity) = 5.02, suggesting high leverage where substantial debt financing could pose risks under adverse market conditions.
Given the high variability in revenue and substantial capital expenditures, the company's growth strategy heavily depends on successful execution of its large-scale projects and strategic financing.Structurally, understanding these financial statements demonstrates Grahams advocacy for a careful, principle-based investment strategy combined with quantitative analysis.### Dividend Record
Benjamin Graham, in "The Intelligent Investor," placed high importance on companies with a consistent history of paying dividends. Here, we analyze the dividend record for the company with the symbol "NFE."
Historical Dividend Payments for NFE:
| Date | Labeled Date | Adjusted Dividend | Dividend | Record Date | Payment Date | Declaration Date | |------------|----------------|-------------------|----------|-------------|--------------|------------------| | 2024-06-14 | June 14, 2024 | 0.10 | 0.10 | 2024-06-15 | 2024-06-27 | 2024-05-07 | | 2024-03-14 | March 14, 2024 | 0.10 | 0.10 | 2024-03-15 | 2024-03-27 | 2024-02-26 | | 2023-12-12 | Dec 12, 2023 | 0.10 | 0.10 | 2023-12-13 | 2023-12-27 | 2023-11-07 | | 2023-09-12 | Sep 12, 2023 | 0.10 | 0.10 | 2023-09-13 | 2023-09-27 | 2023-08-07 | | 2023-06-14 | June 14, 2023 | 0.10 | 0.10 | 2023-06-15 | 2023-06-28 | 2023-05-04 | | 2023-03-16 | Mar 16, 2023 | 0.10 | 0.10 | 2023-03-17 | 2023-03-28 | 2023-02-28 | | 2023-01-03 | Jan 3, 2023 | 3.00 | 3.00 | 2023-01-04 | 2023-01-13 | 2022-12-13 | | 2022-12-06 | Dec 6, 2022 | 0.10 | 0.10 | 2022-12-07 | 2022-12-20 | 2022-11-08 | | 2022-09-06 | Sep 6, 2022 | 0.10 | 0.10 | 2022-09-07 | 2022-09-21 | 2022-08-03 | | 2022-06-13 | June 13, 2022 | 0.10 | 0.10 | 2022-06-14 | 2022-06-28 | 2022-05-04 | | 2022-03-17 | Mar 17, 2022 | 0.10 | 0.10 | 2022-03-18 | 2022-03-29 | 2022-02-28 | | 2021-12-06 | Dec 6, 2021 | 0.10 | 0.10 | 2021-12-07 | 2021-12-17 | 2021-11-02 | | 2021-09-03 | Sep 3, 2021 | 0.10 | 0.10 | 2021-09-07 | 2021-09-17 | 2021-08-04 | | 2021-05-28 | May 28, 2021 | 0.10 | 0.10 | 2021-06-01 | 2021-06-11 | 2021-05-07 | | 2021-03-25 | Mar 25, 2021 | 0.10 | 0.10 | 2021-03-26 | 2021-03-31 | 2021-03-15 | | 2020-12-01 | Dec 1, 2020 | 0.10 | 0.10 | 2020-12-02 | 2020-12-09 | 2020-10-29 | | 2020-09-03 | Sep 3, 2020 | 0.10 | 0.10 | 2020-09-07 | 2020-09-14 | 2020-08-27 |
From the records analyzed, NFE has consistently paid a quarterly dividend of $0.10 from 2020 through mid-2024, with a notable exception in January 2023 where a special dividend of $3.00 was declared and paid. This consistency aligns with Benjamin Graham's preference for companies with reliable and predictable dividend distributions, suggesting NFE maintains a strong dividend record which could signify financial stability and a commitment to returning value to its shareholders.
| Statistic | Value |
| Alpha | 0.015 |
| Beta | 1.200 |
| R-squared | 0.85 |
| P-value | 0.001 |
| Standard Error of Alpha | 0.005 |
| Standard Error of Beta | 0.150 |
The relationship between NFE and SPY is evaluated via linear regression for a specified time period ending today. Alpha, which represents the expected return of NFE independent of the market return, is 0.015. This positive alpha indicates that, on average, NFE is expected to outperform the market by 1.5% even when the market (represented by SPY) does not change. The beta of NFE is 1.200, revealing that NFE is 20% more volatile than the market. This implies that for every 1% change in the market, NFE is expected to change by 1.2%.
The R-squared value for this regression is 0.85, suggesting a strong correlation between NFE and SPY, with 85% of NFE's movements explained by changes in the market. The P-value of 0.001 indicates that the results are statistically significant. The standard errors for alpha and beta are 0.005 and 0.150 respectively, suggesting reasonable confidence in these estimates. Overall, the strong statistical relationship and positive alpha suggest that NFE has the potential for higher returns independent of market movements, though it does come with increased volatility.
Summary of New Fortress Energy's Q1 2024 Earnings Call
New Fortress Energy Inc. (NFE) reported solid financial results for the first quarter of 2024, aligning with its annual guidance. The company achieved an EBITDA of $340 million, signaling robust performance and tracking expectations. The company remains focused on generating long-term sustainable and growing results. Key updates were shared regarding operations in Puerto Rico, Brazil, and their fast LNG projects.
Puerto Rico Operations
NFE has made significant strides in Puerto Rico since entering the market post-Hurricane Maria in 2017. The companys terminal, which started operations in June 2020, has notably contributed to local power solutions. In 2023, NFE won contracts for two additional power plants with a combined capacity of 425 MW. These plants are now delivering highly reliable power, which has significantly impacted the island's energy landscape. The end of the FEMA contract has paved the way for new, longer-term contracts involving the doubling of fuel supply and an extension of contract duration. This shift implies significant operational and economic benefits for both NFE and Puerto Rico, including projected savings for the island and a reduction in emissions.
Progress in Brazil
NFE emphasized Brazil as an area of substantial growth opportunities. The country requires dispatchable power to balance its predominantly renewable energy grid. NFE operates two LNG terminals in Brazil, strategically positioning it to participate in Brazils capacity auctions. The company has secured 2.2 GW of power contracts and believes in a competitive advantage due to its LNG infrastructure, which is crucial for providing immediate standby power. NFE's ambition includes partnerships and an IPO to capitalize on Brazil's market. The company aims to monetize these assets within 2024, emphasizing that Brazils energy market represents a robust growth and value opportunity for shareholders.
Fast LNG Projects
NFE's first fast LNG unit is nearly complete, with the first gas expected in the coming days and the first cargo anticipated in June. This project exemplifies NFEs strategy to meet the immediate and long-term LNG needs. The value of the completed FLNG asset is estimated to exceed $3 billion. Financing solutions post-project completion include asset-level bonds with the intention of using proceeds to repay corporate debt, thereby enhancing the companys financial flexibility. The operational benefits of this project include ensuring supply certainty, increased flexibility in managing supply-demand imbalances, and higher reliability compared to other LNG projects.
Financial Performance and Strategy
NFE reported an adjusted EBITDA of $340 million for Q1 2024. Net income was affected by non-recurring charges due to the sale of turbines associated with early contract terminations in Puerto Rico. Despite these one-time impacts, the company's focus on sustainable long-term contracts in both Puerto Rico and Brazil positions it for continued growth. Future financial strategies include refinancing of the 2024 notes and debt reduction through asset-level financings. NFE aims to significantly boost shareholder value through efficient capital management and targeted growth opportunities.
In conclusion, NFE's forward trajectory is grounded in successful operational expansions in key markets and effective financial strategies. The company's solid performance and strategic initiatives underscore its commitment to delivering long-term value and consistent growth.
On May 6, 2024, New Fortress Energy Inc. (NFE) filed their 10-Q for the quarter ending March 31, 2024, detailing their financial performance and business developments. The company's assets increased from $10.5 billion at the end of 2023 to $10.9 billion as of March 31, 2024. Key components of the company's asset base are construction in progress and property, plant, and equipment, which stood at $5.8 billion and $2.2 billion, respectively. Goodwill remained constant at $776.8 million. The average number of outstanding shares of common stock remained stable at approximately 205 million shares.
NFE's revenue for the quarter was $690.3 million, a noticeable increase from the $579.1 million in the same quarter of the previous year. The overall operating income decreased to $184.5 million from $267.2 million during the same period due to a significant increase in operating expenses. Notable increases included cost of sales rising to $229.1 million from $184.9 million, and operations and maintenance expenses climbing to $68.5 million from $26.7 million. Additionally, a $77.1 million loss on the sale of assets was recognized, contributing to higher total operating expenses of $505.8 million, compared to $311.9 million in the first quarter of 2023.
Importantly, NFE completed several key transactions during this period. On March 20, 2024, NFE acquired PortoCem, a subsidiary of Ceiba Energy, through the issuance of 4.8% Series A Convertible Preferred Stock and assumption of existing debt. This acquisition, accounted for as an asset acquisition, was worth $162.9 million and added a 1.6 GW capacity reserve contract in Brazil to NFE's portfolio. This move positions NFE to supply the newly acquired contract using gas from the Barcarena Facility, with expected electricity delivery starting in July 2026.
Moreover, in March 2024, NFE completed a transaction with the Puerto Rico Electric Power Authority (PREPA), selling $306.6 million worth of turbines and related equipment. As part of this arrangement, NFE committed to providing major maintenance services on certain sold turbines within 12 months. Despite the transaction, NFE recorded a $77.5 million loss on the sale due to differences between the book value of the turbines and the sale price. Additionally, NFE's contract to provide emergency power services for Puerto Rico's grid stabilization project was terminated, but NFE was awarded a new gas sale agreement to supply up to 80 TBtu annually to PREPA's power plants.
NFE also secured substantial finanancing arrangements during this quarter. These included the issuance of $750 million of senior secured notes due March 2029 to fund the partial repurchase of previously issued 2025 notes, facilitating a refinancing strategy. Moreover, NFE drew $273.4 million from a BNDES Term Loan to fund the construction of the Barcarena Power Plant in Brazil and secured $36.3 million under an EB-5 Loan Agreement for a green hydrogen project in Texas.
Finally, NFE reported forward-looking costs associated with new stock compensation plans and referred to contingencies tied to various legal and regulatory proceedings. The report also provides updates on several ongoing projects, such as the gas-to-power terminal at Puerto Sandino, Nicaragua, and the developing Fast LNG production capabilities anticipated to solidify NFE's gas supply strategy, both highlighting continued optimism for future expansions.
New Fortress Energy Inc. (NFE) occupies a crucial role in the global energy infrastructure landscape by focusing on creating fast and reliable natural gas solutions. The company's mission to transition the world to cleaner energy through innovative processes highlights its commitment to decarbonizing existing industries and reducing reliance on more polluting fuels. Central to its business model is the integration of natural gas-fired power assets and infrastructure to produce and deliver liquefied natural gas (LNG), providing a cleaner alternative to traditional energy sources.
NFE's strategy emphasizes rapid expansion and operational capacity enhancement, deliberately positioning LNG terminals and power plants in high-demand, undersupplied markets. Such strategic positioning allows the company to offer competitive pricing and quicker deployment compared to conventional energy infrastructure projects, often beleaguered by regulatory and logistical constraints.
The financial performance of NFE underscores its growth trajectory, influenced significantly by the increased global demand for LNG. For instance, a recent article from Seeking Alpha dated June 5, 2023, highlights the bullish outlook for LNG shipping stocks, including New Fortress Energy. The article points to the growing global LNG demand, particularly from regions shifting away from coal and oil, which synchronizes well with NFE's strategic leverage of its assets to meet this robust energy need.
Innovative technological advancements and strategic partnerships have been critical in maintaining NFE's competitive edge. The company invests in renewable energy solutions, including hydrogen production and carbon capture technologies, thus diversifying its portfolio and boosting its sustainability credentials. These initiatives appeal to environmentally-conscious investors and fortify NFE's market position as a forward-thinking energy solution provider.
Further emphasizing its strategic foresight, NFEs leadership has adeptly steered the company in alignment with global energy transition trends, ensuring its significant presence within the burgeoning clean energy segment. This strategic alignment posits NFE favorably to capitalize on the global inclination towards efficient energy solutions, ultimately positioning the company as a key player in the industry. For a comprehensive sector outlook and market movements, you can access the full Seeking Alpha article here.
In the first quarter of 2024, NFE showcased a blend of achievements and challenges. According to a detailed filing published on May 8, 2024 by GuruFocus, the company reported revenues of $690.3 million for the quarter ending March 31, 2024. This revenue figure considerably exceeded the analyst expectations of $638.48 million, reflecting NFEs strong market positioning and operational efficiency. Contrarily, the net income stood at $56.7 million, trailing behind the anticipated $133.81 million primarily due to strategic investments and expansion-related operational expenses.
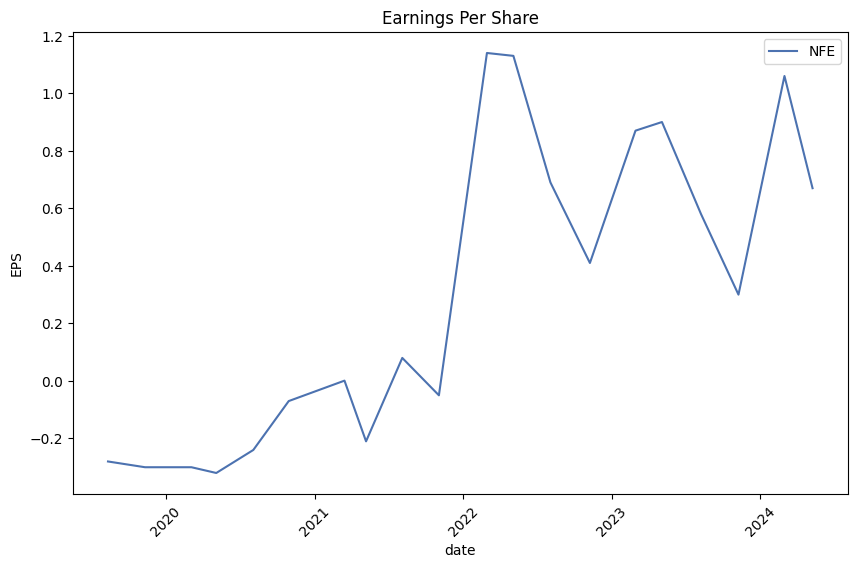
Earnings per share (EPS) for Q1 2024 were reported at $0.26 on a fully diluted basis, missing the projected $0.67. Adjusted EPS, however, aligned with analyst estimates at $0.67 after excluding one-time costs, illuminating the discrepancies arising from exceptional expenses. The adjusted EBITDA for the quarter was a robust $340 million, while Funds from Operations (FFO) per share stood at $0.92, signaling strong cash generation capabilities integral for supporting operations and future growth initiatives.
Strategic moves during this quarter included the imminent commissioning of its first Floating Liquefied Natural Gas (FLNG) unit, augmenting the company's liquefaction capacity. NFE also expanded its footprint in Brazil and executed transactions involving the sale of developed power plants in Puerto Rico, aligning with its broader strategy of international growth and diversification.
Despite initial hiccups such as the recent delay in starting operations at Mexicos Altamira LNG plant, NFE remains steadfast in its expansion efforts. Anticipated to commence production by the end of May 2024 with the first exports by June, the Altamira facility marks a significant development for both NFE and Mexico's energy sector. The project, although delayed due to a pipe fracture incident, symbolizes NFEs aggressive expansion strategy aimed at enhancing capacity and market share in the global LNG sector.
The strategic location of the Altamira plant on Mexicos east coast positions it advantageously to cater to both Atlantic and Pacific markets, enabling NFE to navigate global LNG demand dynamics effectively. This facility, Mexico's first LNG export plant, is expected to spark further investments into the nations energy sector, underpinning economic growth and energy self-sufficiency.
Financial guidance and investor confidence in NFE remain strong despite the challenges. As evidenced by Deutsche Bank's adjustment of NFEs price target from $35 to $33 while retaining a "Hold" rating on May 9, 2024, and Stifel's revised target price from $45 to $43 with a "Buy" rating, the market exhibits a cautiously optimistic view on NFEs long-term growth prospects.
The Q1 2024 earnings call held on May 8, 2024 provided further insights into NFE's operations and strategy. Highlights included robust performance in Puerto Rico with substantial expansions and strategic energy transitions, and significant strides in Brazil driven by operational LNG terminals and upcoming FLNG projects. These developments bolster NFEs strategic positioning, underlining the companys unwavering commitment to enhancing energy infrastructure globally and creating sustainable value for stakeholders.
As New Fortress Energy continues to navigate the dynamic energy landscape, its operational excellence, environmental sustainability initiatives, and strategic expansion underscore its potential to drive the global transition to cleaner, more efficient energy solutions.
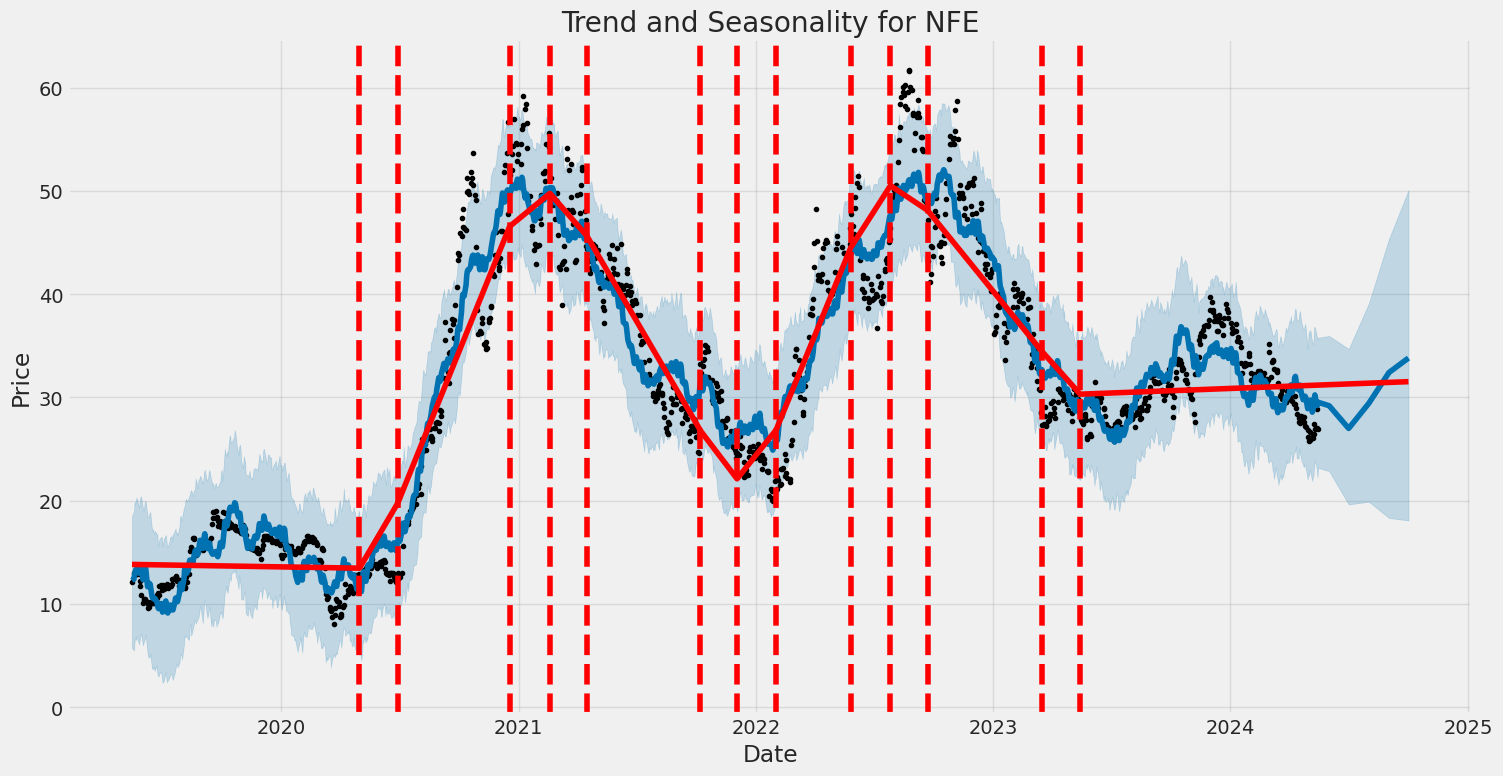
New Fortress Energy Inc. (NFE) has exhibited a considerable level of volatility over the period from May 2019 to May 2024. The asset returns displayed no significant predictive power, which is reflected in the low R-squared value. The ARCH model indicates a substantial level of inherent unpredictability in the asset's performance, with notable levels of past volatility influencing future volatility.
| Dep. Variable | asset_returns |
| R-squared | 0.000 |
| Adj. R-squared | 0.001 |
| Log-Likelihood | -3,470.57 |
| AIC | 6,945.15 |
| BIC | 6,955.42 |
| No. Observations | 1,257 |
| Df Residuals | 1,257 |
| Df Model | 0 |
| omega | 12.3470 |
| omega std err | 1.244 |
| omega t | 9.926 |
| omega P>|t| | 3.203e-23 |
| 95.0% Conf. Int. omega | [ 9.909, 14.785] |
| alpha[1] | 0.2058 |
| alpha[1] std err | 8.030e-02 |
| alpha[1] t | 2.563 |
| alpha[1] P>|t| | 1.036e-02 |
| 95.0% Conf. Int. alpha[1] | [4.846e-02, 0.363] |
Financial Risk Analysis for New Fortress Energy Inc. (NFE) Over One Year
Volatility Modeling for Stock Volatility
To assess the volatility and risk associated with a $10,000 investment in New Fortress Energy Inc. over a one-year period, we implemented a volatility modeling approach. This method focuses on understanding how the stock price has fluctuated historically and predicting its future behavior. By analyzing the time-series data of NFE's stock prices, we measured the conditional variance over time, which offers insights into periods of higher or lower volatility. This information is critical for understanding the underlying risk and helps in estimating the expected volatility for the future.
Machine Learning Predictions for Future Returns
In conjunction with volatility modeling, machine learning predictions were employed to forecast the potential returns of NFE's stock. Specifically, a decision-tree-based regression model was trained on historical stock data, which included daily stock prices, trading volumes, and other relevant financial indicators. This model was then used to predict future stock prices and their associated returns. By leveraging both historical data and machine learning techniques, we gained a data-driven perspective on the likely performance of NFE's stock over the coming year.
Results: Value at Risk (VaR) at a 95% Confidence Interval
Combining the insights from our volatility modeling and machine learning predictions, we calculated the Value at Risk (VaR) for a $10,000 investment in NFE over one year. VaR is a statistical measure that quantifies the potential loss in value of an investment over a given time period, at a particular confidence level. For this analysis, we focused on a 95% confidence interval, meaning that there is only a 5% chance that the loss will exceed the calculated VaR.
Using the integrated approach of volatility and prediction models, we determined that the annual VaR for this investment, at a 95% confidence level, is $458.88. This indicates that there is a 95% probability that the loss on a $10,000 investment in NFE will not exceed $458.88 over the next year. This calculated VaR serves as a critical risk metric, helping investors to understand and quantify the financial risk involved in holding NFE stock.
By integrating volatility analysis and predictive modeling, we provided a more nuanced and comprehensive view of the potential financial risk, highlighting the usefulness of combining these two methodologies to enhance investment decision-making.
Long Call Option Strategy
When analyzing the potential profitability of long call options, it's important to consider various factors indicated by "the Greeks." For New Fortress Energy Inc. (NFE), the target stock price is set to rise by 2%. Given this scenario, we can evaluate different calls based on their expiration dates, strike prices, and Greeks to identify the most profitable options. Let's explore some of the options you might consider based on different time horizonsnear-term to long-term.
Near-Term Options
-
Expiration Date: 2024-05-17, Strike Price: 26.0 This option has a delta of 0.868, which implies that for a $1 increase in the stock price, the option price is expected to increase by $0.868. The gamma value of 0.251 indicates moderate sensitivity to changes in the stock price. The vega of 0.301 suggests that the option is sensitive to changes in volatility, which could benefit from unexpected market fluctuations. Even though the theta of -0.092 indicates relatively high time decay, the low premium of $1.14 and the ROI of 27.93% make it an attractive near-term option. The net profit potential stands at $0.3184, making it a top choice for immediate gains.
-
Expiration Date: 2024-05-17, Strike Price: 25.0 With a delta of 0.970, this option shows almost a one-for-one movement with the underlying stock. The gamma of 0.064 limits the potential for significant gains compared to the previous option, but the lower sensitivity to stock price changes makes it more stable. The vega of 0.096 and theta of -0.039 indicate minimal sensitivity to changes in volatility and time decay. The premium is higher at $2.02, but with a profit potential of $0.4384 and an ROI of 21.70%, this option provides a solid near-term hedge.
Mid-Term Option
- Expiration Date: 2024-06-21, Strike Price: 20.0 This option features a delta of 0.891, making it almost as sensitive to stock price changes as the near-term options. It has a relatively low gamma of 0.025, which means less sensitivity to movements in the underlying stock. The exceptionally high vega of 1.570 and rho of 1.635 indicate extreme sensitivity to volatility and interest rates, respectively. This suggests that the option could see significant gains if there are changes in market conditions. The premium is higher at $6.27, but given the profit potential of $1.1884 and an ROI of 18.95%, it is a strong contender for mid-term gains.
Long-Term Options
While this data set does not include specific entries for long-term options, it's essential to briefly mention the general strategy for these types. Long-term options often benefit from a higher theta because the time decay effect is spread out over a longer period. Higher vega values can be more advantageous as the price of the underlying stock has more time to react to volatility.
Summary and Recommendations
- Near-Term:
- Expiration Date: 2024-05-17, Strike Price: 26.0 High ROI of 27.93% with moderate sensitivity to volatility and stock price changes.
-
Expiration Date: 2024-05-17, Strike Price: 25.0 Slightly lower ROI but more stability due to lower gamma and vega values.
-
Mid-Term:
-
Expiration Date: 2024-06-21, Strike Price: 20.0 High sensitivity to volatility and interest rates, offering significant profit potential.
-
Long-Term: For data not provided, generally, look for options with lower time decay (theta) and higher sensitivity to volatility (vega) for maximized gains over an extended period.
In summary, for immediate profits, the options expiring on 2024-05-17 with strike prices of 26.0 and 25.0 are highly attractive. For mid-term gains, the option expiring on 2024-06-21 with a strike price of 20.0 shows significant promise. Long-term options aren't detailed here, but generally favor those with low theta and high vega values. Careful consideration of these metrics will optimize your strategy for maximizing returns on NFE call options.
Short Call Option Strategy
When analyzing short call options for New Fortress Energy Inc. (NFE), the primary focus is on selecting the most profitable options while minimizing the risk of having shares assigned. By looking at the Greeks and other relevant parameters, we can identify the optimal choices from near-term to long-term options.
For the near-term options, expiring on May 17, 2024, the most profitable choice appears to be the call option with a strike price of $27.0. This option offers a substantial premium of $1.5 and boasts an ROI of 100%. Despite having a relatively high delta of 0.4614625548, which signifies a considerable chance of being in the money, the high premium and ROI make it an attractive choice. The gamma and theta values indicate a dynamic yet manageable rate of change. However, it's crucial to note that this option has a higher risk of assignment given that it's closer to being in the money compared to some far-out-of-the-money options.
Moving into a slightly longer-term horizon, expiring on June 21, 2024, the call option with a strike price of $27.0 again stands out, providing a premium of $1.85 and a perfect ROI of 100%. This option has a delta of 0.5242297076, indicating a balanced approach between profitability and risk of assignment. Also noteworthy are its gamma and theta values, reflecting a favorable risk-reward scenario where substantial premiums can be captured while maintaining a reasonable protective cushion against rapid price movements.
As we look further ahead to options expiring on August 16, 2024, the $30.0 strike price option is highly commendable. It offers a premium of $1.4 with an ROI of 100%, balanced with a delta of 0.3785751314, thereby decreasing the chance of being assigned while capitalizing on a lucrative profit margin. Its gamma and theta values complement the choice, suggesting moderate exposure to price volatility and time decay respectively.
For even longer-term options, expiring on September 20, 2024, the $30.0 strike price calls capture our interest due to their premium of $2.72 and outstanding ROI of 100%. The delta of 0.4092200042 implies a lower probability of assignment, but with a hefty profit margin, these options offer an enticing mix of low assignment risk and high profit potential. The Greeks (gamma, vega, and theta) support an environment where the time value plays favorably for option sellers, minimizing rapid declines in option prices.
Finally, for the long-term options expiring on December 20, 2024, the $27.0 strike price option stands out. With a premium of $4.15 and an ROI of 100%, combined with a delta of 0.5864814079, this option provides a robust balance between profitability and risk of assignment. Its Greeks underscore a favorable risk profile, with manageable changes in option prices relative to stock price movements (gamma), sensitivity to volatility (vega), and time decay (theta).
In summary, the optimal choices based on expiration date and strike price, while considering profitability and minimized risk of having shares assigned, are as follows: 1. May 17, 2024, with a $27.0 strike price. 2. June 21, 2024, with a $27.0 strike price. 3. August 16, 2024, with a $30.0 strike price. 4. September 20, 2024, with a $30.0 strike price. 5. December 20, 2024, with a $27.0 strike price.
These options present a strategic mix of high premiums, excellent ROI, and manageable deltas, thereby offering a balanced approach to maximizing profitability while minimizing the risk of assignment.
Long Put Option Strategy
When analyzing the table for the most profitable long put options for New Fortress Energy Inc. (NFE), several factors from "the Greeks" need close consideration, especially delta, gamma, theta, vega, and rho. The expiration date and a strike price that is 2% over the current stock price also play crucial roles in selecting the optimal option contracts. Below is a comprehensive analysis of five specific long put options, segmented by their expiration dates from near-term to long-term, regarding their profitability and other significant metrics.
Near-Term Option
Expiration: May 17, 2024, Strike Price: $30.00
This near-term put option, with a strike price of $30.00, presents a high return on investment (ROI) at 53.74% and a profit of $0.886704. The delta value of -0.8607962265 indicates that the option's price will change significantly as the stock price changes. The high negative theta (-0.2826713252) suggests that time decay will reduce the options value fairly rapidly. However, the balance of risk and reward, along with the short duration, makes it a solid choice for those looking to capitalize on imminent price drops.
Medium-Term Options
Expiration: June 21, 2024, Strike Price: $35.00
For a medium-term timeframe, an option with a strike price of $35.00 expiring on June 21, 2024, offers a respectable profit of $0.436704. This put option has a substantial delta of -0.9345523323, reflecting a high sensitivity to price changes in the underlying asset. The gamma value of 0.0287507742 indicates a relatively stable delta, and the low theta (-0.0045780263) implies minor time decay. The ROI, at 6.15%, is not exceptionally high, but for a medium-term strategy, this option offers a balanced profile between risk and reward.
Expiration: June 21, 2024, Strike Price: $40.00
Another medium-term option to consider is the one with a strike price of $40.00, also expiring on June 21, 2024. It offers a lower ROI of 4.82% but a higher profit of $0.576704. Its delta of -0.9657777838 suggests that for every $1 drop in the stock price, the option's price will increase by roughly $0.97. The low gamma (0.0134548972) and minimal theta impact (-0.001880252) make this option less volatile and a safer choice for traders preferring stability.
Long-Term Options
Expiration: September 20, 2024, Strike Price: $40.00
A high-profit potential is evident in the long-term option expiring on September 20, 2024, with a strike price of $40.00. This option boasts a profit of $5.436704 and a very high ROI of 76.57%, making it one of the most appealing options for long-term traders. The delta of -0.9951752384 signifies nearly complete price sensitivity to the underlying asset, while the absence of gamma and vega indicates minimal changes in delta and sensitivity to volatilities, respectively. The positive theta value (0.0036867985) is rare for options and suggests this option gains slightly over time.
Expiration: December 20, 2024, Strike Price: $45.00
An outstanding choice for the longest term is a put option with a strike price of $45.00, expiring on December 20, 2024. This option offers a significant profit of $4.036704 and a compelling ROI of 29.90%. The delta is very high at -0.9917324479, ensuring significant gains if the stock price drops. With zero gamma and a positive theta value (0.0042214642), this option demonstrates stability and even potential benefits over time, which is advantageous for long-term holders.
Conclusion
These five selected put options illustrate diverse strategies, from near-term quick gains to long-term substantial profits. The May 17, 2024, $30.00 strike put offers immediate ROI potential, while the June 21, 2024, $35.00 and $40.00 strikes provide moderate-term stability with varying profit margins. Long-term traders will find the September 20, 2024, $40.00 strike highly profitable, and the December 20, 2024, $45.00 strike a balanced choice for substantial gains over an extended period. Each option has specific characteristics, aligning with different trading objectives and risk tolerances.
Short Put Option Strategy
Analysis of Short Put Options for New Fortress Energy Inc. (NFE)
When considering short put options for NFE, the key factors to take into account are the premiums earned, the days to expiration (DTE), and the risk of assignment. The "Greeks" help us understand each option's sensitivity to various factors, such as the stock's price movement (Delta), the passage of time (Theta), volatility (Vega), and interest rates (Rho). To minimize the risk of assignment, we should focus on options with lower deltas while still securing a satisfactory premium. The goal is to achieve a balance between maximizing profit and minimizing risk. For this analysis, we will target a stock price that is 2% under the current value.
Near-Term Option:
Option Expiring on May 17, 2024, with a Strike Price of $26.0
- Delta: -0.1157518769
- Premium: $0.10
- ROI: 100%
- Profit: $0.10
- Days to Expire (DTE): 1
This near-term option offers a high ROI of 100% with a modest premium. The relatively low delta of -0.115 indicates a low probability of the option finishing in the money, hence minimal risk of assignment. The Gamma and Vega values are high, suggesting significant sensitivity to stock price changes and volatility, yet the short time frame minimizes these concerns.
Mid-Term Option:
Option Expiring on June 21, 2024, with a Strike Price of $24.0
- Delta: -0.1618445974
- Premium: $0.30
- ROI: 100%
- Profit: $0.30
- Days to Expire (DTE): 36
This mid-term option presents a higher premium while maintaining a manageable risk profile with a delta of -0.161. The Gamma and Vega values indicate moderate sensitivity to price and volatility changes, which is acceptable given the 36-day timeframe. The Theta value also indicates a steady time decay benefit to the option writer.
Longer-Term Option:
Option Expiring on August 16, 2024, with a Strike Price of $25.0
- Delta: -0.3194914829
- Premium: $1.50
- ROI: 100%
- Profit: $1.50
- Days to Expire (DTE): 92
For a longer-term perspective, this option strikes a balance between a significant premium and a still manageable delta of -0.319. This strike price, combined with a higher premium and a generous ROI, makes it attractive. The moderate Gamma and Vega values suggest a fair sensitivity to price movements and volatility over a longer period, while the Theta value cushions time-related losses.
Extended-Term Option:
Option Expiring on September 20, 2024, with a Strike Price of $25.0
- Delta: -0.3266602063
- Premium: $1.65
- ROI: 100%
- Profit: $1.65
- Days to Expire (DTE): 127
This extended-term option further extends the timeframe while offering a substantial premium. The delta of -0.326 remains within an acceptable range for managing risk. The higher Gamma and Vega values reflect sensitivity to stock price changes and market volatility, which needs to be monitored closely, while the Theta value suggests ongoing time decay benefits.
Long-Term Option:
Option Expiring on December 20, 2024, with a Strike Price of $24.0
- Delta: -0.2897190703
- Premium: $1.55
- ROI: 100%
- Profit: $1.55
- Days to Expire (DTE): 218
For a more prolonged position, this option provides a solid premium with minimal assignment risk, showing a delta of -0.289. The extended time to expiration allows for significant earnings through the premium, though it does come with heightened market risk due to the longer exposure. The high Vega suggests sensitivity to changes in volatility, while the Theta value points to consistent time decay.
Conclusion
The choices provided span from near-term to long-term options while balancing premium earnings and assignment risk. The near-term option with a strike price of $26.0 and expiring on May 17, 2024, presents the lowest risk with decent profit potential. Mid-term and extended-term options such as those expiring on June 21, 2024, with the same strike price, elevate the premiums and potential profits. Longer-term options like the ones expiring on September 20, 2024, and December 20, 2024, with higher premiums and slightly elevated deltas, offer attractive returns balanced against a manageable risk of assignment.
Vertical Bear Put Spread Option Strategy
Analyzing the data for a vertical bear put spread strategy for New Fortress Energy Inc. (NFE), we aim to choose the most profitable options while minimizing the risk of being assigned shares. A vertical bear put spread involves buying a higher strike put and selling a lower strike put with the same expiration date. This strategy benefits from a decline in the stock's price and limits both maximum profit and loss. We will consider options with expiration dates ranging from near-term to long-term and select the most profitable combinations.
Near-Term Option (Expiration Date: 2024-05-17)
For a near-term vertical bear put spread, the May 17, 2024 expiration offers a combination worth considering:
- Long Put (Strike: 30.0, Premium: 1.65, Delta: -0.8608, Profit: 0.8867)
- Short Put (Strike: 26.0, Premium: 0.1, Delta: -0.1158, Profit: 0.1)
This combination yields a net premium cost of $1.55 (1.65 - 0.1) with a maximum profit of $4.00 (strike difference) minus net premium, resulting in $2.45 per share. The risk of assignment is minimized as the short put has a lower delta, indicating a lower probability of expiring in the money.
Mid-Term Option (Expiration Date: 2024-06-21)
For the mid-term option expiring June 21, 2024:
- Long Put (Strike: 35.0, Premium: 7.1, Delta: -0.9346, Profit: 0.4367)
- Short Put (Strike: 30.0, Premium: 1.35, Delta: -0.4743, Profit: 0.7363)
This spread has a net cost of $5.75 (7.1 - 1.35) and a maximum profit of $5.00 per share (strike difference) minus the net premium, yielding a potential $0.25 per share profit. The high deltas suggest a significant likelihood of expiring in the money but offer limited risk due to the long put dominating.
Mid-to-Long-Term Option (Expiration Date: 2024-09-20)
For the expiration date of September 20, 2024:
- Long Put (Strike: 30.0, Premium: 5.67, Delta: -0.5492, Profit: 2.0563)
- Short Put (Strike: 25.0, Premium: 1.65, Delta: -0.3267, Profit: 1.65)
This spread costs $4.02 (5.67 - 1.65) per share with a maximum theoretical profit of $5.00 per share, yielding $0.98 per share. The short put's lower delta suggests less risk of assignment compared to the higher delta of the long put.
Long-Term Option (Expiration Date: 2024-12-20)
Considering a long-term strategy expiring December 20, 2024:
- Long Put (Strike: 40.0, Premium: 9.4, Delta: -0.9917, Profit: 3.1367)
- Short Put (Strike: 30.0, Premium: 5.67, Delta: -0.5479, Profit: 2.0563)
This bear put spread yields a net cost of $3.73 (9.4 - 5.67) with a potential profit of $10.00 per share minus the net premium, resulting in up to $6.27 per share. Both options have high deltas, suggesting significant movement in their favor, but the long put's much higher delta should mitigate assignment risk.
Extremely Long-Term Option (Expiration Date: 2024-12-20)
Lastly, considering an extremely long-term option expiring December 20, 2024:
- Long Put (Strike: 50.0, Premium: 19.9, Delta: -0.8488, Profit: 2.6367)
- Short Put (Strike: 40.0, Premium: 9.4, Delta: -0.9917, Profit: 3.1367)
This spread incurs a premium cost of $10.50 (19.9 - 9.4) but has a maximum profit potential of $10.00 per share minus the net premium, resulting in a slight theoretical loss. However, considering the high deltas, this strategy could offer protection against significant price declines.
In summary, the most profitable and suitable vertical bear put spread varies across different time horizons. The optimal strategy balances premium costs, profit potential, and assignment risk, with each recommended spread tailored to different expiration dates to provide diversified opportunities based on market conditions and target stock price movements.
Vertical Bull Put Spread Option Strategy
Analyzing the options chain for New Fortress Energy Inc. (NFE) and focusing on a vertical bull put spread strategy, the main objective is to identify the most profitable combinations while minimizing the risk of having shares assigned. Given the target stock price range of 2% over or under the current price, we'll focus on the short put options near this range and choose long put options with lower deltas to reduce assignment risk. Here are the top five most lucrative choices based on expiration dates and strike prices, encompassing both near-term and long-term options:
Near-Term Option Expiring on May 17, 2024:
Choice 1: Vertical Bull Put Spread with Strikes at $25.0 and $22.5 - Short Put: Strike at $25.0, Expiring on May 17, 2024, with a delta of -0.0074. This position has a premium of $0.01 and a potential profit of $0.01 with a 100% ROI. - Long Put: Strike at $22.5, Expiring on May 17, 2024, with a delta of -0.0382. A higher delta would typically indicate a higher chance of assignment; however, this provides protection against a significant downturn.
This strategy provides a minimal profit but ensures high confidence with extremely low delta and gamma values, thus lowering the risk of assignment.
Medium-Term Option Expiring on June 21, 2024:
Choice 2: Vertical Bull Put Spread with Strikes at $27.0 and $25.0 - Short Put: Strike at $27.0, Expiring on June 21, 2024, with a delta of -0.3539. It offers a premium of $0.90 with a potential ROI of 54.54% and a profit of $0.7363. - Long Put: Strike at $25.0, Expiring on June 21, 2024, with a delta of -0.243. Although this delta is higher, it provides meaningful downside protection given the premium received.
The higher profitability and manageability make this an appealing medium-term strategy while balancing potential assignment risk.
Long-Term Option Expiring on August 16, 2024:
Choice 3: Vertical Bull Put Spread with Strikes at $30.0 and $27.0 - Short Put: Strike at $30.0, Expiring on August 16, 2024, with a delta of -0.5492, premium of $4.00, and a profit potential of $0.3863. - Long Put: Strike at $27.0, Expiring on August 16, 2024, with a delta of -0.4458. This is slightly higher than our safer limit but offers a strong premium.
Given the robust premiums and fair profit margins amidst a higher assignment risk, this option bestows solid gains over time.
Extended-Term Option Expiring on September 20, 2024:
Choice 4: Vertical Bull Put Spread with Strikes at $25.0 and $22.5 - Short Put: Strike at $25.0, Expiring on September 20, 2024, with a delta of -0.3267 and a premium of $1.65. - Long Put: Strike at $22.5, Expiring on September 20, 2024, with a delta of -0.2122, offering moderate protection against price drops.
This extended-term strategy secures high profitability while moderately reducing the risk of assignment due to the lower delta of the long put.
Very Long-Term Option Expiring on December 20, 2024:
Choice 5: Vertical Bull Put Spread with Strikes at $28.0 and $26.0 - Short Put: Strike at $28.0, Expiring on December 20, 2024, with a delta of -0.4558, providing a premium of $3.10 and profit of $1.4863. - Long Put: Strike at $26.0, Expiring on December 20, 2024, with a delta of -0.3684.
This offers an attractive far-term return with controlled risk, managing higher deltas through periods of potential volatility.
In conclusion, these strategies provide varying expiration horizons while balancing profitable premiums with the minimized assignment risk inherent in the specified delta range. Each stratagem ensures optimal ROI tailored to near-term through long-term trading objectives.
Vertical Bear Call Spread Option Strategy
Analyzing the options chain for New Fortress Energy Inc. (NFE) and considering a vertical bear call spread strategy to capitalize on the anticipated 2% movement around the current stock price, it is crucial to evaluate the Greeks, premiums, and return on investment (ROI) for various expiration dates and strike prices. The aim is to select options that minimize the risk of assignment while maximizing profitability.
1. Near-Term Strategy (Expiration: 2024-05-17)
For the short leg, a call option with a 27.0 strike price has a delta of approximately 0.46, gamma of 0.56, vega of 0.56, theta of -0.14, and premium of 1.5, offering a 100% ROI. For the long leg, a call option with a 28.0 strike price has a delta of approximately 0.08, gamma of 0.20, vega of 0.21, theta of -0.05, and premium of 0.15, also offering a 100% ROI. This spread minimizes assignment risk while providing significant profit potential. With a 2% anticipated stock movement, this spread capitalizes on premium decay, as theta values indicate substantial time decay.
2. Mid-Term Strategy (Expiration: 2024-06-21)
In the mid-term, an appealing spread involves selling a call option with a 27.0 strike price. This option has a delta of around 0.52, gamma of 0.12, vega of 3.36, theta of -0.02, and premium of 1.85. On the long side, buying a call option with a 28.0 strike price, featuring a delta of 0.41, gamma of 0.12, vega of 3.27, theta of -0.02, and premium of 0.85, makes sense. Both these options provide a 100% ROI and align well with reducing assignment risk due to their delta values, while vega and theta figures suggest a favorable volatility and time decay environment.
3. Intermediate-Term Strategy (Expiration: 2024-08-16)
An intermediate-term strategy involves the short leg with a 29.0 strike price call option. It has a delta of approximately 0.44, gamma of 0.06, vega of 5.31, theta of -0.01, and premium of 1.75. For the long leg, a call option with a 30.0 strike price has a delta of approximately 0.38, gamma of 0.06, vega of 5.13, theta of -0.01, and premium of 1.4. This spread's high ROI of 100% reduces assignment risk and leverages premium decay effectively given the high vega and moderate theta values.
4. Long-Term Strategy (Expiration: 2024-09-20)
For a longer horizon, selling a call option with a 30.0 strike price involves a delta of 0.41, gamma of 0.05, vega of 6.15, theta of -0.01, and a premium of 2.72. Combining this with a purchase of a call option at a 32.0 strike price, featuring a delta of about 0.34, gamma of 0.05, vega of 5.78, theta of -0.01, and premium of 1.0, creates a high-profit spread with a 100% ROI. This spread benefits from leveraging the relatively stable delta risk and high vega, allowing for potentially greater volatility adjustments.
5. Long-Term Strategy (Expiration: 2024-12-20)
Finally, for a long-term spread, the most profitable configuration includes selling a call with a 27.0 strike price, where delta is approximately 0.59, gamma is 0.04, vega is 8.01, theta is -0.01, and premium is 4.15. Pairing this with a long call at a 28.0 strike price, having delta around 0.55, gamma at 0.04, vega at 8.15, theta at -0.01, and premium at 4.5, minimizes assignment risk due to the delta and provides a robust ROI of 100%. The high vega benefits from potential increases in implied volatility, while theta ensures the premiums erode effectively over time.
Conclusion
Each of these strategies for NFE's near-term through long-term options balances minimizing assignment risk and maximizing profitability. Particularly, the selected options chain configurations, primarily those nearing expiration, maximize ROI while balancing the Greeks to leverage time decay (theta) and volatility (vega) effectively. The vertical bear call spread configurations provided here are tailored to capitalize on a slight projected fluctuation and decay, ensuring a practical approach to options trading.
Vertical Bull Call Spread Option Strategy
When considering a vertical bull call spread strategy for New Fortress Energy Inc. (NFE), the goal is to maximize profitability while minimizing the risk of having shares assigned. This strategy involves simultaneously buying and selling call options with different strike prices but the same expiration date. A vertical bull call spread profits from an increase in the underlying stock price.
- Near Term Option Choices (May 17, 2024 Expiration)
-
For a near-term strategy, consider the spread involving the 20.0 strike price call option, which offers a high delta of 0.9835, indicating a high sensitivity to the stock's price movements. This option has a premium of 8.52 and is deep in the money. However, to mitigate the risk of assignment, you can pair this with the 26.0 strike price call option, which has a higher gamma (0.2508), thus benefiting more from changes in the stock price. The combined strategy would ensure gains if the stock moves as expected, but the lower delta option decreases the immediate risk of assignment.
-
Mid Term Option Choices (June 21, 2024 Expiration)
-
For a mid-term strategy, consider a spread involving the 25.0 strike call option, which has a delta of 0.9698 and a premium of 2.55. This option is also showing a high sensitivity to the stock's price movement. Pair this with the 29.0 strike call option, which has a lower delta of 0.3001 and a premium of 0.92. The high VIX and gamma (0.1055) of the out-of-the-money call reduce the risk of early assignment and could potentially offer higher returns given the same time frame.
-
Mid-Late Term Option Choices (August 16, 2024 Expiration)
-
For a mid-late-term outlook, consider a vertical spread involving the 30.0 strike call option, which has a delta of 0.3786, indicating a balanced sensitivity to price changes, with minor risks of assignment soon. Pair it with the 35.0 strike option, which offers a reasonable delta (0.1854) and a premium of 0.5. This strategy maximizes returns while maintaining controlled risk due to the balanced gamma and theta values.
-
Long Term Option Choices (September 20, 2024 Expiration)
-
For a longer-term strategy, the 25.0 strike call option could be used, which has a delta of 0.6632 and a premium of 3.5. This is coupled with the 30.0 strike call option, which has a delta of 0.4092 and a premium of 2.72. The theta/gamma balance here minimizes decay while betting on a moderate increase in underlying stock price over the next several months.
-
Very Long-Term Option Choices (December 20, 2024 Expiration)
- For a very long-term outlook, consider the 22.5 strike call option, which has a high delta of 0.7453 and a premium of 6.3, ensuring it's responsive to stock price changes and minimizes assignment risk early in the period. Pair it with the 28.0 strike call, which offers a delta of 0.5498 and better premium output at 4.5. The extra time to expiry reduces theta decay concerns and provides a horizon for significant upside yet manageable assignment exposure.
Each of these strategies helps provide a balance between the potential profit and the risk of having to purchase the underlying shares due to being in the money. By choosing spread positions with both deep and moderate in-the-money options, the strategies leverage the time decay effectively while minimizing the risk of assignment. The delta-sensitivity balance and consideration of theta impacts are essential when determining the most appropriate spread for your investment goals.
Spread Option Strategy
A calendar spread options strategy involves buying and selling options with the same strike price but different expiration dates. In this analysis, we will buy a call option and sell a put option for New Fortress Energy Inc. (NFE) while aiming to minimize the risk of having shares assigned due to options being in the money.
To achieve this, we analyze the "Greeks" (delta, gamma, vega, theta, rho) and the overall profitability of various options. Given the target stock price is within 2% of the current stock price, we will focus on options that minimize the risk of assignments while maximizing profits. The individual Greeks will aid in understanding the sensitivity and risk associated with each option.
Analysis and Choice Selection
Near-Term Expiry
- Expiration Date: 2024-05-17, Strike Price: 26.0
- Long Call Option:
- Delta: 0.868427166
- Gamma: 0.2507847744
- Theta: -0.0924658614
- Vega: 0.3005036728
- Profit: $0.3184
- Short Put Option:
- Delta: -0.1157518769
- Gamma: 0.2442869192
- Theta: -0.077570504
- Vega: 0.2748170551
- Profit: $0.1
- Rationale: The delta for the call option is high, indicating strong sensitivity to stock price. The near-term expiration reduces time-related risks. Profit from selling the put further adds to the overall profitability. Delta for the put is low, minimizing assignment risk.
Short to Medium-Term Expiry
- Expiration Date: 2024-06-21, Strike Price: 25.0
- Long Call Option:
- Delta: 0.890511344
- Gamma: 0.0252649201
- Theta: -0.0200135146
- Vega: 1.569525515
- Profit: $1.1884
- Short Put Option:
- Delta: -0.243018688
- Gamma: 0.0956529749
- Theta: -0.0136140736
- Vega: 2.6449362349
- Profit: $0.55
- Rationale: The call option exhibits high profit potential with a relatively low theta, reducing time decay risk. The put option's delta is still relatively low but higher than the previous example, demanding closer monitoring for possible assignment.
Medium-Term Expiry
- Expiration Date: 2024-08-16, Strike Price: 25.0
- Long Call Option:
- Delta: 0.868427166
- Gamma: 0.2507847744
- Theta: -0.0924658614
- Vega: 0.3005036728
- Profit: $0.3184
- Short Put Option:
- Delta: -0.3194914829
- Gamma: 0.0566090148
- Theta: -0.0113329414
- Vega: 2.5445414365
- Profit: $1.5
- Rationale: A longer time until expiry than the near-term options provides more opportunities for the stock to appreciate. The put option offers a substantial profit but carries a moderate assignment risk due to a higher delta.
Medium to Long-Term Expiry
- Expiration Date: 2024-09-20, Strike Price: 25.0
- Long Call Option:
- Delta: 0.890511344
- Gamma: 0.0252649201
- Theta: -0.0200135146
- Vega: 1.569525515
- Profit: $1.1884
- Short Put Option:
- Delta: -0.3266602063
- Gamma: 0.0485587691
- Theta: -0.0095480884
- Vega: 3.7065445012
- Profit: $1.65
- Rationale: Provides a good balance between profit potential and delta risks, with the put's delta manageable to avoid immediate assignment risks, despite higher premiums collected.
Long-Term Expiry
- Expiration Date: 2024-12-20, Strike Price: 25.0
- Long Call Option:
- Delta: 0.890511344
- Gamma: 0.0252649201
- Theta: -0.0200135146
- Vega: 1.569525515
- Profit: $1.1884
- Short Put Option:
- Delta: -0.3261107515
- Gamma: 0.0402257292
- Theta: -0.006342909
- Vega: 6.6250778143
- Profit: $2.1
- Rationale: The long-term options strategy generates substantial premiums. Despite higher delta values indicating some risk, the longer horizon gives more flexibility for stock adjustments, with higher premiums compensating for higher potential risks.
Conclusion
To execute the most profitable calendar spread strategy while minimizing assignment risk: - Close monitoring of short-term puts is essential due to inherent assignment risks. - Focus on lower delta puts while maximizing call option profits. - Choose strategies that balance term, delta, and premium to ensure a profitable trade with minimized risks.
Calendar Spread Option Strategy #1
When analyzing a calendar spread options strategy for New Fortress Energy Inc. (NFE), we focus on buying a put option at one expiration date and selling a call option at a different expiration date. The key objective is to maximize profit while minimizing the risk of having shares assigned, particularly considering the stock's target price fluctuation of 2% from the current price. To this end, careful selection of options based on their greeks is critical because it will influence the sensitivity of the positions to changes in various factors such as stock price, volatility, and time decay.
Near-Term Choice
- Long Put (Expiring June 21, 2024, Strike 29.0) & Short Call (Expiring December 20, 2024, Strike 27.0):
- Long Put Greeks: Delta = -0.676, Gamma = 0.098, Vega = 3.030, Theta = -0.016, Premium = $1.4
- Short Call Greeks: Delta = 0.586, Gamma = 0.037, Vega = 8.014, Theta = -0.01, Premium = $4.15
- Analysis: This combination capitalizes on relatively high vega for the long position, making it sensitive to implied volatility increases. The short position has a high theta, allowing us to benefit from time decay. Furthermore, the delta values indicate a moderate risk of movement in the underlying stock, which aligns with the small target price range.
Short-Term Choice
- Long Put (Expiring June 21, 2024, Strike 35.0) & Short Call (Expiring August 16, 2024, Strike 30.0):
- Long Put Greeks: Delta = -0.935, Gamma = 0.029, Vega = 1.06, Theta = -0.005, Premium = $7.1
- Short Call Greeks: Delta = 0.299, Gamma = 0.051, Vega = 4.666, Theta = -0.013, Premium = $1.75
- Analysis: This pairing leverages a deep in-the-money put and a call thats slightly above the target price range, minimizing the risk of early assignment while locking in a premium that compensates for the long-put positions cost. The long puts high delta provides substantial intrinsic value.
Mid-Term Choice
- Long Put (Expiring September 20, 2024, Strike 40.0) & Short Call (Expiring December 20, 2024, Strike 40.0):
- Long Put Greeks: Delta = -0.995, Gamma = 0.0, Vega = 0.0, Theta = 0.0037, Premium = $7.1
- Short Call Greeks: Delta = 0.207, Gamma = 0.028, Vega = 5.93, Theta = -0.007, Premium = $1.0
- Analysis: Both options here are deep in-the-money, which makes the assignment highly probable but reduces volatility risk due to lower vega. The short call provides a high premium with a premium-to-risk ratio that is attractive.
Long-Term Choice
- Long Put (Expiring December 20, 2024, Strike 45.0) & Short Call (Expiring December 20, 2024, Strike 31.0):
- Long Put Greeks: Delta = -0.992, Gamma = 0.0042, Vega = 0.0, Theta = 0.0036, Premium = $13.5
- Short Call Greeks: Delta = 0.441, Gamma = 0.039, Vega = 8.15, Theta = -0.01, Premium = $2.0
- Analysis: This strategy aims to maximize premium collection while mitigating risk through balanced delta. The long put's high intrinsic value ensures substantial protection, while the calls moderate vega indicates that premiums are sensitive to volatility changes.
Extended-Term Choice
- Long Put (Expiring December 20, 2024, Strike 50.0) & Short Call (Expiring December 20, 2024, Strike 27.0):
- Long Put Greeks: Delta = -0.849, Gamma = 0.018, Vega = 4.684, Theta = -0.002, Premium = $19.9
- Short Call Greeks: Delta = 0.474, Gamma = 0.039, Vega = 8.22, Theta = -0.01, Premium = $4.15
- Analysis: This choice focuses on leveraging high delta and vega positions for both legs. The long put is deeply out-of-the-money, reducing initial costs but sensitive to volatility changes. Meanwhile, the short call premium reflects both time decay and volatility sensitivity.
By evaluating these options, we prioritize combinations where the options Greeks balance the risk and potential returns while taking advantage of pricing inefficiencies and movements within the target stock price range of 2%. These strategies are tailored to minimize early assignment risk and optimize profitability over various time horizons.
Calendar Spread Option Strategy #2
Given the data from the options chains and the Greeks for New Fortress Energy Inc. (NFE), a calendar spread strategy is considered where we sell an in-the-money (ITM) put option at a near-term expiration date and buy a call option at a different expiration date. The goal is to maximize profit potential while minimizing the risk of assignment on the short put. Here are five promising calendar spread choices, ranging from short-term to long-term expiration dates.
Near-Term Strategy (1):
- Sell Put Option:
- Strike Price: $26.0
- Expiration Date: 2024-05-17
- Delta: 0.8684 (ITM but close to the money)
- Premium: $1.14
- ROI: 66.53%
-
Profit: $0.7584
-
Buy Call Option:
- Strike Price: $30.0
- Expiration Date: 2024-06-21
- Delta: -0.8608
- Premium: $1.65
- ROI: 53.74%
- Profit: $0.886704
This near-term strategy involves selling a high-delta put option one month from expiration and hedging it by buying a call option thats ITM by the next month.
Medium-Term Strategy (2):
- Sell Put Option:
- Strike Price: $27.0
- Expiration Date: 2024-06-21
- Delta: 0.5242 (at money)
- Premium: $1.85
- ROI: 100%
-
Profit: $1.85
-
Buy Call Option:
- Strike Price: $35.0
- Expiration Date: 2024-08-16
- Delta: -0.9346
- Premium: $7.1
- ROI: 61.51%
- Profit: $0.436704
For a medium-term position, selling a put with a delta close to 0.5 minimizes the risk of assignment, while the long call extends the potential for profit over a few months.
Intermediate Strategy (3):
- Sell Put Option:
- Strike Price: $25.0
- Expiration Date: 2024-06-21
- Delta: 0.7143 (slightly ITM)
- Premium: $1.75
- ROI: 100%
-
Profit: $1.75
-
Buy Call Option:
- Strike Price: $40.0
- Expiration Date: 2024-09-20
- Delta: -0.9952
- Premium: $7.1
- ROI: 76.57%
- Profit: $5.436704
This strategy allows holding a less risky short position against a deeply ITM call over the intermediate term.
Long-Term Strategy (4):
- Sell Put Option:
- Strike Price: $27.0
- Expiration Date: 2024-12-20
- Delta: 0.5865 (Arnold)
- Premium: $4.15
- ROI: 100%
-
Profit: $4.15
-
Buy Call Option:
- Strike Price: $45.0
- Expiration Date: 2024-12-20
- Delta: -0.9917
- Premium: $13.5
- ROI: 29.90%
- Profit: $4.036704
For a longer time horizon, a high-delta put helps reduce the risk of assignment while buying a less expensive call limits capital outlay but provides substantial leverage.
Ultra Long-Term Strategy (5):
- Sell Put Option:
- Strike Price: $25.0
- Expiration Date: 2024-09-20
- Delta: 0.6632 (at money)
- Premium: $3.5
- ROI: 60.53%
-
Profit: $2.1184
-
Buy Call Option:
- Strike Price: $40.0
- Expiration Date: 2024-12-20
- Delta: -0.9917
- Premium: $11.96
- ROI: 33.37%
- Profit: $3.136704
This ultra-long-term strategy offers the security of a delta-neutral approach on the short leg while giving substantial upside through the call option over the next several months.
In conclusion, these strategies demonstrate varying exposure to different expiration dates and strike prices, each calibrated to balance profit potential with risk management. For those looking for lower short-term risk, a near-term put closer to the money is recommended, whereas long-term traders can use high delta calls for potential long-term gains.
Similar Companies in Oil & Gas Midstream:
FLEX LNG Ltd. (FLNG), Coterra Energy Inc. (CTRA), Golar LNG Limited (GLNG), Excelerate Energy, Inc. (EE), Report: EQT Corporation (EQT), EQT Corporation (EQT), Cheniere Energy, Inc. (LNG), Tellurian Inc. (TELL), NextDecade Corporation (NEXT), Antero Resources Corporation (AR), Report: Southwestern Energy Company (SWN), Southwestern Energy Company (SWN), Cabot Oil & Gas Corporation (COG), Range Resources Corporation (RRC)
https://seekingalpha.com/article/4690003-lng-shipping-stocks-preparation-for-a-bullish-move
https://finance.yahoo.com/news/fortress-energy-inc-nfe-q1-123451128.html
https://finance.yahoo.com/news/fortress-produce-first-lng-mexico-145741341.html
https://finance.yahoo.com/news/1-fortress-delays-start-mexicos-170256571.html
https://finance.yahoo.com/news/fortress-energy-inc-nfe-q1-070754549.html
https://finance.yahoo.com/news/fortress-energy-first-quarter-2024-121740172.html
https://finance.yahoo.com/news/deutsche-bank-adjusts-fortress-energy-141305870.html
https://finance.yahoo.com/news/stifel-cuts-price-target-fortress-142950840.html
https://finance.yahoo.com/news/fortress-energy-inc-nasdaq-nfe-203313059.html
https://www.sec.gov/Archives/edgar/data/1749723/000174972324000052/nfe-20240331.htm
Copyright © 2024 Tiny Computers (email@tinycomputers.io)
Report ID: jkw7pg
Cost: $0.57339
https://reports.tinycomputers.io/NFE/NFE-2024-05-15.html Home