Northrop Grumman Corporation (ticker: NOC)
2024-02-03
 Northrop Grumman Corporation (NOC) is a leading global aerospace and defense technology company. It operates across multiple domains including air, cyberspace, land, and sea, providing a wide range of products and services. These include cutting-edge aerospace systems, advanced electronics, cybersecurity solutions, and information technology, catering to a diverse clientele that encompasses government and commercial customers worldwide. With a strong emphasis on innovation and technology, Northrop Grumman has been instrumental in developing high-profile defense platforms and technologies, ranging from stealth bombers and surveillance aircraft to missile defense systems and cybersecurity tools. The company's commitment to R&D significantly contributes to its ability to maintain a competitive edge in the ever-evolving defense sector. Financially, NOC has demonstrated robust performance, showcasing steady revenue growth and a solid order backlog, reflecting its strong market position and the ongoing global demand for defense and aerospace capabilities.
| Address | 2980 Fairview Park Drive | City | Falls Church | State | VA |
|---|---|---|---|---|---|
| Zip | 22042 | Country | United States | Phone | 703 280 2900 |
| Website | https://www.northropgrumman.com | Industry | Aerospace & Defense | Sector | Industrials |
| Full-time Employees | 101,000 | Previous Close | 446.22 | Open | 445.78 |
| Day Low | 441.5 | Day High | 447.685 | Volume | 1,616,356 |
| Market Cap | 67,003,076,608 | Fifty Two Week Low | 414.56 | Fifty Two Week High | 496.89 |
| Dividend Rate | 7.48 | Dividend Yield | 0.0167 | Payout Ratio | 0.5425 |
| Beta | 0.382 | Trailing PE | 33.01 | Forward PE | 16.17 |
| Total Cash | 3,108,999,936 | Total Debt | 16,048,000,000 | Total Revenue | 39,289,999,360 |
| Free Cash Flow | 1,632,499,968 | Operating Cash Flow | 3,875,000,064 | Revenue Growth | 0.06 |
| Gross Margins | 0.16673 | EBITDA Margins | 0.10137 | Operating Margins | -0.06411 |
| Return on Assets | 0.03661 | Return on Equity | 0.13658 | Current Price | 446.58 |
| Sharpe Ratio | -0.030322007347354372 | Sortino Ratio | -0.513429059625818 |
| Treynor Ratio | -0.021180072826281537 | Calmar Ratio | 0.09588428194886817 |
Analyzing the provided data on the stock (NOC) through the lens of technical analysis, fundamental analysis, and risk-adjusted performance measures, we can generate a comprehensive overview of potential future stock price movements. It's essential to consider the combination of technical indicators, company fundamentals, balance sheet strength, cash flows, analyst expectations, and risk-adjusted return measures to forecast market behavior.
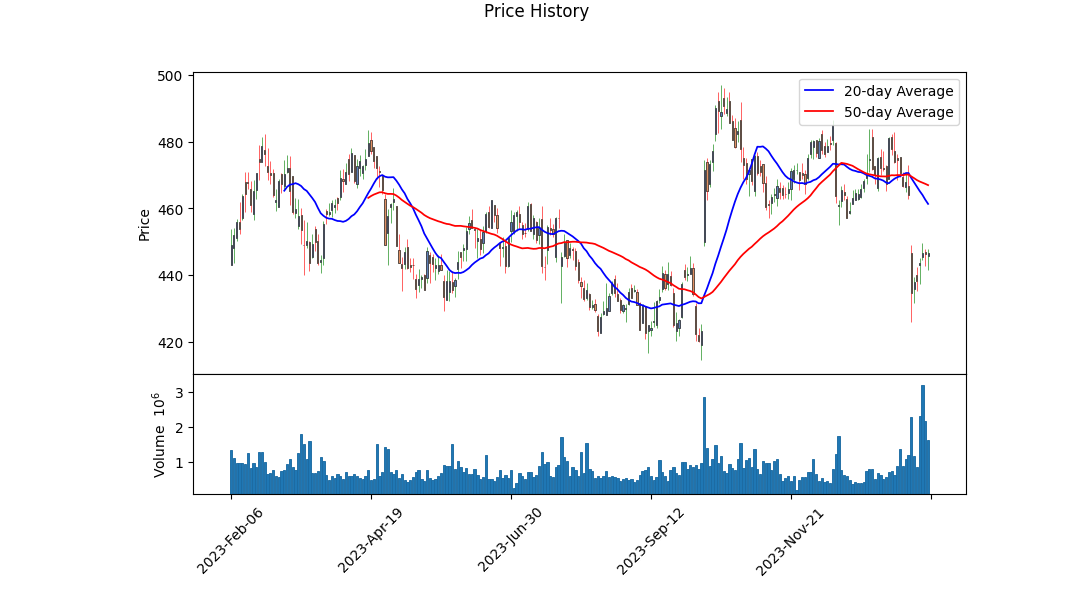
Beginning with technical indicators, the observed increase in opening prices leading up to a peak on the last observed date suggests a bullish trend. However, the MACD histogram's negative values towards the end of the period indicate a loss of momentum, potentially signaling a reversal or consolidation in the near future.
Fundamental analysis provides insights into the company's financial health and operational efficiency. The fundamentals indicate a company with strong revenue figures, a positive EBITDA, and increasing net income, all of which are positive signs. The trailing Peg ratio of 0.8881 suggests the stock may be reasonably valued given its growth expectations. However, the operating margin being negative highlights some operational inefficiencies that the company might be facing.
From the balance sheet data, the increase in net debt and the negative tangible book value can be areas of concern, highlighting the companys reliance on debt financing and possibly indicating a riskier financial structure. Yet, it's balanced by strong cash flows, indicated by positive free cash flow and operational cash flow, ensuring the company has liquidity to meet its short-term obligations and invest in growth opportunities.
The risk-adjusted performance measures, including negative Sharpe, Sortino, and Treynor ratios, illustrate that the stock has provided a negative risk-adjusted return over the past year, with the Calmar ratio being the only positive metric. This suggests that, although the stock might have faced significant downturns, its annualized return still exceeded the drawdown risks associated with it.
In combination with analyst expectations that demonstrate a positive outlook on earnings and revenue growth for the upcoming years, and considering the stocks upward trajectory in prices but bearing in mind the slow in momentum indicated by technicals, a cautious yet optimistic approach is advised. The anticipated earnings growth, coupled with the positive sales growth estimate, underscores the potential for value appreciation. The risk metrics, while pointing to recent underperformance relative to risk, should remind investors of the inherent volatility and the need for vigilant risk management.
Given these multifaceted analyses, it is reasonable to expect some price consolidation short-term as the market absorbs the mixed signals from technical indicators and fundamental strengths. However, the overall positive growth outlook, strong cash flows, and analyst sentiment suggest a potential upward trend in stock price over the next few months, barring any unforeseen market-wide downturns or negative company-specific developments. Investors should weigh the growth prospects against the operational and financial risks noted in the company's recent performance and market behavior.
In our analysis of Northrop Grumman Corporation (NOC) through the lens of Joel Greenblatt's principles in "The Little Book That Still Beats the Market," we have meticulously calculated the firm's Return on Capital (ROC) and its Earnings Yield, key metrics that underpin Greenblatt's stock selection strategy. Northrop Grumman Corporation demonstrates a Return on Capital (ROC) of 7.331946130281487%. This figure represents the efficiency with which the company converts its capital into profits, a critical indicator of its operational effectiveness and a determinant of its potential to generate wealth for shareholders over the long term. Additionally, Northrop Grumman boasts an Earnings Yield of 3.0386492901607776%, which is derived from the inverse of its current price-to-earnings ratio. This metric offers insight into the company's valuation, suggesting how much earnings a shareholder might expect for each dollar invested in Northrop Grumman's stock. Together, these figures serve as a foundational assessment of the company's financial health and its attractiveness as an investment through the strategic lens provided by Greenblatt's methodology.
Analyzing the financial performance of Northrop Grumman Corporation (NOC) in light of Benjamin Graham's investment principles involves comparing NOC's financial metrics with Graham's criteria. Given that we have a dataset detailing financial specifics of the corporation over several years, along with some compiled key metrics and Graham's investment principles, lets unpack this information.
Grahams Key Criteria:
- Margin of Safety: Purchase price sufficiently lower than intrinsic value to allow for error margin.
- Debt-to-Equity Ratio: Preferably low, indicating less financial risk.
- Current and Quick Ratios: High ratios suggest good liquidity.
- Earnings Growth: Consistent growth over time is favorable.
- Price-to-Earnings (P/E) Ratio: Low P/E is preferred.
- Dividend Record: A consistent and growing dividend is a positive.
- Price-to-Book (P/B) Ratio: Prefer stocks trading below book value.
Applying Criteria to NOC:
-
Margin of Safety: Not directly calculable from the provided data, as it requires the intrinsic value calculation, which depends on various factors including future earnings.
-
Debt-to-Equity Ratio: In one record, it's noted as 1.059, which is higher than Graham might have preferred. He recommended this ratio be below 1.0 ideally to ensure the company isn't overly reliant on debt, indicating some level of financial risk.
-
Current and Quick Ratios: Both mentioned as 1.147 in one instance, suggesting NOC can cover its short-term liabilities, which Graham would approve of, though he might look for a ratio closer to 2 for more significant liquidity.
-
Earnings Growth: Not explicitly detailed in the data dump, but the consistent dividends might suggest stable earnings underlying those payments.
-
P/E Ratio: Ranged around 15.07 at one point, which may be considered reasonable by Graham's standards, especially if below the industry average. However, Graham often sought stocks with a P/E ratio of 9 or 10.
-
Dividend Record: There's a consistent dividend history going back years, aligning well with Graham's preference for companies that reward shareholders with regular, ideally increasing, dividends.
-
P/B Ratio: Valued at 1.439 in a given year, slightly higher than Graham's ideal of stocks trading below their book value, yet not excessively overvalued.
Additional Observations and Recommendations:
-
Industry P/E Ratio: Not provided but crucial for context as Graham compared a company's P/E to its industry to assess relative valuation.
-
Financial Stability and Growth Projections: While the debt level is slightly higher than Graham would typically endorse, NOC shows positive liquidity signals (through its current and quick ratios) and a strong dividend record. The P/E and P/B ratios, though not perfectly aligning with Graham's strictest criteria, do not suggest excessive overvaluation.
Conclusion:
Northrop Grumman Corporation aligns with several of Benjamin Graham's investment principles, such as having good liquidity ratios, a strong dividend record, and not being excessively overpriced according to P/E and P/B ratios. However, its slightly higher debt-to-equity ratio and the lack of detailed earnings growth data may require further analysis. Graham might advise caution due to the debt level but could still consider NOC a viable investment if intrinsic value calculations and future earnings projections provide a sufficient margin of safety. Investors using Graham's methods would do well by conducting a deeper intrinsic value analysis and considering NOC in the context of their overall portfolio strategy and risk tolerance.
| Statistic Name | Statistic Value |
| Alpha | 0.0212 |
| Beta | 0.5956 |
| R-squared | 0.197 |
| Adj. R-squared | 0.196 |
| F-statistic | 307.0 |
| Prob (F-statistic) | 1.19e-61 |
| Log-Likelihood | -2363.5 |
| No. Observations | 1257 |
| AIC | 4731 |
| BIC | 4741 |
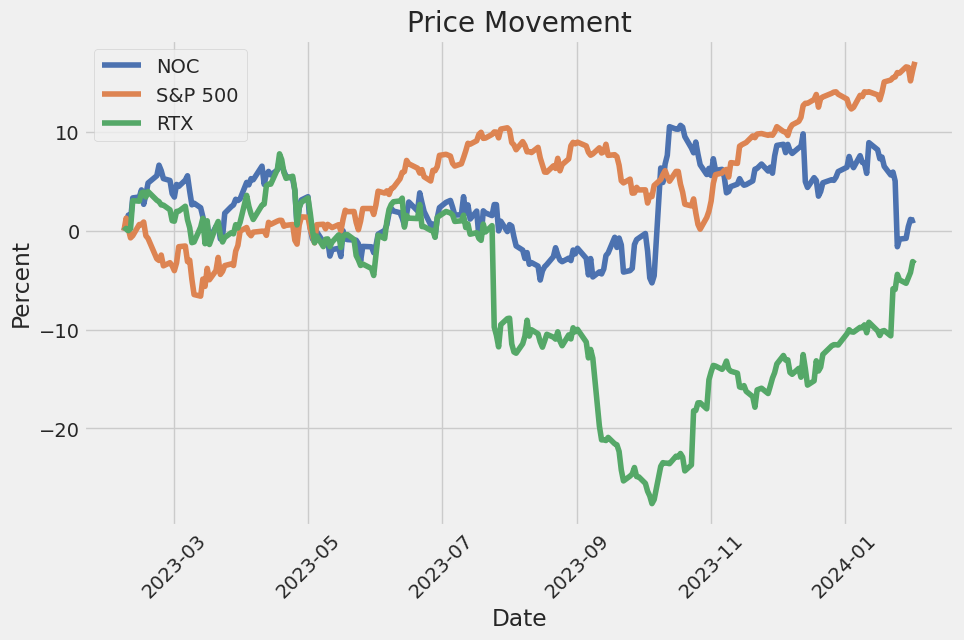
The linear regression model examining the relationship between NOC (Northrop Grumman Corporation) and SPY (a proxy for market performance) reveals a beta coefficient of approximately 0.5956. This figure indicates that NOC has a positive but less than one-to-one relationship with SPY. With every one percent increase in SPY, NOC is expected to increase by roughly 0.5956 percent, showcasing NOC's partial sensitivity to market movements. Furthermore, the alpha value of 0.0212 suggests that NOC has a slight ability to generate returns above the market average, independent of the market's movements. However, this alpha figure, while positive, is statistically not significant at the 0.636 level, implying that the excess returns could be attributed to random chance rather than systematic outperformance.
The model's R-squared value of 0.197 indicates that approximately 19.7% of NOC's price movement can be explained by movements in SPY, leaving a substantial portion of its price variation attributable to factors not captured by this model. This suggests that while there is some degree of market-related influence on NOC's performance, a significant amount of its price behavior is influenced by other variables, potentially specific to the company or the defense industry. While the linear regression provides insights into the relationship between NOC and SPY, it also highlights the complexity and multifaceted nature of stock price movements, where different factors, beyond market movements, play crucial roles in determining individual stock performance.
Northrop Grumman Corporation's Fourth Quarter and Year-End 2023 Conference Call, led by Vice President, Investor Relations, Todd Ernst, and featuring Chair, CEO, and President, Kathy Warden, provided a comprehensive overview of the company's performance in 2023 and its outlook for 2024 and beyond. Warden expressed gratitude towards the dedicated workforce of over 100,000, highlighting their role in delivering advanced technologies vital for global security. Notably, the company saw a revenue increase of over 7% in 2023, surpassing original guidance expectations. The record backlog exceeding $84 billion, alongside a book-to-bill ratio of 1.14 times, sets a solid foundation for continued growth. Despite taking a charge related to the B-21 program, Northrop Grumman maintains a strong financial position, with free cash flow at the high end of the guidance range and a comfortable exceedance of sales and EPS guidance ranges, absent the B-21 charge.
In 2023, Northrop Grumman made significant investments in R&D and CapEx, amounting to over $2.9 billion or 7.5% of sales, to propel innovation and expand capabilities. This has been complemented by returning over $2.6 billion to shareholders through dividends and share repurchases. Key developments in the portfolio include the successful role of GEM 63XL solid rocket boosters in ULAs Vulcan launch vehicle missions and the growing global demand for the company's weapons systems, further exemplified by the expected above-average growth in this sector due to international customer expansion.
The company's Mission Systems business unit has demonstrated exceptional demand strength, with a 2023 book-to-bill above 1.2 times, driven largely by restricted program growth. Advancements in microelectronics, sensors, processors, and secure communication are positioned to offer customers a technological edge. Furthermore, Northrop Grumman has actively contributed to the EMD phase of the Sentinel program, achieving significant milestones despite a Nunn-McCurdy Breach initiated by revised Air Force cost estimates primarily due to military construction and procurement estimates.
Looking towards 2024, Northrop Grumman projects a continuation of its growth trajectory, with an emphasis on technology differentiation, performance focus, and value delivery. The company plans to invest over 7% of sales in capital expenditures and R&D once again while expecting to increase share repurchases to at least $2 billion, showcasing robust financial health and strategic focus on generating shareholder value amidst evolving global security demands. The guidance for 2024 reflects confidence in the company's differentiated portfolio and strategic alignment with customer priorities, supported by solid organic sales growth and a potential for segment operating margin dollar growth in line with sales increases. The tackling of macroeconomic headwinds, implementation of productivity, and cost-saving initiatives, along with a future favorable mix shift, remain pivotal to the company's strategy for margin expansion and free cash flow growth.
d share repurchases. Our cash flow from operations is primarily driven by earnings and changes in working capital, which can fluctuate due to the timing of collections from our customers and payments to our suppliers and employees. Additionally, our cash flow is impacted by the timing and amount of pension contributions, capital expenditures, and other investing and financing activities.
In the third quarter of 2023, Northrop Grumman reported strong sales growth across its four operating segments, reflecting continued demand for its products and services. Sales increased by 9% compared to the same period in 2022, driven by higher sales volumes in Manned Aircraft at Aeronautics Systems, increased activity in Battle Management & Missile Systems at Defense Systems, higher restricted sales in the Networked Information Solutions business area of Mission Systems, and ramp-up on Space Systems development programs such as GBSD and NGI. Operating income grew by 20% over the prior year's quarter due to higher segment operating income, reduced unallocated corporate expense, and a lower FAS/CAS operating adjustment. The company also highlighted a noteworthy transaction in July 2023, where it sold its minority investment in an Australian business, resulting in a pre-tax gain of $97 million.
For the nine months ended September 30, 2023, sales were up by 8% year over year, showcasing the company's ability to capture increased demand and deliver on a broad range of programs. Despite various challenges, including macroeconomic factors such as inflation and supply chain disruptions, the company managed to maintain operational efficiency and financial performance, as evidenced by the increase in net earnings and diluted earnings per share in the third quarter of 2023.
Northrop Grumman continues to invest in strategic capabilities to ensure the company remains well-positioned to meet the current and future needs of its customers. These investments are supported by a solid liquidity position and a focus on maintaining financial flexibility to fund operations, capital expenditures, and return value to shareholders through dividends and share repurchases. Notably, the company's backlog of orders at the end of the third quarter stood at $83.9 billion, up 7% from the end of 2022, underscoring strong and sustained demand for its defense and aerospace solutions.
In conclusion, Northrop Grumman's financial results for the nine months ended September 30, 2023, demonstrate the company's operational resilience and its ability to capitalize on growth opportunities in a dynamic global security environment. The company's disciplined approach to managing its portfolio, combined with strategic investments in innovation and technology, positions it well to continue delivering value to its customers and shareholders alike.
Northrop Grumman Corporation, as a leading entity in the aerospace and defense sector, not only demonstrates its capability through securing significant contracts but also illustrates a keen foresight in aligning with emerging industry trends and geopolitical dynamics. Their diversified portfolio, encompassing cybersecurity solutions, autonomous systems, and space exploration, positions the company as a critical contributor to both national security and the future of space exploration.
The company's strategic advancements have been notably recognized in various analyses, including its involvement in the European defense market alongside industry giants like Lockheed Martin, Airbus SE, and BAE Systems. This is particularly evident in the context of rising geopolitical tensions and an anticipated increase in defense spending among NATO allies. The projection of military expenditures in response to global conflicts presents an opportunity for defense contractors to expand and innovate in their offerings.
The evolution of aerospace and defense technologies is accelerating, with a particular emphasis on space exploration and missile defense systems. Northrop Grumman's participation in lunar exploration initiatives highlights the broader race for technological advancement and geopolitical leverage in space. The development and successful launch of cargo missions to the International Space Station, in collaboration with SpaceX, underline the company's integral role in maintaining and advancing human presence in space.
Moreover, Northrop Grumman's investment in missile defense, as demonstrated by the accelerated development of the Next Generation Interceptor (NGI), is a testament to its commitment to enhancing national security. The early completion of the Preliminary Design Review (PDR) for the NGI indicates a proactive approach to addressing emerging threats and operational requirements. This initiative, along with the ongoing support for the U.S. Armys Integrated Battle Command System (IBCS), underscores Northrop Grumman's strategic position in developing cutting-edge defense solutions.
Financial performance remains a cornerstone of Northrop Grummans operations, with the company showcasing robust earnings and steady revenue growth. This financial stability enables ongoing investments in innovation and technology development, ensuring the company's competitive edge in a dynamic industry. The emphasis on shareholder value through dividends and share repurchase programs further indicates a long-term commitment to delivering financial returns.
Despite the overarching positive outlook, Northrop Grumman and the broader defense sector face challenges, including the potential fluctuations in defense budgets and the complexities of international market expansions. Yet, the company's strategic partnerships, rigorous focus on innovation, and adaptability to market dynamics prepare it well to navigate these uncertainties.
From a market positioning perspective, Northrop Grumman's role in prominent defense and space projects, such as the B-21 Raider and NASA's Artemis program, not only showcases its engineering and technological prowess but also signifies future growth avenues. The intersection of rising defense spending, geopolitical tensions, and the exploration and utilization of space sets a promising trajectory for Northrop Grumman Corporation.
Contributions to articles on Seeking Alpha and Yahoo Finance further elaborate on the strategic and financial assessments of Northrop Grumman, serving as valuable resources for stakeholders aiming for comprehensive insights into the companys market position, future growth prospects, and investment potential. The collective analysis through these articles presents Northrop Grumman as a formidable player in the aerospace and defense sector, capable of sustaining growth, navigating challenges, and capitalizing on the expanding horizon of national defense and space exploration.
The volatility of Northrop Grumman Corporation (NOC) between February 5, 2019, and February 2, 2024, can be summarized by its ARCH model results, revealing distinct characteristics. Firstly, the model suggests that past returns had a significant impact on future volatility, with an alpha coefficient of 0.2897, indicating a moderate level of impact. Secondly, the constant term (omega) in the volatility equation was estimated at 2.2088, suggesting a base level of volatility that could be expected regardless of past returns. Lastly, the statistical significance of these coefficients, marked by low p-values, underlines the reliability of the findings, indicating that the model's predictions are not based on random chance.
| Statistic Name | Statistic Value |
|---|---|
| Log-Likelihood | -2424.86 |
| AIC | 4853.71 |
| BIC | 4863.99 |
| omega | 2.2088 |
| alpha[1] | 0.2897 |
Analyzing the financial risk associated with a $10,000 investment in Northrop Grumman Corporation (NOC) over a one-year period requires sophisticated statistical and computational techniques to predict potential losses with a high degree of confidence. By incorporating volatility modeling and machine learning predictions, this analysis aims to quantify the investment's risk profile.
Volatility modeling serves as a critical tool in understanding Northrop Grumman Corporation's stock volatility. This approach employs historical price data to model the variability and rate at which the stock's price changes. In this context, volatility modeling is not just about capturing the average movements; it's about understanding the nature of price fluctuations over time, allowing for a much more nuanced risk assessment. Through the estimation of conditional variance, it provides crucial insights into periods of high uncertainty or financial turbulence that the stock may face, which is imperative for assessing the risk of an investment over a one-year period.
On the other hand, machine learning predictions are employed to forecast future returns of Northrop Grumman Corporation's stock. By analyzing historical data, machine learning algorithms, such as the one based on the concept of decision trees, learn the stock's behavior patterns and predict future price movements. This methodology is particularly effective because it can capture complex non-linear relationships that traditional financial models might miss, thereby offering a more dynamic and forward-looking perspective on the stock's potential performance.
The integration of volatility modeling and machine learning predictions provides a comprehensive framework for assessing the financial risk of investing in Northrop Grumman Corporation. Specifically, the calculated Annual Value at Risk (VaR) at a 95% confidence interval stands at $225.10 for a $10,000 investment. This figure represents the potential worst-case scenario loss over the next year, under normal market conditions, with a 5% chance of occurrence. It quantifies the investment's risk in monetary terms, offering investors a clear insight into what they might stand to lose and allowing them to make informed decisions based on their risk tolerance.
By combining the insights from volatility modeling with the forward-looking predictions provided by machine learning, investors can gain a nuanced understanding of the stock's volatility and expected future returns. This analysis, highlighted by the calculated VaR, demonstrates a sophisticated approach to quantifying financial risk, allowing for a comprehensive view of the potential downsides of equity investment in Northrop Grumman Corporation. This integration of methodologies showcases the effectiveness of using both historical volatility patterns and predictive analytics in formulating a robust risk assessment strategy.
Analyzing the given options chain for Northrop Grumman Corporation (NOC) and focusing on call options, we can deduce the profitability of options by taking into account various factors such as Delta, Gamma, Vega, premium, return on investment (ROI), and profit. In this context, the most profitable options would likely offer a high ROI and profit while considering the other Greeks to understand the risk and sensitivity of the option price to the market variables.
Starting off, the option with a delta of 0.754031, gamma of 0.009099, vega of 25.472247, a premium of 15.00, features an astonishing ROI of 1.927267 and a profit of 28.909. This option has a relatively high delta, indicating it has a strong correlation with the stock price movement. Its higher ROI reflects its potential for profitability given the trade works in favor of the predictiona 5% increase in NOC's stock price. The considerable gamma suggests flexibility but also implies potential for wider swings in delta, affecting the option's price sensitivity to the underlying stock price changes.
The option with a delta of 0.834437, gamma of 0.004042, and vega of 29.501757, priced at a premium of 43.00, has an impressive ROI of 0.718814 and a profit of 30.909. While the ROI is lower compared to the first mentioned option, this choice has a robust delta signaling a strong price move in the stock will significantly influence the option's price. The lower gamma compared to the option above means less sensitivity to the stock price movement which might be preferable for some traders looking for steadier performance without the abrupt changes in delta.
Another noteworthy option line item is the one with a delta of 0.811021, gamma of 0.004366, vega of 39.718052, with a premium of 39.50, boasting an ROI of 0.744532 and a profit of 29.409. This option is slightly lower in delta than the previous ones; however, it still suggests a considerable movement with the stock price. The ROI is attractive, being the second highest of the mentioned options, indicating significant potential for returns on investment.
While evaluating these options, it's crucial to consider the role of Vega - indicating the options sensitivity to volatility. The option with a delta of 0.867314, a somewhat negligible gamma of 0.000399, and the highest vega of 108.996873, boasting a return of 0.141261 and a profit of 30.809 at a premium of 218.10, may appeal to traders betting on an increase in NOC's stock volatility.
In summary, for traders targeting a 5% increase in the stock price of Northrop Grumman Corporation and considering profitability, the option with a premium of 15.00, demonstrating the highest ROI of 1.927267, is notably appealing for its high potential returns despite its medium level of risk as indicated by its delta and gamma. Traders should align their strategies with their risk appetite, considering both the potential returns (ROI and profit) and the sensitivities (Delta, Gamma, Vega) to make informed decisions. Risk management strategies should be employed to mitigate potential losses, particularly in options trading where market conditions can dramatically affect the outcome.
Similar Companies in Aerospace & Defense:
Raytheon Technologies Corporation (RTX), Report: General Dynamics Corporation (GD), General Dynamics Corporation (GD), The Boeing Company (BA), Report: L3Harris Technologies, Inc. (LHX), L3Harris Technologies, Inc. (LHX), Lockheed Martin Corporation (LMT), Huntington Ingalls Industries, Inc. (HII), Curtiss-Wright Corporation (CW), Hexcel Corporation (HXL)
https://seekingalpha.com/article/4662469-is-northrop-grummans-worthy-of-investment
https://www.youtube.com/watch?v=ogaJTKg4V8s
https://www.cnbc.com/2024/01/20/why-there-is-a-new-global-race-to-the-moon-.html
https://finance.yahoo.com/m/06b7025f-04fd-3b2f-a11a-c30529156218/why-defense-contractors-are.html
https://finance.yahoo.com/m/8a9fa59e-5596-3ff3-9b39-e3478dbd24d9/spacex-launches-northrop.html
https://finance.yahoo.com/news/northrop-grumman-20th-cargo-resupply-202800813.html
https://finance.yahoo.com/news/northrop-grumman-passes-preliminary-design-143000251.html
https://finance.yahoo.com/news/lockheeds-lmt-f-35-program-120400295.html
https://finance.yahoo.com/news/northrop-grumman-completes-first-production-143000725.html
https://finance.yahoo.com/news/boeing-ba-wins-modification-contract-132300828.html
https://finance.yahoo.com/news/11-best-american-defense-stocks-180949486.html
https://www.sec.gov/Archives/edgar/data/1133421/000113342123000053/noc-20230930.htm
Copyright © 2024 Tiny Computers (email@tinycomputers.io)
Report ID: 41OClh
Cost: $0.85522
https://reports.tinycomputers.io/NOC/NOC-2024-02-03.html Home