Northern Oil and Gas, Inc. (ticker: NOG)
2024-01-29
 Northern Oil and Gas, Inc. (ticker: NOG), an independent energy company, is engaged in the acquisition, exploration, development, and production of oil and natural gas properties in the United States. The company's primary focus is on the leasing and funding of oil and natural gas properties in the Williston Basin, which spans across North Dakota and Montana, and the Permian Basin, which covers West Texas and southeastern New Mexico. NOG operates with a non-operated business model, partnering with principal operators who are responsible for the day-to-day management of the drilling and production operations. This strategy allows NOG to maintain a diversified portfolio of oil and gas investments while minimizing overhead and operational responsibilities. The company's growth strategy includes acquiring high-quality assets with long-term production potential and providing consistent returns to its shareholders through regular dividend payments. Northern Oil and Gas, Inc. emphasizes cost-efficiency and effective capital deployment to sustain profitability even in varying market conditions, particularly within the volatile energy sector.

| Full Time Employees | 33 | Previous Close | 34.75 | Open | 34.82 |
| Day Low | 34.13 | Day High | 34.94 | Dividend Rate | 1.6 |
| Dividend Yield | 0.0459 | Payout Ratio | 0.1827 | Beta | 1.849 |
| Trailing PE | 4.580815 | Forward PE | 5.3879447 | Volume | 746,295 |
| Average Volume | 1,310,840 | Market Cap | 3,503,708,928 | 52 Week Low | 25.56 |
| 52 Week High | 43.64 | Price to Sales TTM | 2.117261 | Enterprise Value | 5,540,940,800 |
| Profit Margins | 0.41042 | Shares Outstanding | 100,508,000 | Shares Short | 9,212,841 |
| Held Percent Insiders | 0.07337 | Held Percent Institutions | 0.95585 | Short Ratio | 6.27 |
| Book Value | 15.166 | Price to Book | 2.2985625 | Net Income to Common | 667,406,976 |
| Trailing EPS | 7.61 | Forward EPS | 6.47 | Enterprise to Revenue | 3.348 |
| Enterprise to EBITDA | 4.521 | Total Cash | 12,952,000 | Total Cash Per Share | 0.129 |
| EBITDA | 1,225,606,016 | Total Debt | 2,057,358,976 | Quick Ratio | 0.625 |
| Current Ratio | 0.779 | Total Revenue | 1,654,830,976 | Debt to Equity | 146.141 |
| Revenue Per Share | 19.026 | Return on Assets | 0.15144 | Return on Equity | 0.64168 |
| Free Cash Flow | -1,029,115,648 | Operating Cash Flow | 1,128,338,048 | Revenue Growth | -0.042 |
| Gross Margins | 0.80786 | EBITDA Margins | 0.74061996 | Operating Margins | 0.10255 |
| Sharpe Ratio | -11.13214961175479 | Sortino Ratio | -177.2327107498348 |
| Treynor Ratio | 0.14779907025342204 | Calmar Ratio | 0.37771877006217763 |
Technical analysis and fundamental analysis each provide unique perspectives on the potential future movement of NOG's stock price. The technical indicators summarized for the last trading day show a positive trend. The MACD histogram values are increasing towards the positive axis, indicating a shift in momentum that could be perceived as bullish in the short-term. Additionally, the On-Balance Volume (OBV) has recently trended upward, implying increasing volume on days when the price finishes higher, another potentially bullish sign.
Looking at NOG's fundamentals, the company maintains robust gross margins (80.786%) and EBITDA margins (74.062%), suggesting significant efficiency in operations and profitability. However, operating margins are relatively lower at 10.255%, which may point to higher operating costs relative to revenue. The balance sheet, with a tangible book value of $745,260,000 and a high level of debt ($1,525,413,000), suggests that the company is leveraged, and the negative working capital indicates potential short-term liquidity challenges.
The summary of cash flows highlights concerns about the company's financial health. Negative free cash flow of -$431,358,000 signals that the company may not be generating enough cash to support its operations and investments. The frequent issuance and repayment of debt seen in the cash flows could be indicative of the company's attempts to optimize its capital structure and manage liquidity.
Negative risk-adjusted return ratios, such as the Sharpe Ratio (-11.132) and Sortino Ratio (-177.233), are indicative of a poor risk-adjusted performance over the past year. In contrast, the modest positive Treynor Ratio (0.148) and Calmar Ratio (0.378) suggest that the company has been able to provide some level of risk-adjusted returns in relation to the market's systemic risk and the downside volatility of the stock.
Analyst expectations, with an average EPS estimate for the next year at 6.47 and a projected revenue growth of 18.60%, show a positive outlook which could potentially reflect in the stock's performance, barring any unforeseen market conditions or company-specific events that could alter sentiment.
NOG's Alertman Z-Score of 1.158, indicative of potential financial distress, and a Piotroski Score of 4, which is a middle-of-the-road score in terms of financial health, suggest that the stock is a mixed bag when analyzed through the lens of financial stability. The stock has a market capitalization of $3,503,708,880 and revenues of $1,606,963,000, set against a backdrop of substantial total liabilities ($2,896,873,000).
Considering the amalgamation of technical indicators, solid fundamentals in terms of margins, and forward-looking analyst estimates juxtaposed to the concerning financial ratios and a leveraged balance sheet, the NOG stock price might experience increased volatility in the forthcoming months. The bullish signals from the recent technical patterns are tempered by the risk factors illuminated by the financial analysis. Investors should be prepared for both the potential of upward trends due to stable margins and positive earnings expectations, and the possibility of downside risks owing to the company's apparent financial strain and market uncertainty. It's worth noting that stock movements are also subject to broader market dynamics, including sector trends and macroeconomic factors, which can significantly affect the price performance of individual securities.
In our analysis of Northern Oil and Gas, Inc. (NOG) using principles from "The Little Book That Still Beats the Market," we've determined key financial metrics indicative of the company's performance. The Return on Capital (ROC), which measures the efficiency with which NOG converts its capital into profits, is an impressive 33.72%. This suggests that for every dollar of capital invested, NOG generates over 33 cents in profits, underscoring the company's proficiency in deploying its capital effectively to drive profitability. Additionally, the Earnings Yield, which is the inverse of the price-to-earnings ratio and represents the earnings generated per dollar of the market price, stands at a robust 26.56%. In simple terms, for every dollar invested in the stock at the current market price, NOG is expected to return approximately 26 cents in earnings. Both of these figures are comparatively high, pointing to a potentially undervalued company with efficient capital usage and attractive returns for investors, according to the investment philosophy detailed in the book by Joel Greenblatt. However, it's essential to consider these metrics in the context of the overall market, the specific industry conditions, and the individual risk tolerance of the client before making any investment decisions.
Based on the information provided, Northern Oil and Gas, Inc. (NOG) has indeed exhibited a consistent payment of dividends and a pattern of growth in dividend amounts over the examined period. Here is the breakdown based on the historical dividend data:
- On December 27, 2023, the dividend was $0.40.
- On September 27, 2023, the dividend was $0.38.
- On June 28, 2023, the dividend was $0.37.
- On March 29, 2023, the dividend was $0.34.
- On December 28, 2022, the dividend was $0.30.
- On September 28, 2022, the dividend was $0.25.
- On June 28, 2022, the dividend was $0.19.
- On March 29, 2022, the dividend was $0.14.
- On December 29, 2021, the dividend was $0.08.
- On September 29, 2021, the dividend was $0.045.
- On June 29, 2021, the dividend was $0.03.
The pattern here indicates that the dividends have not only been paid consistently every quarter but have also increased each time over the past two years. This increase in dividends can be an attractive feature for investors seeking income-generating stocks and a sign of a company's financial health and confidence in future earnings.
However, it should be noted that other factors provided, such as the negative price-to-earnings (P/E) ratio, suggest that the company has reported negative earnings, which could be a point of concern as it raises questions about its profitability. Furthermore, the debt-to-equity ratio is greater than 2, indicating the company has a higher level of debt relative to its equity, which might be perceived as a higher risk, depending on industry standards and the nature of its operations.
In keeping with Graham's principles, while the growth in dividends is positive, the negative P/E ratio and high debt-to-equity ratio warrant further investigation into the company's overall financial health, earnings stability, and industry conditions before making an investment decision. Remember, the margin of safety principle suggests being cautious and ensuring there's a buffer to protect against market fluctuations and any analytical errors. Consequently, before advising a client, it would be wise to conduct a comprehensive fundamental analysis considering all aspects of the company's financial stability and growth prospects.
| Statistic Name | Statistic Value |
| Alpha | 0.0464 |
| Beta | 1.3660 |
| R-squared | 0.160 |
| Adj. R-squared | 0.159 |
| F-statistic | 238.2 |
| Prob (F-statistic) | 2.45e-49 |
| Log-Likelihood | -3562.0 |
| No. Observations | 1,256 |
| AIC | 7,128 |
| BIC | 7,138 |
| Standard Error | 0.089 |
| Prob(Omnibus) | 0.000 |
| Skew | 0.529 |
| Kurtosis | 10.108 |
| Cond. No. | 1.32 |
Analyzing the linear regression model between NOG (Northern Oil and Gas, Inc.) and SPY (a proxy for the S&P 500, signifying the entire market), the focus is on the alpha value. Alpha, in this context, is a constant term that indicates the expected return on NOG when SPYs return is zero. An alpha of 0.0464 suggests that NOG could be expected to yield a 4.64% return independent of the markets performance. However, the alpha's statistical significance is not supported as indicated by a large p-value (P>|t| = 0.691), suggesting that this alpha may not be statistically different from zero.
Regarding the models explanatory power, the R-squared value of 0.160 implies that only 16% of the variability in NOGs returns is explained by the markets returns. This relatively low R-squared suggests that there are other factors outside of SPY's performance that impact NOGs returns. Moreover, the beta value of 1.3660 indicates that NOG has a tendency to move 1.3660 times the movement of the market. In other words, if SPY moves by 1%, NOG is expected to move by approximately 1.3660% in the same direction.
Executive Summary for Northern Oil and Gas, Inc. Q3 2023 Earnings Call
Introduction and Company Performance: During the earnings call, Evelyn Infurna, VP of Investor Relations, introduced key executives and outlined the agenda. CEO Nick OGrady summarized the third quarter with five key points:
-
Operational Excellence: The company experienced an operational acceleration, with production topping its guidance, improved oil cut, and reduced operating unit costs. Raised dividends were highlighted, marking the eleventh sequential increase.
-
Strategic Financial Position: NOG is in "harvest mode" with considerable free cash flow, signaling a potential record-setting fourth quarter. The importance of free cash flow as a tool for dynamic capital allocation was emphasized.
-
Growth and Investment Opportunities: NOG continues to capitalize on various scales of investment opportunities, including successful Ground Game activities and M&A processes. Such engagements have increased the range of potential deals.
-
Growing Scale and Strength: The narrative of growth since 2018 was reiterated, pointing out that scale has allowed NOG to lower its cost of capital and attract a broader investor base while improving asset quality.
-
Establishing Financial Flexibility: A recent equity capital raise of $290 million was positioned as a strategic move to de-risk future growth paths, providing flexibility regardless of macroeconomic shifts.
Operations and Development: President Adam Dirlam provided details on operations and business development. Key operational updates included:
- Record number of net wells turned online with a 64% QoQ increase.
- Organic and Ground Game assets performed solidly, with a balance of activity between Williston and Permian basins.
- Well performance excelled, particularly in the Mascot prospect area.
- Well in process hit an all-time high, foreshadowing strong 2024 activity.
- A surge in well proposals (AFEs) was observed, particularly in the Permian.
In business development, considerable activity with Ground Game transactions was reported, focusing on high-quality acquisitions expected to yield over 30% ROCE in 2023.
Financial Review and Guidance: CFO Chad Allen summarized financial outcomes:
- Record production levels reached with average daily production surpassing 100,000 Boe per day, and consistent growth in oil volumes.
- Adjusted EBITDA and free cash flow both rose significantly, with increased investment yet remaining steady despite market volatility.
- Both realized pricing for oil and gas and LOE (lease operating expense) outperformed expectations.
- As capital spent exceeded forecasts, the company revised its annual CapEx guidance to between $790-820 million.
Guidance for 2023 was adjusted based on anticipated completion timings, seasonal factors, plus a higher spud count. The company foreshadowed it's well-positioned for continued growth in 2024.
Q&A and Conclusion: The call concluded with a Q&A where executives, including Nick OGrady, addressed queries on topics ranging from the optimal company scale in light of economic shifts, balancing production growth with shareholder returns, the 2024 outlook, and the increasing opportunity set in M&A. The executive team gave insights into the impact of higher interest rates on M&A dynamics and the prospects of Ground Game activities, indicating a strong position amidst changing market conditions.
The final remarks by CEO Nick OGrady reiterated NOG's dedication to investor value growth through prudent business decisions and a strategic approach to opportunities and challenges ahead. The call ended with thanks to participants and an emphasis on the company's commitment to continued performance excellence.
Section of Report: Summary of SEC 10-Q Filing for Northern Oil and Gas, Inc. (NOG)
Northern Oil and Gas, Inc. (Northern or the Company), in its SEC Form 10-Q filing dated for the quarter ended September 30, 2023, details its financial position and results of operations. Revenue for the company is derived primarily from the sale of oil and natural gas, with contracts typically based on local indices and current month delivery volumes. Revenue recognition occurs when control of the product is transferred to the customer, with Northern operating predominantly in the Williston Basin, the Appalachian Basin, and the Permian Basin.
During the nine months ended September 30, 2023, Northern completed several significant acquisitions collectively referred to as the 2023 Bolt-on Acquisitions, which included the MPDC Acquisition, the Forge Acquisition, and the Novo Acquisition. The company also conducted numerous smaller transactions, leading to a substantive increase in revenue and income from operations attributable to these acquisitions when compared to the same period in the previous year. Subsequent to these transactions, Northern expensed transaction costs related to each acquisition.
Northern adheres to the full cost method of accounting for its oil and natural gas assets. Quarterly ceiling tests are conducted, but no impairment of proved oil and gas properties was recorded for the periods reported. Unproved properties are handled separately and may be reclassified as proved upon confirmation of reserves or impaired if deemed uneconomic. In the reporting period, Northern impaired certain unproved properties. Northern also owns unproved properties, participating in drilling activities on a 'heads up' basis and choosing whether to participate in each well as they are proposed. The company believes that most of its unproved costs will become subject to depletion within the next five years through development activities, impairments, or expirations.
Northern's long-term debt includes a Revolving Credit Facility, Senior Notes due 2028, Convertible Notes due 2029, and Senior Notes due 2031, with various maturity dates and interest rates. Throughout the period reported, the company engaged in transactions to repurchase portions of its outstanding Senior Notes due 2028 on the open market. The company remains in compliance with the covenants of its Revolving Credit Facility and maintains certain borrowing limits and financial ratios.
In conjunction with its Convertible Notes offering, Northern entered into Capped Call Transactions to reduce potential dilution upon conversion of notes and/or offset potential cash payments over a principal amount. The company made an initial payment to enter into these Capped Call Transactions.
For the quarter ended September 30, 2023, Northern has reported a net income of $26,111,000 and basic and diluted earnings per common share of $0.28, a significant decrease when compared to the net income and corresponding earnings per share in the same period of the previous year. The company has declared dividends on common stock, but no preferred dividends were declared or paid due to the absence of preferred shares as of September 30, 2023. The filing provides a detailed reconciliation of basic and diluted earnings per common share.
The cash flow provided by operations increased markedly in the reporting period, allowing the company to fund capital expenditures, acquisitions, and servicing of debt. Northerns cash position improved, but it remains subject to market fluctuations, operational risks associated with non-operated wells, and other external influences. Northern manages credit and market risks through various financial instruments and believes its exposure to customer credit risk is generally low.
Overall, the report filed by Northern Oil and Gas, Inc. describes a company engaged in strategic acquisitions to expand its business, managing its debt portfolio actively, and experiencing changes in revenue and income resulting from commodity price volatility and acquisition-related activities. The company's financial statements reflect the impact of recent acquisitions and the financing strategies employed to support its operational expansion.
Northern Oil & Gas, Inc. (NYSE: NOG), an independent energy company that specializes in the exploration, development, and production of oil and natural gas properties, has shown a commitment to delivering shareholder value through consistent dividend payouts. The focus is mainly on the Bakken and Three Forks formations in the Williston Basin of the U.S.
On December 26, 2023, it was reported that Northern Oil & Gas announced a dividend payment of $0.4 per share, which is set to be dispensed on January 31, 2024. This demonstrates the company's continued dedication to rewarding its shareholders since initiating consistent dividends in 2021, maintaining a quarterly payment schedule. The pending dividend, coupled with the positive investor sentiment it has generated, corroborates Northern Oil & Gas's history of financial prudence when it comes to returning profits to shareholders.
The company's financial health and dividend sustainability are underscored by several key indicators. A trailing 12-month dividend yield of 3.67% and a forward yield of approximately 4.23% suggests optimism for increased dividend flow to come. The payout ratio sitting comfortably at 0.18 as of September 30, 2023, indicates that the company is not overextending its earnings and is keeping ample reserves for reinvestment and stability against market fluctuations.
In regard to profitability, Northern Oil & Gas, rated with a profitability rank of 6 out of 10 by GuruFocus, shows a competent ability to generate earnings compared to industry counterparts. Growth metrics also tell a positive story, with the company's annual revenue growth rate, EPS growth rate over the past three years, and 5-year EBITDA growth rate outperforming a significant percentage of global competitors. These figures not only strengthen the case for the company's dividend stability but also enhance its appeal as an investment for those specifically seeking income-generating stocks.
Highlighting the company's prominence in the field, Aristotle Capital Boston, LLC, in its fourth-quarter investor letter, recommended the energy firm for its favorable stock performance, citing an 11.02% net return. Northern Oil and Gas's strategic non-operated working interests and its substantial proprietary well database were hailed for giving the company a flexible edge in making well-informed capital allocation decisions.
Nevertheless, while the investment firm sees value in NOG, it's important to note that the company, with a stock price of $35.63 per share as of January 11, 2024, did not feature among the 30 Most Popular Stocks Among Hedge Funds in the third quarter, according to information reported by Insider Monkey on January 12, 2024. Yet, there was a slight uptick in hedge fund ownership from the previous quarter, indicating some growing interest from institutional investors.
Northern Oil and Gas's operational efficiency, as reflected through a superior Return On Equity (ROE) of 48% compared to the industry average, signals its ability to effectively utilize shareholder equity. However, this high ROE should be contextualized with the company's debt-to-equity ratio of 1.46, a pointer to the significant leverage being used to drive returns.
While the company boasts financial prudence and satisfying returns for shareholders, concerns have been raised in an InvestorPlace article reported by Yahoo Finance on January 16, 2024. The analyst pointed out risks posed to the company by external market forces, such as the potential for declining crude oil prices, and internal challenges, like managing debt and capital expenditures. Despite Northern Oil & Gas's profitability, there is apprehension concerning the company's cash balance, which could affect its ability to generate free cash flow amid market headwinds.
As juxtaposed analyses present varying perspectives on Northern Oil & Gas, investors are encouraged to undertake a thorough assessment of their positions in the company while considering both the positive and negative factors that may influence NOG's mid to long-term value.
The detailed financial analysis, growth prospects, dividend sustainability, and market evaluation for Northern Oil & Gas, Inc. offered substantial consideration for investors. For more information on the company's dividend analysis, the article on GuruFocus provides a comprehensive view at Northern Oil & Gas Inc's Dividend Analysis. Additionally, insights into the company's stock performance and valuation can be gleaned through the analysis provided by Insider Monkey here. Investors may also review Simply Wall St's report on the company's ROE versus industry benchmarks here, while perspectives on market volatility and Northern Oil & Gas's financial preparedness are detailed in the InvestorPlace article featured on Yahoo Finance here.
Northern Oil and Gas, Inc. (NOG) exhibited financial market volatility, as indicated by an ARCH model applied to its asset returns from January 30, 2019, to January 26, 2024. The model suggests that the variability of NOG's returns could not be well explained by past squared returns, as evidenced by the low R-squared value. The key features of the volatility are captured by the parameters omega and alpha, which indicate the baseline volatility level and the impact of previous returns on future volatility, respectively.
| Statistic | Value |
|---|---|
| Mean Model | Zero Mean |
| Vol Model | ARCH |
| Log-Likelihood | -3,620.14 |
| AIC | 7,244.29 |
| BIC | 7,254.56 |
| No. Observations | 1,256 |
| omega | 15.5358 |
| alpha[1] | 0.2218 |
When assessing the financial risk of a $10,000 investment in Northern Oil and Gas, Inc. (NOG) over a one-year period, a combination of volatility modeling and machine learning predictions can be employed to gain insights into the stock's risk profile.
Volatility modeling, often used to estimate the extent of price fluctuations a stock may experience over time, serves as a quantitative tool for understanding the risk inherent in the price movements of NOG's stock. By fitting historical price data to this model, an analyst can generate predictions of the future volatility of the stock. These predictions are instrumental in calculating the Value at Risk (VaR), a statistical measure that estimates the maximum potential loss in value of an investment portfolio, with a given probability over a specified time period.
On the other hand, machine learning predictions leverage historical data to forecast future returns. Specifically, a tool such as a machine learning regressor can be utilized to predict stock performance based on a range of input features, such as historical prices, trading volumes, and relevant financial indicators. By training the model on historical data, it can recognize patterns and relationships within the data to make informed predictions about future stock performance.
Focusing on the VaR measure at a 95% confidence interval, volatility modeling allows for an estimate of how much the value of the $10,000 investment in NOG could decline in the worst 5% of cases. Based on the calculated VaR of $374.07, we infer that there is a 5% probability that the investment could lose more than $374.07 in value over the course of one year due to normal market fluctuations.
When machine learning predictions and volatility modeling are combined, they provide a dynamic assessment of stock performance and risk. Volatility modeling captures the uncertainty and the potential for price swings, while machine learning predictions incorporate a wider array of data to enhance forecast accuracy. By integrating these approaches, a more robust and comprehensive view of potential risks is developed, allowing an investor to better gauge the likelihood of adverse outcomes for their investment in Northern Oil and Gas, Inc.
Analyzing the results, especially in the context of the VaR, investors are provided with a quantifiable risk metric that encapsulates the potential downside exposure of their investment. This risk assessment can serve as an essential component of an overall investment strategy, particularly for those with a risk-averse profile or for those seeking to maintain tight control over their portfolio's risk exposure.
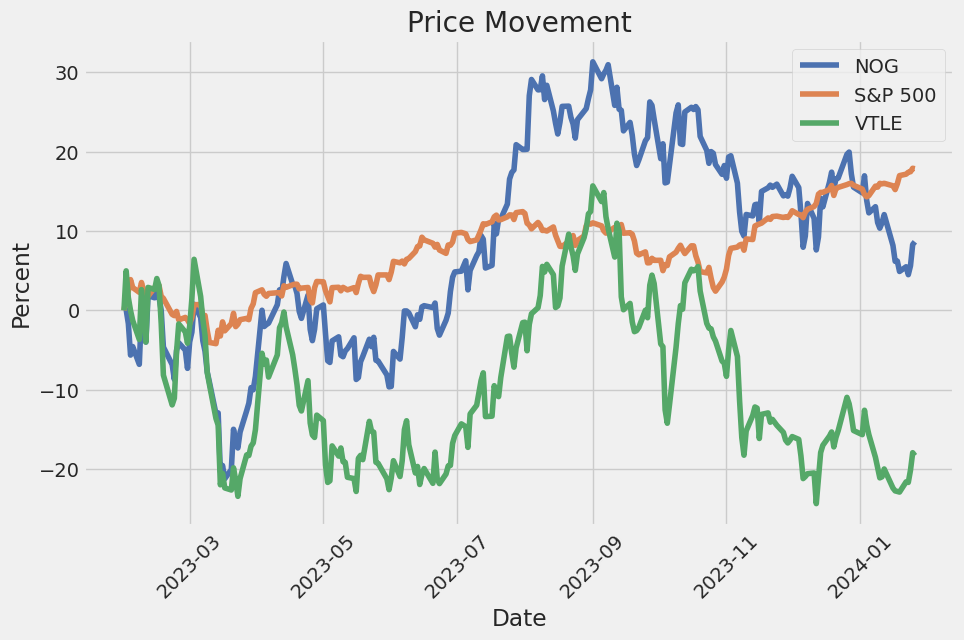
Similar Companies in Oil & Gas E&P:
Vital Energy, Inc. (VTLE), Comstock Resources, Inc. (CRK), Magnolia Oil & Gas Corporation (MGY), Obsidian Energy Ltd. (OBE), Matador Resources Company (MTDR), Murphy Oil Corporation (MUR), Civitas Resources, Inc. (CIVI), SilverBow Resources, Inc. (SBOW), Report: Chord Energy Corporation (CHRD), Chord Energy Corporation (CHRD), PDC Energy, Inc. (PDCE), Callon Petroleum Company (CPE), Permian Resources Corporation (PR), Antero Resources Corporation (AR), Epsilon Energy Ltd. (EPSN), VAALCO Energy, Inc. (EGY), PHX Minerals Inc. (PHX), EOG Resources, Inc. (EOG), Continental Resources, Inc. (CLR), Whiting Petroleum Corporation (WLL), Concho Resources Inc. (CXO), Pioneer Natural Resources Company (PXD), ConocoPhillips (COP), Report: Marathon Oil Corporation (MRO), Marathon Oil Corporation (MRO), Devon Energy Corporation (DVN), Hess Corporation (HES), Occidental Petroleum Corporation (OXY)
https://finance.yahoo.com/news/northern-oil-gas-incs-dividend-100756286.html
https://finance.yahoo.com/news/makes-northern-oil-gas-nog-075740032.html
https://finance.yahoo.com/news/northern-oil-gas-inc-nyse-104520313.html
https://finance.yahoo.com/news/3-energy-stocks-sell-january-205734006.html
https://www.sec.gov/Archives/edgar/data/1104485/000110448523000188/nog-20230930.htm
Copyright © 2024 Tiny Computers (email@tinycomputers.io)
Report ID: zdc2wf
Cost: $0.53853
https://reports.tinycomputers.io/NOG/NOG-2024-01-29.html Home