NOV Inc. (ticker: NOV)
2024-02-17
 NOV Inc. (ticker: NOV) is a prominent figure in the energy sector, known for its significant contribution to the oil and gas industry through the provision of equipment and components for drilling and production operations. Operating globally, NOV Inc. stands out for its innovation in technology and solutions that cater to the challenging demands of extracting energy resources. Its business segments cover a wide array of products and services, including the manufacture of rigs and equipment for land and offshore drilling operations, the production of machinery essential for oilfield services, and the delivery of comprehensive support through supply chain and digital solutions. With a history rooted in years of expertise and adaptation to evolving market needs, NOV Inc. has established a solid reputation for reliability, quality, and commitment to sustainability in its operations. Financially, the company navigates the cyclical nature of the oil and gas industry with strategic foresight, focusing on operational efficiency and growth opportunities to maximize shareholder value.
| Full Time Employees | 33,676 | Dividend Rate | 0.2 | Dividend Yield | 0.0116 |
|---|---|---|---|---|---|
| Payout Ratio | 0.08 | Five Year Average Dividend Yield | 1.25 | Beta | 1.777 |
| Trailing PE | 6.888 | Forward PE | 9.209 | Volume | 4,283,547 |
| Market Cap | 6,784,748,544 | Fifty Two Week Low | 14.05 | Fifty Two Week High | 23.29 |
| Price to Sales Trailing 12 Months | 0.7905 | Fifty Day Average | 19.3276 | Two Hundred Day Average | 18.7542 |
| Enterprise Value | 8,419,741,184 | Profit Margins | 0.11569 | Shares Outstanding | 394,004,000 |
| Shares Short | 11,930,355 | Held Percent Insiders | 0.765% | Held Percent Institutions | 96.278% |
| Book Value | 15.657 | Price to Book | 1.0998 | Net Income to Common | 993,000,000 |
| Trailing EPS | 2.5 | Forward EPS | 1.87 | Peg Ratio | 0.35 |
| Total Cash | 816,000,000 | Total Debt | 2,376,999,936 | Current Ratio | 2.398 |
| Total Revenue | 8,583,000,064 | Debt to Equity | 38.081 | Revenue Per Share | 21.84 |
| Return on Assets | 0.04095 | Return on Equity | 0.17317 | Free Cash Flow | -249,250,000 |
| Gross Margins | 0.21473 | Ebitda Margins | 0.11966 | Operating Margins | 0.09048 |
| Sharpe Ratio | -0.4977686815695688 | Sortino Ratio | -7.48830348219474 |
| Treynor Ratio | -0.19122148718918533 | Calmar Ratio | -0.5034483646179174 |
Analyzing the data for NOV presents an intricate picture of its potential future stock price movements. Through the lens of technical indicators and a deep dive into the financials, fundamentals, risk-assessed performance metrics, and analyst expectations, a comprehensive forecast can be developed.
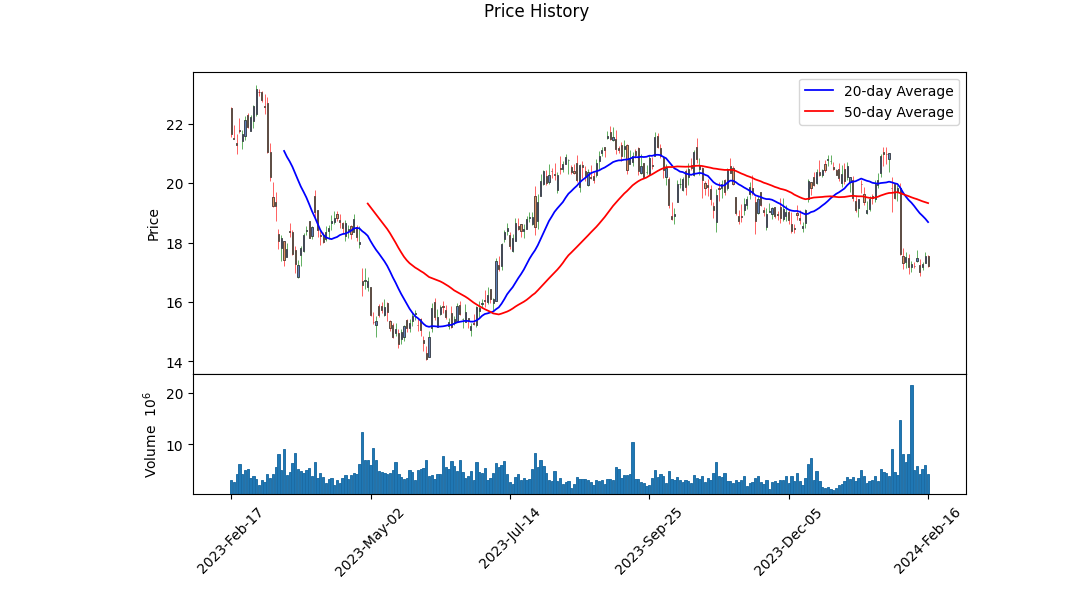
The technical indicators from the last trading day suggest a downtrend, as evidenced by a declining On-Balance Volume (OBV) and a yet-to-improve MACD histogram. A reversing OBV signals decreasing volume behind price movements, which generally precedes further down movements in price, while an improving but still negative MACD histogram indicates that the downtrend is losing momentum but has not yet reversed.
The risk-adjusted performance metrics, including a negative Sharpe, Sortino, Treynor, and Calmar ratios, paint a picture of a stock that has experienced returns below the risk-free rate, instead offering a performance that has not compensated the investors enough for the volatility or drawdown risks borne. This could deter investment until a stabilization or reversal in these metrics is visible.
The fundamentals suggest a company with solid revenue figures but concerning cash flow movement, notably a decrease in the Free Cash Flow and a substantial net debt position. However, the earning estimates and revenue projections for the next year depict an optimistic view from analysts, potentially indicating expected improvements in operational efficiency or market expansion.
The balance sheet demonstrates strength in tangible book value over time, indicating a stable to growing intrinsic value of the companys tangible assets. An increase in net debt is a concern but is seemingly well-managed given the context of the company's overall assets.
In conclusion, the short to medium-term outlook for NOV might lean towards caution due to the technical downtrend and the negative risk-adjusted performance metrics. Nonetheless, the solid fundamentals, alongside positive future earnings and growth expectations, could entice a more bullish outlook for long-term investors. Short-term traders might remain hesitant until technical indicators suggest a clear reversal of the current downtrend. In contrast, long-term investors might focus more on the company's fundamental strength and industry position, alongside the knowledge that market sentiment and technical indicators can shift, potentially aligning more closely with fundamental assessments over time.
In assessing NOV Inc. (NOV) through the lens of "The Little Book That Still Beats the Market," we've meticulously calculated key financial metrics critical for investment decisions. Firstly, the Return on Capital (ROC) for NOV Inc. stands at 7.35%. This figure offers insight into the efficiency and profitability with which NOV utilizes its capital to generate earnings. An ROC at this level suggests that NOV Inc. is deploying its capital reasonably well to produce value, though investors may compare this figure against industry benchmarks for a more nuanced evaluation. Secondly, the Earnings Yield of NOV Inc. has been calculated to be 14.69%. Earnings yield, which is derived by inverting the Price/Earnings ratio, gauges the earnings generated per dollar invested in the stock. A higher earnings yield indicates a potentially undervalued stock or a strong earnings generation capability relative to the share price. In the case of NOV Inc., a 14.69% earnings yield is particularly compelling, providing a robust case for investment from a value perspective. This high earnings yield may attract investors seeking income or those aiming for substantial long-term value in the energy sector. Together, these metrics encapsulate NOV Inc.'s current financial health and operational effectiveness, offering a concrete basis upon which investment decisions can be informed.
In evaluating NOV Inc. (NOV) through the lens of Benjamin Graham's investment principles, we can assess the company's attractiveness as a potential investment. Graham's approach emphasizes a disciplined, fundamental analysis of a company's financial health, growth prospects, and market valuation. Here, we consider several key metrics for NOV Inc. in relation to Graham's criteria:
-
Price-to-Earnings (P/E) Ratio: NOV Inc. has a P/E ratio of 22.46. Graham typically advocated for investing in companies with low P/E ratios, as this could indicate that the stock is undervalued. However, without the industry average P/E ratio provided for comparison, it's difficult to definitively say how NOV stands relative to its peers. Generally, a P/E ratio significantly lower than the industry average might meet Graham's criteria, whereas NOV Inc.'s P/E ratio suggests a valuation that may not offer a substantial margin of safety on its own.
-
Price-to-Book (P/B) Ratio: With a P/B ratio of 0.6007, NOV Inc. is trading below its book value, which aligns well with Grahams preference for stocks trading below their book value. This low P/B ratio may indicate that the stock is undervalued, potentially offering an attractive margin of safety for investors.
-
Debt-to-Equity Ratio: The debt-to-equity ratio of 0.385 indicates a moderate level of financial leverage. Graham preferred companies with low debt levels as they are generally considered to have lower financial risk. NOV Inc.'s debt-to-equity ratio suggests a balance between leveraging opportunities for growth and maintaining financial stability, which is consistent with Grahams principles.
-
Current and Quick Ratios: Both the current and quick ratios for NOV Inc. are 2.398, indicative of the company's strong ability to cover its short-term liabilities with its short-term assets. This high level of liquidity exceeds Graham's requirements, suggesting financial health and operational stability.
-
Earnings Growth: While specific earnings growth data for NOV Inc. are not provided in this analysis, Graham would look for consistent earnings growth over several years as a sign of a stable and potentially undervalued investment.
In summary, NOV Inc. presents a mixed picture from the perspective of Benjamin Graham's investment criteria. The company's low P/B ratio and strong liquidity ratios (current and quick ratios) align closely with Graham's fundamentals, suggesting a level of financial stability and potential undervaluation that would be attractive to value investors. However, the P/E ratio, though lacking industry comparison, seems relatively high, which might not align with the strictest interpretation of Grahams criteria for a margin of safety. The moderate debt-to-equity ratio, while not exceptionally low, does not raise immediate concerns for financial stability.
Given these observations, investors who adhere to Graham's principles may find NOV Inc. attractive primarily due to its P/B ratio and liquidity but would do well to further investigate the company's earnings growth and compare the P/E ratio to industry averages for a complete assessment.Given the extensive list of financial data provided for various dates and fiscal periods, a thorough analysis of this data would require specific financial metrics or questions to be addressed. However, I'll guide you through an example of how to approach this kind of data for financial analysis, specifically focusing on key financial statements such as the Balance Sheet, Income Statement, and Cash Flow Statement.
Balance Sheet Analysis
-
Assets: For each period, examine total assets to determine the company's resources. Look for significant increases or decreases in categories such as cash and cash equivalents, receivables, inventory, and property, plant, and equipment. This analysis could point out liquidity changes or investment in growth.
-
Liabilities and Equity: Assess total liabilities to understand the company's obligations. Pay special attention to accounts payable, accrued liabilities, and long-term debt. Review the equity section to see how retained earnings and comprehensive income/loss have changed, indicating profitability and investor cash infusion through additional paid-in capital or drawdowns.
Income Statement Analysis
-
Revenue: Track revenue trends to identify growth or contraction in the company's core business operations. Comparing revenue with cost of goods sold can give insights into gross margin trends.
-
Expenses and Net Income: Analyze operating expenses, interest expenses, and taxes to evaluate the company's cost management. Net income will highlight the bottom-line profitability.
Cash Flow Statement
-
Operating Activities: Look at cash flows from operating activities to gauge the company's ability to generate cash from its core operations, which is crucial for long-term sustainability.
-
Investing and Financing Activities: Cash flows from investing activities can indicate the company's investment in growth, while financing activities will show how the company raises money (issuing debt/equity) and returns value to shareholders (dividends, stock buybacks).
Key Financial Ratios
-
Liquidity Ratios: Use current assets and current liabilities to calculate the current ratio and quick ratio, assessing the company's ability to meet short-term obligations.
-
Solvency Ratios: Debt-to-Equity and Interest Coverage Ratios could indicate how comfortably the company can manage and service its debt.
-
Profitability Ratios: Gross Margin, Operating Margin, Net Margin, Return on Assets (ROA), and Return on Equity (ROE) are essential to understanding how efficiently the company generates profit.
-
Efficiency Ratios: Inventory Turnover, Receivables Turnover, and Asset Turnover ratios will help assess how effectively the company uses its assets to generate revenue.
Example Summary
Given the data, a comprehensive financial analysis report should start with an executive summary highlighting key findings such as growth trends, profitability, liquidity, and capital structure changes. It should then delve into detailed analyses supported by charts and tables for visual aids. Lastly, it should address any risks or opportunities identified during the analysis and offer actionable recommendations based on the company's financial health and market position.Based on the comprehensive dividend history provided, we can analyze the dividend record for the company symbolized as 'NOV'. The dataset illustrates a detailed chronological record of dividend payments, adjustments, and important dates such as record, payment, and declaration dates from the year 2009 through projections into 2024.
Consistency Analysis:
A key highlight from the data is the consistency in dividend payments over the years. From 2010 through a portion of 2016, the dividends were gradually increasing, starting from $0.1 per share and reaching an adjusted dividend of $0.46 by 2016. This period indicates a stable and growing dividend, aligning with Benjamin Graham's preference for companies with a consistent and improving dividend record.
Adjustments in Dividends:
However, a significant adjustment occurs in March 2016, where the adjusted dividend spikes to $0.46 from a previous lower value before resuming at a new lower rate of $0.05 from June 2016 onwards until the projected dividends in 2024. This sharp adjustment reflects a likely strategic shift or a response to external business or economic conditions impacting the company's dividend policy.
Stability Post-adjustment:
Post-adjustment, from mid-2016 through to the forecasted dividends in 2024, the company exhibits stable and consistent dividend payments of $0.05. This steady-state reflects positively on the company's commitment to maintaining dividends, which is a crucial factor for income-focused investors, again corresponding with Graham's criteria for selecting investments.
Conclusion:
Assessing the dividend record from the lens of Benjamin Graham's investment principles, NOV demonstrates notable qualities of dividend consistency and stability, especially notable after the adjustment phase in 2016. While the reduction in dividend amount could initially be a concern for yield-seeking investors, the predictability and subsequent stability in payments underscore a conservative yet reliable dividend policy - a characteristic valued in Graham's philosophy for defensive investing.
This long-term assessment suggests that while NOV adjusted its dividend policy in response to certain challenges, it has maintained a consistent dividend payout thereafter. Investors valuing steady income over high yield fluctuations might find NOV aligning with the criteria of a defensively sound investment, at least from a dividend record perspective.
| Statistic Name | Statistic Value |
| R-squared | 0.236 |
| Adj. R-squared | 0.235 |
| F-statistic | 387.7 |
| Prob (F-statistic) | 2.00e-75 |
| No. Observations | 1,258 |
| AIC | 6,441 |
| BIC | 6,452 |
| Const Coef | -0.0554 |
| Beta | 1.3186 |
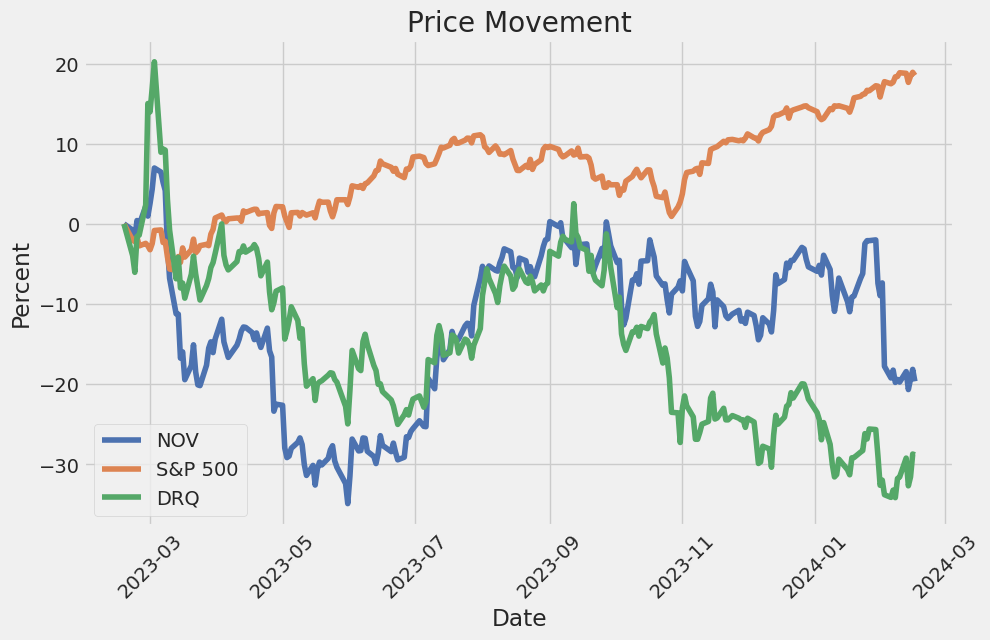
Through the analysis of the linear regression model between NOV (an energy sector stock) and SPY (an ETF representing the broader market), we observe that there exists a moderately positive relationship, suggested by the beta coefficient of 1.3186. This coefficient implies that for every unit increase in SPY, we can expect NOV to increase by approximately 1.3186 units, holding other factors constant. However, the relatively low R-squared value of 0.236 indicates that only about 23.6% of the variability in NOV's returns can be explained by changes in the broader market (SPY). This signifies that while there is a correlation, a significant portion of NOV's price movements are influenced by factors that are not captured by SPY's movements.
Focusing on alpha, calculated to be approximately -0.0554, we understand it as the intercept of the regression model, representing the expected return on NOV when the SPY return is zero. In practical terms, alpha indicates NOVs performance relative to the market baseline set by SPY. A negative alpha suggests that NOV underperforms the market when the broader markets return is neutral. This could be of interest to investors looking to evaluate NOV's performance independently of market movements. It's crucial for investors to consider both alpha and beta in the context of their portfolio strategies, as alpha offers insight into the stocks intrinsic value relative to market performance, and beta provides information on its volatility in relation to the market.
NOV Inc., a leading provider of technology and equipment to the oil and gas industry, reported its fourth quarter and full-year earnings for 2023, exhibiting strong performance and strategic advancements in technology. In the fourth quarter of 2023, NOV announced revenues of $2.34 billion with a net income of $598 million, or $1.51 per fully diluted share. The full-year revenue stood at $8.58 billion with a net income of $993 million, reflecting a significant growth in sales driven by robust offshore and international demand, improvements in the supply chain, and the introduction of new technologies to customers. This growth indicates NOV's ability to adapt and excel in a challenging market, enhancing its profitability and competitive edge.
Clay Williams, Chairman, President, and CEO of NOV, highlighted the company's year-over-year revenue increase of 19% from 2022, primarily fueled by strong offshore and international market performance. The fourth quarter saw EBITDA rise to $294 million, or 12.5% of revenue, demonstrating a modest improvement in profitability despite activity declines in North America and unexpected charges. Williams attributed the overall success to NOV's international land revenues, which grew by more than 20% sequentially, showcasing the company's expertise in navigating global market dynamics and leveraging opportunities in emerging markets. Furthermore, NOV's significant improvements in free cash flow to $301 million in the fourth quarter signaled a relief from supply chain challenges, an essential factor for sustained growth and investor confidence.
NOV's strategic focus in 2023 revolved around continuing momentum in offshore and international markets, underpinning a steady up-cycle anticipated to unfold over the next several years. Despite North America's subdued outlook due to consolidation and capital discipline among operators, NOV expects growth in offshore international markets to offset declines in North American activity. The company has invested in technologies that provide solutions to improve economics for customers, including robotics and digital advancements. NOV's commitment to innovation was evident in the adoption of its artificial intelligence edge compute technology and high-speed data services, enabling better decision-making and efficiency in drilling operations.
Looking ahead, NOV remains optimistic about its position to capitalize on the global energy investment landscape, with plans to divest one or two businesses and redeploy capital into higher-performing opportunities. The company's focus on improving profitability, return profile, and cost reduction plans demonstrates a proactive approach to navigating the evolving energy sector. NOV's continued investment in new products and technologies highlights a strategic vision geared towards embracing future energy demands, leveraging digital transformation, and enhancing traditional product portfolios to support sustainable growth and shareholder value.
The SEC 10-Q filing for NOV Inc. (NOV) dated September 30, 2023, provides a comprehensive overview of the company's financial performance, operating environment, results of operations, and outlook. NOV, a leading independent equipment and technology provider to the global energy industry, operates under three segments: Wellbore Technologies, Completion & Production Solutions, and Rig Technologies. The document highlights NOV's financial results, critical accounting policies, and estimates alongside an executive summary reflecting on the company's strategic direction and operational efficiencies.
For the third quarter ended September 30, 2023, NOV reported revenues of $2.19 billion, a 16% increase compared to the same quarter in the previous year, and a 4% increase sequentially. Net income for the quarter was $114 million, comprising 5.2% of sales, including $7 million of Other Items. Adjusted EBITDA rose to $267 million, equivalent to 12.2% of sales, showcasing the company's operational strengths and efficiency in managing costs.
The report provides detailed insights into the performance of NOV's operating segments. Wellbore Technologies observed an 8% increase in revenue year-over-year to $799 million, with operating profit increasing to $123 million. Completion & Production Solutions experienced a 12% revenue increase to $760 million, with operating profit at $47 million. Rig Technologies reported a significant 34% revenue increase to $686 million, with operating profit at $86 million. These figures underscore NOV's robust performance across its diversified portfolio, driven by improved execution, aftermarket operations, and international and offshore market improvements.
A strategic development announced within the report includes NOV's decision to consolidate its operational structure into two segments, Energy Equipment and Energy Products and Services, effective January 1, 2024. This realignment is part of NOV's ongoing cost reduction initiatives, signifying the company's proactive approach to enhancing operational efficiencies and financial performance.
The outlook section discusses the global oil and gas equipment and services market, emphasizing the industry's early stages of extended recovery post the COVID-19 global economic reopening. Despite potential near-term market volatility due to tightening fiscal policies and inflationary pressures, NOV remains optimistic about the sustained demand for its innovative products and services, driven by global energy security risks and diminished production capacity.
Additionally, the document details critical industry indicators, including rig counts and oil prices, providing context for NOV's operating environment. It also outlines NOV's commitment to energy transition-related opportunities, highlighting the company's involvement in projects related to wind energy, geothermal power, and carbon sequestration, among others. NOV's strategic focus on developing solutions to support the energy transition underscores its adaptability and long-term vision to meet evolving energy market demands.
In summary, NOV Inc.'s 10-Q filing for September 30, 2023, illustrates the company's financial resilience, strategic operational adjustments, and optimistic outlook amidst a recovering global energy market. NOV's commitment to operational efficiency, innovation, and energy transition-related projects positions it well for sustained growth and leadership in the energy sector.
NOV Inc., a pioneering force within the global energy sector, has recently taken significant strides in enhancing its leadership and operational strategy, alongside notable financial achievements that draw investor attention. The company's endeavors, ranging from executive appointments to financial performance and strategic investments, underscore its commitment to maintaining a leading position in an evolving industry.
On January 17, 2024, NOV Inc. made a noteworthy announcement about the appointment of Patricia B. "Patti" Melcher to its Board of Directors. Melcher, with an impressive career spanning over 35 years in the energy and investment spheres, is expected to provide valuable insights and guidance to NOV Inc. Her extensive experience, including roles at EIV Capital and Allegro Capital Management, along with her academic credentials from the University of Virginia and Harvard University, positions her as a key asset in steering NOV towards sustainable growth and innovation.
This strategic move brings the total number of directors on NOV's board to nine, with a strong emphasis on independent oversight. Clay Williams, NOV's Chairman, President, and Chief Executive Officer, has expressed confidence in Melcher's ability to significantly contribute to the company's governance, capital allocation, and innovation efforts, which are critical for enhancing shareholder value.
Ahead of its earnings release for the quarter ended December 2023, NOV Inc. was anticipated to report a promising financial outlook, with expectations of earnings per share (EPS) growth and a revenue increase compared to the same quarter in the previous year. However, a downward revision in the EPS estimate and a negative Earnings ESP indicated potential challenges in surpassing consensus EPS expectations. Despite historical performances that exceeded analysts' predictions, the mixed signals suggested that investors should approach with caution.
Contrastingly, the earnings report dated February 1, 2024, painted a brighter picture. NOV Inc. reported a substantial year-over-year increase in both its fourth-quarter earnings and the full-year revenue for 2023. The significant leap in net income, propelled by the release of valuation allowances on deferred tax assets, along with an uptick in Adjusted EBITDA, highlighted the company's robust performance and improved profitability across its operating segments.
CEO Clay Williams underscored this financial triumph as a momentous year for NOV, driven by increased customer interest in new products and technology, momentum in international and offshore markets, and improved inventory levels. Despite geopolitical and economic uncertainties, he remained optimistic about the oil and gas markets' recovery, supported by the global demand for secure and low-cost energy sources.
In detailed financial analyses, NOV revealed its prowess across different business segments, showcasing revenue growth and operational efficiency. The Wellbore Technologies, Completion & Production Solutions, and Rig Technologies segments all reported positive outcomes, reflecting NOV's strategic competence in navigating market dynamics.
Additionally, the company's investment in CO2 dehydration packages for carbon capture and storage projects, among other technological and service market acquisitions, illustrates its proactive approach to consolidating its industry leadership.
Following the disclosure of its annual results on February 4, 2024, NOV Inc. witnessed a reevaluation of financial forecasts by analysts. While revenues were projected to experience a slight increase in 2024, EPS estimates saw a downward revision, highlighting a cautious outlook on the company's profitability. Despite this, the consensus price target for NOV's stock remained stable, indicating an underlying confidence in the company's long-term valuation.
Investment firms like Pzena Investment Management and First Eagle Investment Management have also made notable adjustments to their stakes in NOV Inc., emphasizing the ongoing relevance of the oil and gas sector and the strategic significance of NOV within their investment portfolios. These movements highlight differing perspectives and strategies among leading investors in response to the company's performance and market conditions.
NOV Inc. was also recognized as one of the 20 Fastest Growing Energy Companies in the United States, as per a report published on February 14, 2024. This acknowledgment reflects NOV's impressive revenue growth and its pivotal role in the industry's shift towards more sustainable energy sources. The company's ability to adapt and innovate remains central to its success in a rapidly changing energy landscape.
Further solidifying its commitment to shareholder value, NOV declared a regular quarterly cash dividend on February 15, 2024. This reflects the company's stable financial management and its strategic balance of rewarding shareholders while investing in technological advancements critical for the future of energy production.
As NOV Inc. continues to navigate the complexities of the global energy sector, its strategic decisions, from leadership enhancements to financial management and operational investments, underscore a resilient and forward-looking approach. The company's ability to adapt and thrive amid industry shifts positions it as a key player in the journey towards a more sustainable and efficient energy future.
NOV Inc. (NOV) experienced significant volatility from February 19, 2019, to February 16, 2024, as evidenced by the ARCH model analysis. The ARCH model, which focuses exclusively on modeling the volatility of the asset returns without accounting for its mean, indicates that volatility was notably high, with an omega parameter of approximately 9.16. This suggests that the asset's returns are highly unpredictable and exhibit large variations over the analyzed period. Furthermore, the model includes a significant alpha parameter, pointing to a substantial reaction of volatility to past squared returns, which accentuates the asset's susceptibility to rapid changes in volatility levels.
| Statistic Name | Statistic Value |
|---|---|
| R-squared | 0.000 |
| Adj. R-squared | 0.001 |
| Log-Likelihood | -3318.30 |
| AIC | 6640.60 |
| BIC | 6650.88 |
| No. Observations | 1258 |
| Df Residuals | 1258 |
| omega | 9.1585 |
| alpha[1] | 0.2699 |
When analyzing the financial risk associated with a $10,000 investment in NOV Inc. (NOV) over a twelve-month horizon, an intricate approach involving volatility modeling and machine learning predictions is adopted. This dual-methods framework allows for a robust assessment of equity investment risks, leveraging the strengths of each method to capture nuanced aspects of market behavior and asset performance potential.
Volatility modeling plays a crucial role in quantifying the inherent uncertainty and price fluctuation of NOV Inc.'s stock. This approach is particularly adept at examining historical price movements to forecast future volatility. By analyzing patterns and outliers in the stock's past behavior, volatility modeling can project the degree of variation in returns that investors might encounter. This technique is instrumental in understanding the underlying risk of the investment, as it directly informs the investor about the potential range and severity of price movements that NOV Inc.'s stock may experience.
On the other hand, machine learning predictions contribute a predictive lens through which future stock returns can be estimated. By feeding historical data into a sophisticated algorithm, such as the one inspired by natural forest ecosystems, this method learns from past trends, earnings, market sentiments, and other relevant financial indicators to predict future stock performance. The prediction model generates forecasts of returns by recognizing complex patterns in the data, making it a powerful tool for anticipating the likely future trajectory of NOV Inc.'s stock value.
Integrating these two methodologies yields a comprehensive view of both the volatility and expected returns on the investment. This hybrid approach allows investors to not only prepare for the range of possible price fluctuations but also to have an informed expectation of future returns. The calculated Annual Value at Risk (VaR) at a 95% confidence level for the $10,000 investment comes to $405.74. This figure represents the maximum expected loss over a one-year period with 95% confidence, based on the combined insights from volatility modeling and machine learning predictions. Essentially, it suggests that there is only a 5% chance that the investor would lose more than $405.74 on their $10,000 investment over the next year, given the modeled volatility and return predictions.
This quantified risk metric, derived from the synergy of analyzing stock volatility and leveraging predictive algorithms, offers investors a nuanced understanding of the financial risk associated with investing in NOV Inc. By meticulously examining the potential for both wide price swings and the direction of stock movement, the investor is well-equipped to make more informed decisions, balancing their risk tolerance with their investment goals. This analytic approach demonstrates the efficacy of combining volatility modeling with machine learning predictions in articulating the financial risks of equity investment, showcasing a refined method for estimating and planning for potential market-induced losses.
Analyzing the call options for NOV Inc., considering a target stock price that is 5% higher than the current price, we delve into various factors depicted by the Greeks to identify the most profitable options. The GreeksDelta, Gamma, Vega, Theta, and Rhoeach play a crucial role in options valuation and strategy formulation. For the purpose of clarity and making informed decisions on profitability, we will focus on the critical aspects of these metrics relative to the expiration dates and strike prices of the call options in question.
Let's start with Delta, which measures the sensitivity of an option's theoretical value to a change in the price of the underlying asset. Options with a Delta closer to 1 are generally considered more profitable as the stock price moves towards our target since they effectively mirror the stock's price movement. For instance, the call option expiring on May 17, 2024, with a strike price of $11, has a significantly high Delta of 0.9494, indicating a strong responsiveness to the stock price movement. However, despite its high Delta, the ROI (Return on Investment) presents a lower figure, 0.0569, suggesting that while it's likely to move with the stock, the investment return might not be as substantial relative to its high premium of $6.7.
Turning our attention to Theta, which measures the rate of decline in the value of an option due to the passage of time, we prefer options with lower absolute Theta values since they decrease less in value with each passing day. The call option with an expiration date of July 19, 2024, and a strike price of $12, showcases a Theta of -0.0075, offering a balanced time decay relative to its profitability potential with an ROI of 0.0307 and a modest profit of $0.181.
Gamma and Vega are also instrumental in recognizing the most profitable options. Gamma affects the Delta's change for a $1 move in the underlying stock, and a higher Gamma is preferable for options traders looking for rapid changes in Delta, favoring short-term strategies. Vega measures sensitivity to volatility; higher Vega is attractive in volatile markets as it indicates the options price might increase due to volatility alone. An option with significant Gamma and Vega is the one expiring on July 19, 2024, with a strike price of $14, having Gamma of 0.0521 and Vega of 2.9827. This option indicates responsiveness to the stock price and volatility, with an ROI of 0.0739 and a profit of $0.281, positioning it as potentially profitable amidst significant market movements.
Considering Rho, which measures sensitivity to the interest rate changes, options with higher expiration dates such as the one expiring on August 16, 2024, at a strike price of $13, holding a Rho of 4.6357, indicates a favorable environment should interest rates rise, with an ROI of 0.0585 and a profit of $0.281.
In conclusion, while options like the one with an expiration date of May 17, 2024, and a strike price of $11, appear highly responsive to stock price movements due to their high Delta, the associated high premium and low ROI suggest a cautious investment approach. Conversely, options with balanced Delta, lower Theta decay, significant Gamma and Vega, such as those expiring on July 19, 2024, with strike prices of $12 and $14, respectively, and the one expiring on August 16, 2024, at a $13 strike price, present a more nuanced approach to profitability, offering a mixture of responsiveness to price, market volatility, and time decay factors, making them more attractive for investment considering a 5% rise in NOV Inc.'s stock price.
Similar Companies in Oil & Gas Equipment & Services:
Dril-Quip, Inc. (DRQ), MRC Global Inc. (MRC), Solaris Oilfield Infrastructure, Inc. (SOI), Ranger Energy Services, Inc. (RNGR), Bristow Group Inc. (VTOL), RPC, Inc. (RES), Oceaneering International, Inc. (OII), Cactus, Inc. (WHD), Halliburton Company (HAL), Report: Schlumberger Limited (SLB), Schlumberger Limited (SLB), ChampionX Corporation (CHX), Weatherford International plc (WFRD), Oil States International, Inc. (OIS), Helix Energy Solutions Group, Inc. (HLX), TechnipFMC plc (FTI), Report: Baker Hughes Company (BKR), Baker Hughes Company (BKR)
https://finance.yahoo.com/news/nov-appoints-patricia-melcher-board-220000526.html
https://finance.yahoo.com/news/kyndryl-holdings-inc-kd-earnings-150053888.html
https://finance.yahoo.com/news/nov-reports-fourth-quarter-full-223000638.html
https://seekingalpha.com/article/4667168-nov-inc-nov-q4-2023-earnings-call-transcript
https://finance.yahoo.com/news/results-nov-inc-exceeded-expectations-131121891.html
https://finance.yahoo.com/news/richard-pzena-adjusts-stake-nov-220300022.html
https://finance.yahoo.com/news/first-eagle-investment-trims-stake-080030959.html
https://finance.yahoo.com/news/20-fastest-growing-energy-companies-075119638.html
https://finance.yahoo.com/news/nov-declares-regular-quarterly-dividend-113000612.html
https://www.sec.gov/Archives/edgar/data/1021860/000095017023055867/nov-20230930.htm
Copyright © 2024 Tiny Computers (email@tinycomputers.io)
Report ID: fD9GWh
Cost: $0.87976
https://reports.tinycomputers.io/NOV/NOV-2024-02-17.html Home