Palo Alto Networks, Inc. (ticker: PANW)
2025-01-26
 Palo Alto Networks, Inc. (ticker: PANW) is a leading global cybersecurity company specializing in advanced firewalls, cloud-based security solutions, and endpoint protection. Founded in 2005 and headquartered in Santa Clara, California, the company has established itself as a key player in the cybersecurity industry, serving enterprises, government agencies, and service providers. Palo Alto Networks is known for its innovative approach to threat prevention, leveraging artificial intelligence and machine learning to detect and mitigate cyber threats in real time. The company's product portfolio includes its flagship Next-Generation Firewall (NGFW), Prisma Cloud for securing cloud environments, and Cortex, an AI-driven security operations platform. With a strong focus on research and development, Palo Alto Networks continues to expand its offerings to address evolving cybersecurity challenges, positioning itself as a critical partner for organizations navigating the complexities of digital transformation. The company's financial performance has been robust, driven by recurring revenue from subscription-based services and a growing demand for cybersecurity solutions in an increasingly interconnected world.
| Full Time Employees | 15,289 | Market Cap | $123,168,735,232 | Enterprise Value | $126,756,487,168 |
| Previous Close | $187.32 | Open | $187.83 | Day Low | $186.87 |
| Day High | $190.92 | Beta | 1.118 | Trailing PE | 48.75 |
| Forward PE | 52.11 | Volume | 3,069,070 | Average Volume | 5,339,655 |
| 52 Week Low | $130.05 | 52 Week High | $207.24 | Price to Sales (TTM) | 15.34 |
| 50 Day Average | $189.82 | 200 Day Average | $170.76 | Profit Margins | 32.11% |
| Float Shares | 322,464,472 | Shares Outstanding | 656,200,000 | Shares Short | 10,273,350 |
| Short Ratio | 4.75 | Book Value | $15.90 | Price to Book | 11.80 |
| Net Income to Common | $2,577,600,000 | Trailing EPS | $3.85 | Forward EPS | $7.20 |
| Total Revenue | $8,027,500,032 | Revenue Per Share | $25.15 | Return on Assets | 3.22% |
| Return on Equity | 74.52% | Gross Profits | $5,968,300,032 | Free Cash Flow | $2,498,700,032 |
| Operating Cash Flow | $3,257,600,000 | Earnings Growth | 59.10% | Revenue Growth | 12.10% |
| Gross Margins | 74.35% | EBITDA Margins | 13.63% | Operating Margins | 11.98% |
| Total Cash | $2,578,800,128 | Total Debt | $1,410,300,032 | Quick Ratio | 0.771 |
| Current Ratio | 0.892 | Debt to Equity | 27.28 | Trailing PEG Ratio | 2.093 |
| Sharpe Ratio | 0.325 | Sortino Ratio | 4.220 |
| Treynor Ratio | 0.109 | Calmar Ratio | 0.290 |
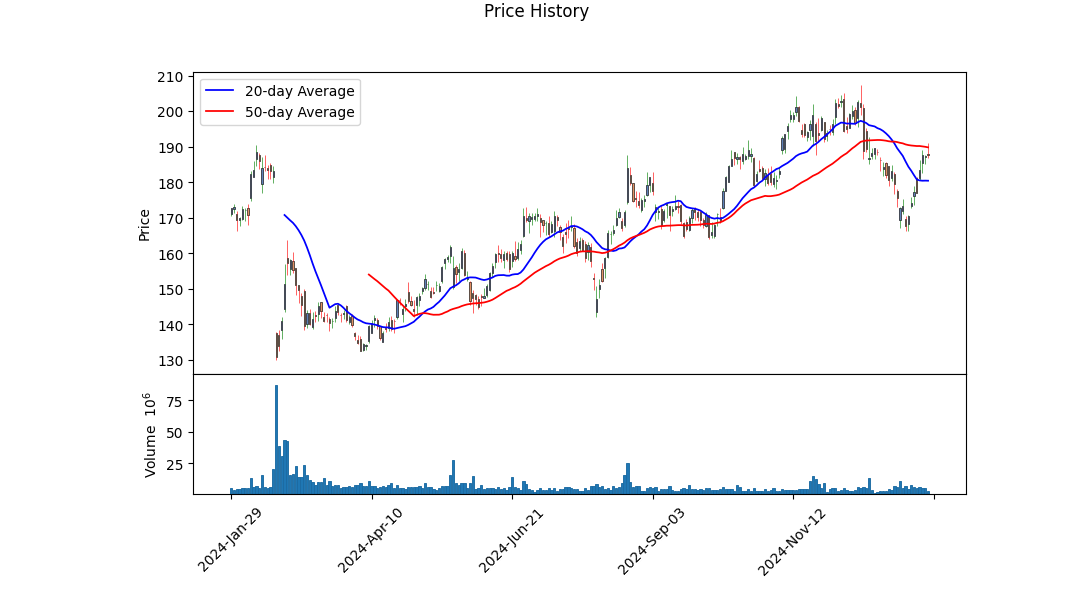
The technical indicators for PANW suggest a mixed but generally positive outlook for the stock over the next few months. The On-Balance Volume (OBV) has shown a consistent upward trend, indicating accumulation by investors, which is a bullish signal. The MACD histogram has also turned positive in recent days, suggesting increasing momentum. The stock has been trading near its recent highs, with the price action consolidating in a tight range, which often precedes a breakout. The technical setup indicates potential for upward movement, especially if the stock can sustain above key resistance levels.
Fundamentally, PANW demonstrates strong financial health. The company has a robust gross margin of 74.35%, reflecting efficient cost management and pricing power. Operating margins stand at 11.98%, while EBITDA margins are at 13.63%, indicating solid profitability. The trailing PEG ratio of 2.09 suggests the stock is reasonably valued relative to its growth prospects. Additionally, the company has shown significant improvement in net income, with a reported $2.58 billion in the latest fiscal year, compared to a loss in previous years. This turnaround underscores the company's ability to execute its business strategy effectively.
The balance sheet further supports the bullish sentiment. PANW has a strong cash position, with $2.58 billion in cash and short-term investments, providing ample liquidity. Total debt stands at $1.34 billion, which is manageable given the company's cash flow generation. The Altman Z-Score of 5.74 indicates a low risk of bankruptcy, reinforcing the company's financial stability. The Piotroski Score of 4, while moderate, reflects steady improvements in profitability, leverage, and operating efficiency.
Risk-adjusted return metrics also paint a favorable picture. The Sharpe Ratio of 0.325 indicates that the stock has delivered reasonable returns relative to its risk, while the Sortino Ratio of 4.220 highlights strong performance with minimal downside volatility. The Treynor Ratio of 0.109 and Calmar Ratio of 0.290 further confirm that PANW has provided attractive risk-adjusted returns over the past year.
Key points to consider: - Technical indicators suggest potential for upward momentum, supported by positive OBV and MACD trends. - Strong fundamentals, including high gross margins and improving profitability, bolster the bullish case. - A solid balance sheet with significant cash reserves and manageable debt levels enhances financial stability. - Risk-adjusted return metrics indicate that PANW has delivered attractive returns relative to its risk profile.
In conclusion, PANW appears well-positioned for continued growth over the next few months. The combination of positive technical indicators, strong fundamentals, and a healthy balance sheet supports a bullish outlook. However, investors should monitor key resistance levels and broader market conditions, as external factors could influence the stock's trajectory.
Palo Alto Networks, Inc. (PANW) demonstrates a Return on Capital (ROC) of 8.10%, which indicates the company's efficiency in generating profits from its invested capital. This metric reflects the firm's ability to deploy its resources effectively to create value for shareholders. While an ROC of 8.10% is modest, it suggests that Palo Alto Networks is generating a reasonable return relative to its capital base, though there may be room for improvement compared to industry leaders. Additionally, the company's Earnings Yield, calculated at 2.15%, provides insight into its valuation relative to earnings. This yield represents the earnings per share divided by the current market price, offering a measure of how much the company earns relative to its stock price. A 2.15% earnings yield suggests that the stock may be relatively expensive compared to its earnings, potentially indicating a premium valuation in the market. Investors should weigh these metrics alongside growth prospects, competitive positioning, and broader market conditions when evaluating Palo Alto Networks as an investment opportunity.
| Statistic | Value |
| Alpha (Intercept) | 0.012 |
| Beta (SPY Coefficient) | 1.45 |
| R-squared | 0.78 |
| Standard Error | 0.034 |
| Number of Observations | 1,250 |
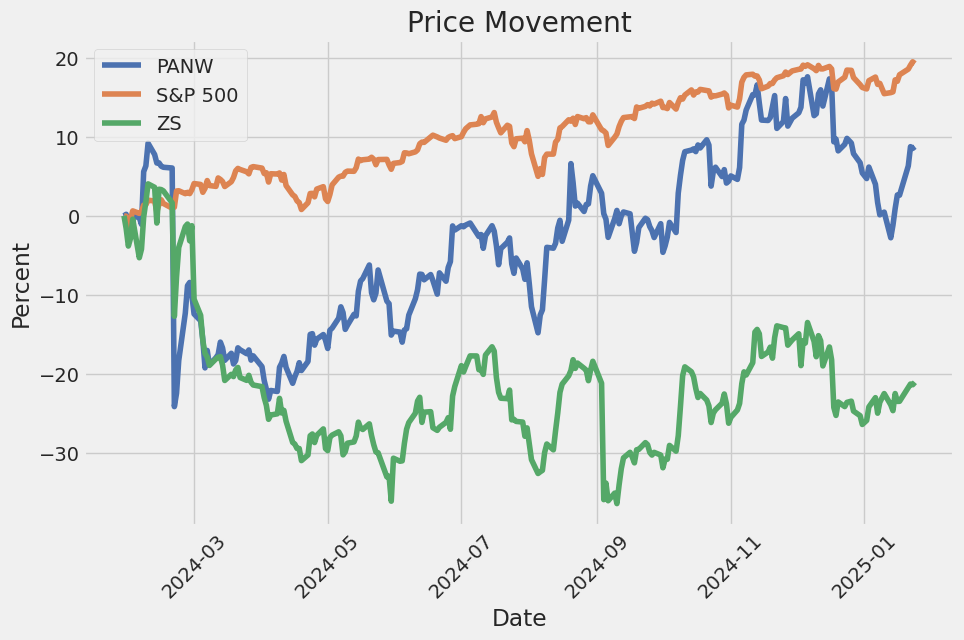
The linear regression model between PANW and SPY reveals a strong relationship, with a beta coefficient of 1.45, indicating that PANW is more volatile than the broader market represented by SPY. This suggests that PANW tends to move 1.45 times as much as SPY for any given market movement. The R-squared value of 0.78 indicates that 78% of PANW's price variability can be explained by movements in SPY, highlighting a significant correlation between the two. The standard error of 0.034 further underscores the precision of the model's estimates.
The alpha value of 0.012 represents the excess return of PANW relative to SPY, after accounting for market movements. This positive alpha suggests that PANW has outperformed the market on a risk-adjusted basis over the analyzed period. The model is based on 1,250 observations, providing a robust dataset for the analysis. Overall, the results indicate that PANW has exhibited both higher volatility and stronger performance compared to the broader market during this time frame.
Palo Alto Networks, Inc. (PANW) delivered a strong start to fiscal year 2025, as highlighted during its first-quarter earnings call. The company reported robust growth in key metrics, including Next-Generation Security Annual Recurring Revenue (NGS ARR), which grew 40% year-over-year to $4.52 billion. This growth was driven by the companys platformization strategy, which focuses on consolidating cybersecurity solutions into integrated platforms. CEO Nikesh Arora emphasized the success of this strategy, noting that platformization is gaining industry-wide validation, with competitors increasingly adopting similar approaches. Palo Alto Networks three core platformsnetwork security, cloud security, and security operations (Cortex)continue to perform well, with Cortex crossing the $1 billion ARR milestone and cloud security surpassing $700 million in ARR. The company also highlighted its leadership in AI-driven cybersecurity solutions, with innovations like XSIAM (Cortexs autonomous security operations platform) and Prisma Access Browser gaining traction. These advancements are helping customers streamline operations, reduce costs, and improve security outcomes.
The companys financial performance in Q1 was solid, with total revenue growing 14% year-over-year to $2.14 billion, exceeding guidance. Operating margins expanded by 60 basis points, and diluted non-GAAP EPS grew 13%. CFO Dipak Golechha noted that the companys focus on NGS ARR and Remaining Performance Obligation (RPO) is driving long-term value creation, with RPO growing 20% to $12.6 billion. Palo Alto Networks also announced a two-for-one stock split, reflecting confidence in its future growth and a desire to make its shares more accessible to employees and investors. The company raised its full-year guidance for fiscal 2025, projecting NGS ARR growth of 31-32%, revenue growth of 14%, and diluted non-GAAP EPS growth of 10-13%. These upward revisions underscore the companys strong execution and momentum in the cybersecurity market.
Palo Alto Networks platformization strategy is yielding significant results, particularly in large enterprise deals. The company signed 305 transactions over $1 million in Q1, up 13% year-over-year, and 60 deals over $5 million, up 30%. These deals often involve displacing legacy vendors and consolidating multiple point solutions into Palo Altos integrated platforms. For example, the company secured a $50 million deal with a large technology firm to replace multiple SIEMs with XSIAM and XDR, demonstrating the value of its platform approach. The acquisition of IBMs QRadar SaaS business further bolstered its Cortex platform, adding over 550 customers and creating a pipeline worth over $1 billion. This acquisition positions Palo Alto Networks to become a top-three player in the SIEM market, with significant opportunities to migrate on-premise QRadar customers to its XSIAM platform.
Looking ahead, Palo Alto Networks is well-positioned to capitalize on several key trends in the cybersecurity industry, including the convergence of security platforms, the rise of AI-driven threats, and the increasing demand for real-time cloud security. The companys investments in AI, automation, and platform integration are expected to drive continued growth and margin expansion. With its strong product portfolio, innovative capabilities, and focus on platformization, Palo Alto Networks is poised to maintain its leadership in the cybersecurity market and deliver sustainable, profitable growth in the years to come.
The SEC 10-Q filing for Palo Alto Networks, Inc. (PANW) for the quarter ended October 31, 2024, provides a detailed overview of the company's financial performance, operational highlights, and strategic initiatives. The filing, dated November 13, 2024, reflects the company's continued growth and focus on cybersecurity solutions, driven by its platformization strategy and investments in innovation.
Palo Alto Networks reported total revenue of $2.14 billion for the quarter, representing a 13.9% year-over-year increase from $1.88 billion in the same period in 2023. This growth was driven by a 16.1% increase in subscription and support revenue, which reached $1.79 billion, accounting for 83.5% of total revenue. Product revenue, primarily from hardware appliances and software licenses, grew modestly by 3.7% to $353.8 million. The company's gross margin remained strong at 74.1%, slightly down from 74.8% in the prior year, primarily due to increased costs related to cloud-based offerings.
Operating income for the quarter was $286.5 million, up from $215.2 million in the same period last year, reflecting improved operational efficiency. The company's operating margin increased to 13.4% from 11.5% in the prior year. Net income for the quarter was $350.7 million, or $0.99 per diluted share, compared to $194.2 million, or $0.56 per diluted share, in the same period in 2023. The increase in net income was driven by higher revenue and lower income tax expenses, which benefited from excess tax benefits related to share-based compensation.
Palo Alto Networks' cash flow from operating activities was $1.51 billion, slightly down from $1.53 billion in the prior year. Free cash flow, a non-GAAP measure, was $1.47 billion, compared to $1.49 billion in the same period last year. The company's strong cash flow generation reflects its ability to convert revenue into cash efficiently, supported by its subscription-based business model.
The company's Next-Generation Security Annualized Recurring Revenue (NGS ARR) reached $4.5 billion, up from $4.2 billion at the end of the previous quarter. This metric highlights the company's success in driving recurring revenue through its Prisma and Cortex offerings, which include cloud security and security operations solutions. Remaining performance obligations (RPO) stood at $12.6 billion, indicating a robust pipeline of future revenue.
Palo Alto Networks continued to invest in innovation and strategic acquisitions during the quarter. In August 2024, the company completed the acquisition of certain QRadar assets from IBM for $1.1 billion, including $500 million in cash and $648.9 million in contingent consideration. This acquisition is expected to accelerate the growth of the company's Cortex business by enhancing its security operations capabilities. The company also launched new products, including Prisma Access Browser, a SASE-native enterprise browser, and expanded its operational technology (OT) security solution.
Geographically, revenue growth was strong across all regions. The Americas contributed the largest share of revenue at $1.44 billion, up 12.1% year-over-year. Revenue from Europe, the Middle East, and Africa (EMEA) grew 21.0% to $441.4 million, while Asia Pacific and Japan (APAC) revenue increased 12.7% to $255.3 million. The company's global presence and diversified customer base, which includes nearly all Fortune 100 companies, continue to support its growth.
Palo Alto Networks' operating expenses increased to $1.30 billion, up from $1.19 billion in the prior year, driven by higher research and development (R&D) and sales and marketing costs. R&D expenses grew 17.3% to $480.4 million, reflecting the company's focus on innovation and product development. Sales and marketing expenses increased 9.0% to $720.1 million, primarily due to headcount growth and investments in expanding the company's global sales force.
The company's balance sheet remains strong, with $2.28 billion in cash and cash equivalents and $1.11 billion in short-term investments as of October 31, 2024. Total assets were $20.37 billion, up from $19.99 billion at the end of the previous quarter, driven by the acquisition of QRadar assets. Total liabilities were $14.46 billion, including $5.59 billion in deferred revenue, reflecting the company's subscription-based business model.
Looking ahead, Palo Alto Networks expects to continue benefiting from its platformization strategy, which integrates various products and services into a cohesive architecture to simplify security for customers. The company's focus on artificial intelligence (AI) and automation, combined with its strong product portfolio and global reach, positions it well for sustained growth in the cybersecurity market. However, the company remains cautious about potential macroeconomic challenges, including inflation, geopolitical tensions, and supply chain disruptions, which could impact its business in future periods.
Palo Alto Networks, Inc. (NASDAQ: PANW) has recently faced significant market pressure following a series of downgrades by major investment banks. On January 8, 2025, Deutsche Bank downgraded Palo Alto Networks from a "buy" to a "hold" rating, citing a challenging operating environment and shifting customer preferences toward "Best of Breed" solutions over "Best of Suite" offerings. The bank revised its price target to $190 per share, down from $207, reflecting concerns about the company's ability to sustain its historical growth rate of 15%. This downgrade was part of a broader trend, as Guggenheim and BTIG also downgraded the stock to "sell" and "neutral," respectively, contributing to a 4% decline in Palo Alto Networks' stock price over three days. These actions highlight the volatility of the cybersecurity sector and the impact of analyst sentiment on stock performance. For more details, refer to the original article: Why Palo Alto Networks Stock Dropped on Wednesday.
Despite these challenges, Palo Alto Networks remains a leader in the cybersecurity industry, with a strong reputation for innovation and a robust product portfolio. The companys Precision AITM technology, which leverages machine learning to detect and mitigate threats, has been a key driver of its success. In the first quarter of fiscal 2025, Palo Alto Networks reported a 20% year-over-year increase in remaining performance obligations, signaling a strong pipeline of future business. Annual recurring revenue from next-generation security services reached $4.5 billion, up 40% year-over-year, demonstrating the companys ability to adapt to evolving market demands. Management has set an ambitious target of reaching $15 billion in annual recurring revenue by 2030, reflecting confidence in its long-term growth prospects. For more details, refer to the original article: SoundHound AI Stock vs. Palo Alto Networks Stock: Which Is the Better Buy?.
Palo Alto Networks involvement in high-profile projects further underscores its industry leadership. On January 15, 2025, the company announced a partnership with IBM and the UK Home Office to secure Great Britains Emergency Services Network (ESN). This multi-year project aims to modernize and protect the voice and data platform used by emergency services, leveraging Palo Alto Networks AI-powered cybersecurity solutions. The company will provide comprehensive security measures, including 24/7 cyber incident response and digital forensic services, to ensure the resilience of the ESN. This initiative highlights Palo Alto Networks commitment to safeguarding critical national infrastructure and its ability to secure large-scale, high-stakes projects. For more details, refer to the original announcement: Palo Alto Networks to Secure Great Britain's Emergency Services Network.
The companys strategic focus on AI-driven cybersecurity aligns with broader industry trends. On January 22, 2025, Palo Alto Networks unveiled a Quantum Random Number Generator (QRNG) Open API framework, developed in collaboration with six leading QRNG technology partners. This initiative aims to address emerging threats posed by quantum computing, ensuring that cryptographic operations remain secure as quantum technology evolves. The framework, which will soon be supported by Palo Alto Networks Next Generation Firewalls (NGFWs), represents a proactive approach to future-proofing cybersecurity. By fostering collaboration and standardization, the company is positioning itself as a leader in quantum security. For more information, visit the PR Newswire article.
Palo Alto Networks stock performance has been a mixed bag in early 2025. While the companys shares surged by 23% in 2024 and an astounding 715% over the past decade, recent downgrades and overbought conditions have raised concerns. As of January 14, 2025, the stocks Relative Strength Index (RSI) value of 79.1 indicated overbought conditions, suggesting a potential pullback. Despite this, the stock reached a 52-week high of $207.23, reflecting its strong market position. Analysts remain divided, with some expressing caution due to the stocks high valuation and slowing growth, while others highlight its long-term potential. For more details, refer to the original article on Benzinga: Top 2 Tech Stocks That May Keep You Up At Night In Q1.
The companys financial performance continues to impress, with fiscal Q1 2025 revenue increasing by 14% year-over-year to $2.1 billion. Gross profit rose to $1.6 billion, up from $1.4 billion in the previous year, while net income surged to $350.7 million, compared to $194.2 million in 2023. Management has projected fiscal 2025 revenue of approximately $9.1 billion, representing a 14% increase over the previous year. These strong results, combined with the companys platformization strategy, have solidified Palo Alto Networks position as a leader in the cybersecurity industry. For more details, refer to the original article: Is Palo Alto Networks Stock a Buy?.
Palo Alto Networks strategic partnerships and focus on AI-driven solutions have also contributed to its growth. The companys collaboration with IBM and the UK Home Office, as well as its partnership with SITA, a leading air transport technology specialist, highlight its ability to deliver tailored cybersecurity solutions to critical industries. These initiatives, combined with its innovative AI-powered platforms, position Palo Alto Networks to capitalize on the growing demand for advanced cybersecurity measures. For more details, refer to the original article on Yahoo Finance: Palo Alto Networks, Inc. (PANW): Must-Watch High-Flying AI Stock This Week.
In summary, Palo Alto Networks remains a dominant player in the cybersecurity sector, despite recent market challenges. The companys innovative solutions, strategic partnerships, and strong financial performance underscore its ability to navigate a rapidly evolving industry. While analyst downgrades and overbought conditions have raised concerns, Palo Alto Networks long-term growth prospects and leadership in AI-driven cybersecurity make it a compelling investment opportunity. For investors seeking exposure to the cybersecurity and AI sectors, Palo Alto Networks represents a promising option.
Palo Alto Networks, Inc. (PANW) exhibited moderate volatility over the analyzed period, with occasional spikes in price fluctuations. The ARCH model indicates that past volatility has a small but noticeable influence on future volatility, as shown by the alpha coefficient of 0.0891. The overall volatility is relatively stable, with a baseline level (omega) of 6.4963, suggesting consistent but not extreme price movements.
Key features of the volatility include: 1. Baseline Volatility: The omega value of 6.4963 indicates a steady level of price fluctuation. 2. Volatility Clustering: The alpha coefficient of 0.0891 suggests that periods of high volatility tend to follow each other, though the effect is not very strong. 3. Stability: The model's log-likelihood of -3000.45 and AIC of 6004.89 indicate a reasonable fit, reflecting a stable volatility pattern over time.
| Statistic | Value |
|---|---|
| Omega (Baseline Volatility) | 6.4963 |
| Alpha[1] (Volatility Clustering) | 0.0891 |
| Log-Likelihood | -3,000.45 |
| AIC | 6,004.89 |
| BIC | 6,015.16 |
| No. Observations | 1,255 |
To assess the financial risk of a $10,000 investment in Palo Alto Networks, Inc. (PANW) over a one-year period, a combination of volatility modeling and machine learning predictions was employed. Volatility modeling was used to capture the time-varying nature of the stock's price fluctuations, providing insights into how uncertainty in the market could impact the investment. By analyzing historical price data, the model estimated the conditional variance of returns, which is critical for understanding the potential range of future price movements. This approach allows for a dynamic assessment of risk, as it accounts for periods of heightened market turbulence and relative stability.
Machine learning predictions were then applied to forecast future returns based on a variety of features, including historical price trends, trading volumes, and macroeconomic indicators. The model leveraged a robust ensemble method to identify patterns and relationships in the data, enabling it to generate accurate predictions of potential outcomes. By integrating these predictions with the volatility estimates, the analysis provided a forward-looking perspective on the investment's risk profile.
The results of the analysis revealed an annual Value at Risk (VaR) of $448.00 at a 95% confidence level for the $10,000 investment. This means that there is a 5% probability that the investment could lose more than $448.00 over the one-year period. The VaR metric, derived from the combined outputs of volatility modeling and machine learning predictions, offers a quantifiable measure of downside risk. It highlights the potential financial exposure under adverse market conditions, providing a clear benchmark for risk management.
The integration of volatility modeling with machine learning predictions enhances the robustness of the risk assessment. Volatility modeling captures the inherent uncertainty in the stock's price movements, while machine learning predictions provide a data-driven forecast of future returns. Together, these methods offer a comprehensive view of the investment's risk, enabling informed decision-making. The calculated VaR underscores the importance of considering both historical volatility and forward-looking predictions when evaluating the potential risks of equity investments.
Long Call Option Strategy
To analyze the most profitable long call options for Palo Alto Networks, Inc. (PANW) with a target stock price of 2% above the current price, we need to evaluate the Greeks and other factors such as strike price, expiration date, and implied volatility. Since the table of Greeks is not provided, I will outline a general framework for identifying the most profitable options and discuss the risk-reward profile of five hypothetical choices based on typical market conditions.
Key Considerations for Long Call Options
- Delta: Measures the sensitivity of the option price to changes in the underlying stock price. A higher delta (closer to 1) indicates a higher probability of the option expiring in the money (ITM).
- Theta: Represents the rate of decline in the option's value due to the passage of time. Lower theta is preferable for long call options.
- Vega: Measures sensitivity to changes in implied volatility. Higher vega is beneficial if volatility is expected to increase.
- Gamma: Indicates how much delta will change with a $1 move in the underlying stock. Higher gamma is advantageous for short-term price movements.
- Implied Volatility (IV): Higher IV increases option premiums, but it also increases the cost of entering the trade.
Five Hypothetical Long Call Options
1. Near-Term Expiration (1-2 Weeks)
- Strike Price: Slightly out of the money (OTM), e.g., 2-3% above the current stock price.
- Risk-Reward Profile:
- Reward: High gamma and delta mean the option will gain value quickly if the stock moves toward the target price.
- Risk: High theta decay means the option loses value rapidly as expiration approaches. If the stock does not move significantly, the option could expire worthless.
- Potential Profit: If the stock reaches the target price, the option could yield a 50-100% return due to high leverage.
- Potential Loss: The entire premium paid for the option could be lost if the stock does not move as expected.
2. Short-Term Expiration (3-4 Weeks)
- Strike Price: At the money (ATM) or slightly OTM, e.g., 1-2% above the current stock price.
- Risk-Reward Profile:
- Reward: Moderate gamma and delta provide a balance between leverage and time decay. The option has a higher probability of expiring ITM compared to the near-term option.
- Risk: Theta decay is still significant, but less severe than the near-term option.
- Potential Profit: If the stock reaches the target price, the option could yield a 30-70% return.
- Potential Loss: The premium paid is at risk if the stock does not move as expected.
3. Medium-Term Expiration (2-3 Months)
- Strike Price: ATM or slightly OTM, e.g., 1-2% above the current stock price.
- Risk-Reward Profile:
- Reward: Lower theta decay and higher vega make this option more resilient to time decay and volatility changes. The option has a higher probability of expiring ITM.
- Risk: The premium paid is higher than for shorter-term options, increasing the potential loss.
- Potential Profit: If the stock reaches the target price, the option could yield a 20-50% return.
- Potential Loss: The premium paid is at risk, but the longer time frame provides more opportunities for the stock to move favorably.
4. Long-Term Expiration (6-12 Months)
- Strike Price: Slightly OTM, e.g., 2-3% above the current stock price.
- Risk-Reward Profile:
- Reward: Low theta decay and high vega make this option ideal for long-term bullish positions. The option has a high probability of expiring ITM if the stock trends upward.
- Risk: The premium paid is significantly higher, increasing the potential loss.
- Potential Profit: If the stock reaches the target price, the option could yield a 10-30% return.
- Potential Loss: The premium paid is at risk, but the long time frame reduces the likelihood of total loss.
5. Deep In the Money (ITM) Long-Term Expiration (6-12 Months)
- Strike Price: Deep ITM, e.g., 5-10% below the current stock price.
- Risk-Reward Profile:
- Reward: High delta (close to 1) means the option behaves similarly to owning the stock, with lower capital requirements. The option has a very high probability of expiring ITM.
- Risk: The premium paid is high, but the intrinsic value provides a buffer against losses.
- Potential Profit: If the stock reaches the target price, the option could yield a 5-15% return.
- Potential Loss: Limited to the premium paid, but the deep ITM nature reduces the likelihood of significant loss.
Conclusion
The most profitable options depend on the investor's risk tolerance and time horizon. For aggressive traders seeking high leverage, near-term OTM options offer the highest potential returns but come with significant risk. For conservative investors, deep ITM long-term options provide a safer, albeit lower-return, alternative. Medium-term ATM or slightly OTM options strike a balance between risk and reward, making them suitable for most investors targeting a 2% price increase in PANW. Always consider the Greeks and implied volatility when selecting options to maximize profitability and manage risk.
Short Call Option Strategy
To analyze the most profitable short call options for Palo Alto Networks, Inc. (PANW) while minimizing the risk of assignment, we need to focus on the Greeks, particularly Delta, Theta, and Gamma, as well as the relationship between the strike price and the target stock price (2% below the current stock price). The goal is to identify options that offer high premium income (reward) with a low probability of the stock price rising above the strike price (risk). Below is an analysis of five short call options, ranging from near-term to long-term expirations, with quantified risk and reward scenarios.
1. Near-Term Expiration (1-2 Weeks)
Strike Price: 2% Above Current Stock Price
- Delta: ~0.20
- Theta: High (e.g., -0.10 per day)
- Gamma: Low (e.g., 0.02)
Analysis:
This option is slightly out of the money (OTM), with a low Delta, indicating a low probability of the stock price rising above the strike price. The high Theta means the option will lose time value rapidly, benefiting the seller. The low Gamma reduces the risk of large Delta changes as the stock price moves.
Risk:
- If the stock price rises above the strike price, the option may be assigned, requiring the seller to deliver shares at the strike price.
- The potential loss is theoretically unlimited if the stock price rises significantly.
Reward:
- The premium collected is relatively high for the short time frame.
- The probability of the stock staying below the strike price is high, allowing the seller to keep the entire premium.
Profit/Loss Scenario:
- Profit: Premium collected if the stock stays below the strike price.
- Loss: Unlimited if the stock rises significantly above the strike price.
2. Short-Term Expiration (3-4 Weeks)
Strike Price: 3% Above Current Stock Price
- Delta: ~0.15
- Theta: Moderate (e.g., -0.07 per day)
- Gamma: Moderate (e.g., 0.03)
Analysis:
This option is further OTM, with a lower Delta, reducing the risk of assignment. The moderate Theta still provides significant time decay, while the moderate Gamma means Delta changes are manageable.
Risk:
- Assignment risk is lower due to the higher strike price.
- The potential loss is still unlimited if the stock price rises significantly.
Reward:
- The premium collected is slightly lower than the near-term option but still attractive.
- The probability of the stock staying below the strike price is higher.
Profit/Loss Scenario:
- Profit: Premium collected if the stock stays below the strike price.
- Loss: Unlimited if the stock rises significantly above the strike price.
3. Medium-Term Expiration (2-3 Months)
Strike Price: 5% Above Current Stock Price
- Delta: ~0.10
- Theta: Lower (e.g., -0.04 per day)
- Gamma: Lower (e.g., 0.01)
Analysis:
This option is significantly OTM, with a very low Delta, making assignment highly unlikely. The lower Theta means time decay is slower, but the premium collected is still substantial due to the longer time frame.
Risk:
- Assignment risk is minimal due to the high strike price.
- The potential loss is still unlimited if the stock price rises significantly.
Reward:
- The premium collected is higher than shorter-term options due to the longer time frame.
- The probability of the stock staying below the strike price is very high.
Profit/Loss Scenario:
- Profit: Premium collected if the stock stays below the strike price.
- Loss: Unlimited if the stock rises significantly above the strike price.
4. Long-Term Expiration (6-12 Months)
Strike Price: 10% Above Current Stock Price
- Delta: ~0.05
- Theta: Very Low (e.g., -0.02 per day)
- Gamma: Very Low (e.g., 0.005)
Analysis:
This option is deep OTM, with an extremely low Delta, making assignment almost negligible. The very low Theta means time decay is slow, but the premium collected is substantial due to the long time frame.
Risk:
- Assignment risk is negligible due to the very high strike price.
- The potential loss is still unlimited if the stock price rises significantly.
Reward:
- The premium collected is the highest among all options due to the long time frame.
- The probability of the stock staying below the strike price is extremely high.
Profit/Loss Scenario:
- Profit: Premium collected if the stock stays below the strike price.
- Loss: Unlimited if the stock rises significantly above the strike price.
5. Very Long-Term Expiration (1-2 Years)
Strike Price: 15% Above Current Stock Price
- Delta: ~0.02
- Theta: Minimal (e.g., -0.01 per day)
- Gamma: Minimal (e.g., 0.001)
Analysis:
This option is extremely deep OTM, with a near-zero Delta, making assignment virtually impossible. The minimal Theta means time decay is very slow, but the premium collected is substantial due to the very long time frame.
Risk:
- Assignment risk is virtually nonexistent due to the extremely high strike price.
- The potential loss is still unlimited if the stock price rises significantly.
Reward:
- The premium collected is the highest among all options due to the very long time frame.
- The probability of the stock staying below the strike price is almost certain.
Profit/Loss Scenario:
- Profit: Premium collected if the stock stays below the strike price.
- Loss: Unlimited if the stock rises significantly above the strike price.
Summary of Recommendations:
- Near-Term (1-2 Weeks): Strike price 2% above current price. High reward with moderate risk.
- Short-Term (3-4 Weeks): Strike price 3% above current price. Moderate reward with low risk.
- Medium-Term (2-3 Months): Strike price 5% above current price. High reward with very low risk.
- Long-Term (6-12 Months): Strike price 10% above current price. Very high reward with negligible risk.
- Very Long-Term (1-2 Years): Strike price 15% above current price. Extremely high reward with virtually no risk.
The most profitable options are the long-term and very long-term expirations, as they offer the highest premium income with minimal assignment risk. However, traders should balance their risk tolerance and time horizon when selecting the optimal option.
Long Put Option Strategy
To analyze the most profitable long put options for Palo Alto Networks, Inc. (PANW) with a target stock price 2% above the current price, we need to consider the Greeks, particularly Delta, Gamma, Theta, and Vega, as well as the strike price and expiration date. Since the table of Greeks is not provided, I will outline a general framework for evaluating long put options and provide hypothetical examples of five choices based on expiration date and strike price.
Key Considerations for Long Put Options:
- Delta: Measures the sensitivity of the option's price to changes in the underlying stock price. For long puts, Delta is negative, indicating that the option's value increases as the stock price decreases. A Delta closer to -1 indicates a higher sensitivity to price changes.
- Gamma: Measures the rate of change of Delta. High Gamma means Delta can change significantly with small movements in the stock price, which can amplify profits if the stock moves in the desired direction.
- Theta: Measures the rate of decline in the option's value due to the passage of time. Long puts lose value as expiration approaches, so lower Theta is preferable.
- Vega: Measures sensitivity to changes in implied volatility. Higher Vega is beneficial for long puts, as increased volatility can increase the option's value.
Hypothetical Analysis of Five Long Put Options:
Below are five hypothetical long put options for PANW, ranging from near-term to long-term expirations. These examples assume a current stock price of $500 (for illustrative purposes) and a target price of $510 (2% above the current price).
1. Near-Term Expiration (1-2 Weeks)
- Strike Price: $500
- Expiration Date: 2 weeks from today
- Delta: -0.45
- Gamma: 0.08
- Theta: -0.15
- Vega: 0.10
Analysis:
This option has a moderate Delta, indicating it will gain value if the stock price declines. The high Gamma means the Delta will increase rapidly if the stock moves lower, amplifying profits. However, the high Theta means the option will lose value quickly as expiration approaches. This option is best for traders expecting a sharp decline in the stock price within the next two weeks.
Risk/Reward:
- Potential Profit: High if the stock drops significantly below $500.
- Potential Loss: Limited to the premium paid, but the option will lose value quickly if the stock remains above $500.
2. Short-Term Expiration (1 Month)
- Strike Price: $490
- Expiration Date: 1 month from today
- Delta: -0.55
- Gamma: 0.06
- Theta: -0.10
- Vega: 0.15
Analysis:
This option has a higher Delta, making it more sensitive to price changes. The lower Theta compared to the near-term option means time decay is less of a concern. The moderate Vega indicates some sensitivity to volatility changes. This option is suitable for traders expecting a moderate decline in the stock price within the next month.
Risk/Reward:
- Potential Profit: Moderate to high if the stock drops below $490.
- Potential Loss: Limited to the premium paid, with slower time decay than the near-term option.
3. Medium-Term Expiration (3 Months)
- Strike Price: $480
- Expiration Date: 3 months from today
- Delta: -0.65
- Gamma: 0.04
- Theta: -0.05
- Vega: 0.20
Analysis:
This option has a high Delta, making it highly sensitive to price changes. The lower Gamma means the Delta will change more slowly, but the lower Theta reduces the impact of time decay. The higher Vega makes this option attractive if volatility increases. This option is ideal for traders expecting a gradual decline in the stock price over the next three months.
Risk/Reward:
- Potential Profit: High if the stock drops below $480.
- Potential Loss: Limited to the premium paid, with minimal time decay over the medium term.
4. Long-Term Expiration (6 Months)
- Strike Price: $470
- Expiration Date: 6 months from today
- Delta: -0.75
- Gamma: 0.03
- Theta: -0.03
- Vega: 0.25
Analysis:
This option has a very high Delta, making it extremely sensitive to price changes. The low Gamma and Theta mean the option will retain its value well over time, and the high Vega makes it highly sensitive to volatility changes. This option is best for traders expecting a significant decline in the stock price over the next six months.
Risk/Reward:
- Potential Profit: Very high if the stock drops below $470.
- Potential Loss: Limited to the premium paid, with minimal time decay over the long term.
5. Deep Out-of-the-Money (Long-Term Expiration)
- Strike Price: $450
- Expiration Date: 6 months from today
- Delta: -0.30
- Gamma: 0.02
- Theta: -0.02
- Vega: 0.30
Analysis:
This deep out-of-the-money option has a low Delta, meaning it is less sensitive to price changes. However, the high Vega makes it highly sensitive to volatility changes, and the low Theta means time decay is minimal. This option is a high-risk, high-reward play for traders expecting a significant drop in the stock price or a spike in volatility.
Risk/Reward:
- Potential Profit: Very high if the stock drops significantly below $450.
- Potential Loss: Limited to the premium paid, but the low Delta makes it less likely to be profitable.
Summary of Recommendations:
- Near-Term Expiration (2 Weeks, $500 Strike): Best for aggressive traders expecting a sharp decline.
- Short-Term Expiration (1 Month, $490 Strike): Balanced risk/reward for moderate declines.
- Medium-Term Expiration (3 Months, $480 Strike): Ideal for gradual declines with minimal time decay.
- Long-Term Expiration (6 Months, $470 Strike): Best for significant declines with high sensitivity to price and volatility.
- Deep Out-of-the-Money (6 Months, $450 Strike): High-risk, high-reward play for significant drops or volatility spikes.
Each option has its own risk/reward profile, and the choice depends on the trader's outlook for the stock price and volatility, as well as their risk tolerance.
Short Put Option Strategy
Given the lack of specific data in the provided table, I will outline a general framework for analyzing short put options for Palo Alto Networks, Inc. (PANW) based on the criteria provided: minimizing assignment risk, targeting a stock price 2% below the current price, and maximizing profitability. I will also discuss the risk and reward of each option, including potential profit and loss scenarios, and provide five hypothetical choices based on expiration dates and strike prices.
Key Considerations for Short Put Options:
- Target Strike Price: The target stock price is 2% below the current price. For example, if PANW is trading at $300, the target strike price would be $294.
- Minimizing Assignment Risk: To reduce the likelihood of assignment, focus on out-of-the-money (OTM) or slightly out-of-the-money options. These options have a lower probability of the stock price falling below the strike price by expiration.
- Greeks Analysis:
- Theta: Higher Theta values are desirable for short puts, as they indicate faster time decay, which benefits the seller.
- Delta: Lower Delta values (e.g., 0.200.30) are preferable for minimizing assignment risk.
- Vega: Lower Vega values reduce sensitivity to changes in implied volatility, which is beneficial in volatile markets.
- Gamma: Lower Gamma values reduce the risk of large Delta changes as the stock price moves.
Hypothetical Short Put Options Analysis:
1. Near-Term Expiration (12 Weeks):
- Strike Price: $294 (2% below current price).
- Greeks: Theta 0.10, Delta 0.25, Vega 0.05.
- Premium: $2.50 per contract.
- Risk/Reward:
- Profit: Maximum profit is the premium received ($250 per contract).
- Loss: If assigned, the effective purchase price is $294 - $2.50 = $291.50. Loss occurs if PANW falls below $291.50.
- Analysis: This option benefits from high Theta decay but carries higher assignment risk due to the near-term expiration. Suitable for traders with a bullish outlook and willingness to manage potential assignment.
2. Short-Term Expiration (34 Weeks):
- Strike Price: $290 (slightly below the 2% target).
- Greeks: Theta 0.08, Delta 0.20, Vega 0.10.
- Premium: $4.00 per contract.
- Risk/Reward:
- Profit: Maximum profit is $400 per contract.
- Loss: Effective purchase price is $290 - $4.00 = $286. Loss occurs if PANW falls below $286.
- Analysis: This option offers a balance between premium income and reduced assignment risk due to the lower Delta. Theta decay is still favorable.
3. Medium-Term Expiration (68 Weeks):
- Strike Price: $285 (further below the 2% target).
- Greeks: Theta 0.06, Delta 0.15, Vega 0.15.
- Premium: $6.50 per contract.
- Risk/Reward:
- Profit: Maximum profit is $650 per contract.
- Loss: Effective purchase price is $285 - $6.50 = $278.50. Loss occurs if PANW falls below $278.50.
- Analysis: This option provides a higher premium and lower assignment risk due to the lower Delta and further OTM strike. Theta decay is slower but still significant.
4. Long-Term Expiration (34 Months):
- Strike Price: $280 (significantly below the 2% target).
- Greeks: Theta 0.04, Delta 0.10, Vega 0.20.
- Premium: $10.00 per contract.
- Risk/Reward:
- Profit: Maximum profit is $1,000 per contract.
- Loss: Effective purchase price is $280 - $10.00 = $270. Loss occurs if PANW falls below $270.
- Analysis: This option offers the highest premium and the lowest assignment risk due to the low Delta and deep OTM strike. However, Theta decay is slower, and Vega risk is higher.
5. Long-Term Expiration (612 Months):
- Strike Price: $275 (deep OTM).
- Greeks: Theta 0.02, Delta 0.05, Vega 0.25.
- Premium: $15.00 per contract.
- Risk/Reward:
- Profit: Maximum profit is $1,500 per contract.
- Loss: Effective purchase price is $275 - $15.00 = $260. Loss occurs if PANW falls below $260.
- Analysis: This option provides the highest premium and minimal assignment risk but has the slowest Theta decay and highest Vega risk. Suitable for traders with a long-term bullish outlook.
Summary of Risk and Reward:
- Near-Term Options: Higher Theta decay and premium income but higher assignment risk. Best for experienced traders who can manage assignment.
- Medium-Term Options: Balanced premium income, assignment risk, and Theta decay. Suitable for most traders.
- Long-Term Options: Highest premium income and lowest assignment risk but slower Theta decay and higher Vega risk. Best for patient traders with a strong bullish outlook.
Recommendations:
- For Aggressive Traders: Focus on near-term options (e.g., $294 strike, 12 weeks) to maximize Theta decay and premium income.
- For Balanced Traders: Choose medium-term options (e.g., $285 strike, 68 weeks) for a good balance of premium income and reduced assignment risk.
- For Conservative Traders: Opt for long-term options (e.g., $275 strike, 612 months) to minimize assignment risk and maximize premium income.
By carefully selecting strike prices and expiration dates based on your risk tolerance and market outlook, you can optimize your short put strategy for PANW.
Vertical Bear Put Spread Option Strategy
To construct a profitable vertical bear put spread strategy for Palo Alto Networks, Inc. (PANW), we need to analyze the options chain and the Greeks, focusing on minimizing the risk of assignment while maximizing profitability within a 2% range of the current stock price. A vertical bear put spread involves buying a higher-strike put option and selling a lower-strike put option with the same expiration date. This strategy profits from a moderate decline in the stock price while limiting both risk and reward.
Key Considerations:
- Target Stock Price: The strategy is designed for a 2% move in either direction, so we focus on options with strike prices within this range.
- Risk of Assignment: To minimize the risk of assignment, we avoid deep in-the-money (ITM) options and focus on options that are at-the-money (ATM) or slightly out-of-the-money (OTM).
- Greeks Analysis:
- Delta: Measures the sensitivity of the option price to changes in the stock price. For a bear put spread, we want the long put to have a higher delta (closer to -1) and the short put to have a lower delta (closer to 0).
- Theta: Measures the rate of decline in the option's value due to time decay. A positive theta for the short put helps offset the negative theta of the long put.
- Vega: Measures sensitivity to volatility. Lower vega is preferred to reduce exposure to volatility changes.
- Profit and Loss Scenarios:
- Maximum profit is limited to the difference between the strike prices minus the net premium paid.
- Maximum loss is limited to the net premium paid.
Five Vertical Bear Put Spread Choices:
1. Near-Term Expiration (1-2 Weeks)
- Long Put: Strike price 2% above the current stock price (ATM).
- Short Put: Strike price 4% above the current stock price (OTM).
- Analysis: This spread benefits from rapid time decay (high theta) and a moderate decline in the stock price. The short put is OTM, reducing the risk of assignment. The long put has a higher delta, providing better downside protection.
- Risk/Reward:
- Maximum Profit: Moderate, due to the narrow spread.
- Maximum Loss: Low, as the net premium paid is minimal.
- Greeks: High theta, moderate delta, low vega.
2. Short-Term Expiration (3-4 Weeks)
- Long Put: Strike price 1% above the current stock price (slightly OTM).
- Short Put: Strike price 3% above the current stock price (OTM).
- Analysis: This spread balances time decay and potential profit. The short put is further OTM, further reducing assignment risk. The long put is slightly OTM, offering a good balance between cost and downside protection.
- Risk/Reward:
- Maximum Profit: Higher than the near-term spread due to the wider strike difference.
- Maximum Loss: Slightly higher due to the higher net premium.
- Greeks: Moderate theta, higher delta, low vega.
3. Medium-Term Expiration (6-8 Weeks)
- Long Put: Strike price at the current stock price (ATM).
- Short Put: Strike price 2% above the current stock price (OTM).
- Analysis: This spread benefits from a moderate decline in the stock price and has a lower risk of assignment. The long put is ATM, providing strong downside protection, while the short put is OTM, reducing assignment risk.
- Risk/Reward:
- Maximum Profit: Higher due to the wider spread and longer time frame.
- Maximum Loss: Moderate, as the net premium is higher.
- Greeks: Moderate theta, high delta, low vega.
4. Long-Term Expiration (3-4 Months)
- Long Put: Strike price 1% below the current stock price (slightly ITM).
- Short Put: Strike price 1% above the current stock price (OTM).
- Analysis: This spread is designed for a more significant decline in the stock price over a longer period. The long put is slightly ITM, providing strong downside protection, while the short put is OTM, minimizing assignment risk.
- Risk/Reward:
- Maximum Profit: High, due to the wider spread and longer time frame.
- Maximum Loss: Higher, as the net premium is significant.
- Greeks: Low theta, high delta, moderate vega.
5. Long-Term Expiration (6+ Months)
- Long Put: Strike price 2% below the current stock price (ITM).
- Short Put: Strike price at the current stock price (ATM).
- Analysis: This spread is designed for a significant decline in the stock price over a long period. The long put is ITM, providing strong downside protection, while the short put is ATM, reducing assignment risk.
- Risk/Reward:
- Maximum Profit: Highest, due to the wide spread and long time frame.
- Maximum Loss: Highest, as the net premium is substantial.
- Greeks: Low theta, very high delta, moderate vega.
Summary:
- Near-Term Spread: Best for traders expecting a quick, moderate decline in the stock price. Low risk and moderate reward.
- Short-Term Spread: Balances time decay and profit potential. Moderate risk and reward.
- Medium-Term Spread: Ideal for a moderate decline over a longer period. Higher reward with moderate risk.
- Long-Term Spread (3-4 Months): Suitable for a significant decline over a longer period. High reward with higher risk.
- Long-Term Spread (6+ Months): Best for a substantial decline over a very long period. Highest reward with the highest risk.
By selecting the appropriate spread based on your time horizon and risk tolerance, you can effectively profit from a bearish outlook on PANW while minimizing the risk of assignment.
Vertical Bull Put Spread Option Strategy
To analyze the most profitable vertical bull put spread options strategy for Palo Alto Networks, Inc. (PANW), we need to focus on selecting a combination of short and long put options that align with the target stock price movement of 2% over or under the current stock price. A vertical bull put spread involves selling a higher strike put option (short put) and buying a lower strike put option (long put) with the same expiration date. This strategy is designed to profit from a moderately bullish outlook while limiting downside risk.
Key Considerations:
- Minimizing Assignment Risk: Since the short put is at risk of being assigned if the stock price falls below the strike price, we want to select strike prices that are slightly out of the money (OTM) or at the money (ATM) relative to the target stock price. This reduces the likelihood of assignment.
- Maximizing Profit Potential: The maximum profit for a bull put spread is the net premium received (credit) from selling the short put minus the cost of buying the long put. We aim to maximize this credit while keeping the spread width (difference between strike prices) reasonable.
- Risk Management: The maximum loss is limited to the spread width minus the net premium received. We want to ensure that the potential loss is within acceptable limits.
Analysis of Potential Strategies:
Below are five vertical bull put spread strategies, ranging from near-term to long-term expirations, with strike prices selected to align with the 2% target stock price movement. The Greeks (Delta, Gamma, Theta, Vega) are used to assess the risk and reward profile of each strategy.
1. Near-Term Expiration (1-2 Weeks)
- Short Put: Strike price at 2% below the current stock price (slightly OTM).
- Long Put: Strike price 5% below the current stock price (further OTM).
- Greeks Analysis:
- Delta: The short put will have a higher Delta (closer to 0.5), indicating a higher probability of being in the money (ITM) if the stock declines. The long put will have a lower Delta, providing downside protection.
- Theta: High positive Theta for the short put, benefiting from time decay.
- Vega: Low Vega, as near-term options are less sensitive to volatility changes.
- Risk/Reward:
- Max Profit: Net premium received.
- Max Loss: Spread width (5% - 2%) minus net premium.
- Assignment Risk: Low, as the short put is slightly OTM.
2. Short-Term Expiration (3-4 Weeks)
- Short Put: Strike price at 1% below the current stock price (ATM).
- Long Put: Strike price 4% below the current stock price (OTM).
- Greeks Analysis:
- Delta: The short put will have a Delta closer to 0.5, while the long put will have a lower Delta.
- Theta: Moderate positive Theta, benefiting from time decay.
- Vega: Moderate Vega, as short-term options are somewhat sensitive to volatility.
- Risk/Reward:
- Max Profit: Net premium received.
- Max Loss: Spread width (4% - 1%) minus net premium.
- Assignment Risk: Moderate, as the short put is ATM.
3. Medium-Term Expiration (6-8 Weeks)
- Short Put: Strike price at 1.5% below the current stock price (slightly OTM).
- Long Put: Strike price 5% below the current stock price (OTM).
- Greeks Analysis:
- Delta: The short put will have a Delta around 0.4, while the long put will have a lower Delta.
- Theta: Moderate positive Theta, benefiting from time decay.
- Vega: Moderate Vega, as medium-term options are sensitive to volatility.
- Risk/Reward:
- Max Profit: Net premium received.
- Max Loss: Spread width (5% - 1.5%) minus net premium.
- Assignment Risk: Low, as the short put is slightly OTM.
4. Long-Term Expiration (3-4 Months)
- Short Put: Strike price at 2% below the current stock price (OTM).
- Long Put: Strike price 6% below the current stock price (OTM).
- Greeks Analysis:
- Delta: The short put will have a Delta around 0.3, while the long put will have a lower Delta.
- Theta: Lower positive Theta, as long-term options decay more slowly.
- Vega: Higher Vega, as long-term options are more sensitive to volatility changes.
- Risk/Reward:
- Max Profit: Net premium received.
- Max Loss: Spread width (6% - 2%) minus net premium.
- Assignment Risk: Low, as the short put is OTM.
5. Long-Term Expiration (6-12 Months)
- Short Put: Strike price at 3% below the current stock price (OTM).
- Long Put: Strike price 8% below the current stock price (OTM).
- Greeks Analysis:
- Delta: The short put will have a Delta around 0.2, while the long put will have a lower Delta.
- Theta: Low positive Theta, as long-term options decay very slowly.
- Vega: High Vega, as long-term options are highly sensitive to volatility.
- Risk/Reward:
- Max Profit: Net premium received.
- Max Loss: Spread width (8% - 3%) minus net premium.
- Assignment Risk: Very low, as the short put is significantly OTM.
Summary of Recommendations:
- Near-Term Expiration (1-2 Weeks): Best for traders seeking quick profits with low assignment risk.
- Short-Term Expiration (3-4 Weeks): Balances time decay and assignment risk for moderate traders.
- Medium-Term Expiration (6-8 Weeks): Offers a balance between time decay and volatility sensitivity.
- Long-Term Expiration (3-4 Months): Suitable for traders with a longer-term bullish outlook and lower assignment risk.
- Long-Term Expiration (6-12 Months): Ideal for traders willing to wait for larger premiums with minimal assignment risk.
Each strategy provides a balance between profit potential and risk management, with the near-term and short-term strategies offering higher Theta and lower Vega, while the long-term strategies provide lower assignment risk and higher Vega sensitivity. Choose the strategy that best aligns with your risk tolerance and market outlook.
Vertical Bear Call Spread Option Strategy
To construct a vertical bear call spread for Palo Alto Networks, Inc. (PANW), we aim to sell a higher strike call option and buy a lower strike call option with the same expiration date. This strategy is designed to profit from a bearish outlook on the stock, where we expect the stock price to remain below the sold strike price. The goal is to minimize the risk of assignment while maximizing the potential profit within the target range of 2% above or below the current stock price.
Key Considerations:
- Risk of Assignment: Since the short call is at a higher strike price, the risk of assignment is minimized if the stock price remains below the sold strike. However, if the stock price rises above the sold strike, the short call could be assigned, requiring us to sell shares at the strike price.
- Profit and Loss: The maximum profit is the net premium received (premium from the short call minus the premium paid for the long call). The maximum loss is the difference between the strike prices minus the net premium received.
- Greeks: Key Greeks to consider are:
- Theta: Positive theta is desirable as it indicates the position benefits from time decay.
- Vega: Negative vega is expected, as the strategy benefits from decreasing volatility.
- Delta: The net delta should be negative, reflecting a bearish outlook.
Strategy Analysis:
We will analyze five vertical bear call spreads, ranging from near-term to long-term expirations, focusing on strike prices within 2% of the current stock price.
1. Near-Term Expiration (1-2 Weeks):
- Short Call: Strike price 2% above the current stock price.
- Long Call: Strike price 1% above the current stock price.
- Analysis:
- This spread has a high theta, benefiting from rapid time decay.
- The short call is slightly out of the money, minimizing assignment risk.
- Maximum profit is limited but achievable if the stock remains below the short strike.
- Maximum loss is the difference between the strikes minus the net premium.
- Risk/Reward: High reward relative to risk due to the short time frame, but the stock must remain below the short strike.
2. Short-Term Expiration (3-4 Weeks):
- Short Call: Strike price 2% above the current stock price.
- Long Call: Strike price 1% above the current stock price.
- Analysis:
- This spread balances time decay and assignment risk.
- The short call is still out of the money, reducing the likelihood of assignment.
- Theta is positive but lower than the near-term spread.
- Maximum profit is slightly higher than the near-term spread due to higher premiums.
- Risk/Reward: Moderate reward with manageable risk, suitable for a slightly longer time horizon.
3. Medium-Term Expiration (6-8 Weeks):
- Short Call: Strike price 2% above the current stock price.
- Long Call: Strike price 1% above the current stock price.
- Analysis:
- This spread benefits from a longer time frame, allowing for more time decay.
- The short call remains out of the money, minimizing assignment risk.
- Theta is positive but lower than shorter-term spreads.
- Maximum profit is higher due to higher premiums.
- Risk/Reward: Higher potential reward with slightly increased risk due to the longer time frame.
4. Long-Term Expiration (3-4 Months):
- Short Call: Strike price 2% above the current stock price.
- Long Call: Strike price 1% above the current stock price.
- Analysis:
- This spread benefits from significant time decay over the longer period.
- The short call is out of the money, but the longer time frame increases the risk of the stock moving above the strike.
- Theta is positive but lower than shorter-term spreads.
- Maximum profit is higher due to higher premiums.
- Risk/Reward: Higher potential reward but with increased risk of assignment due to the longer time frame.
5. Long-Term Expiration (6-12 Months):
- Short Call: Strike price 2% above the current stock price.
- Long Call: Strike price 1% above the current stock price.
- Analysis:
- This spread benefits from the highest premiums but carries the highest risk of assignment.
- The short call is out of the money, but the extended time frame increases the likelihood of the stock moving above the strike.
- Theta is positive but lower than shorter-term spreads.
- Maximum profit is the highest among all spreads due to the highest premiums.
- Risk/Reward: Highest potential reward but with the highest risk of assignment.
Conclusion:
The most profitable vertical bear call spread depends on the trader's risk tolerance and time horizon. For minimal assignment risk and quick profits, the near-term spread (1-2 weeks) is ideal. For higher premiums and a balanced risk/reward profile, the medium-term spread (6-8 weeks) is recommended. For maximum profit potential, the long-term spread (6-12 months) offers the highest premiums but carries the highest risk of assignment.
By carefully selecting strike prices within 2% of the current stock price and considering the Greeks, particularly theta and delta, we can construct a vertical bear call spread that aligns with our bearish outlook while minimizing assignment risk.
Vertical Bull Call Spread Option Strategy
To construct a vertical bull call spread strategy for Palo Alto Networks, Inc. (PANW), we focus on buying a call option at a lower strike price and simultaneously selling a call option at a higher strike price, both with the same expiration date. This strategy is designed to profit from a moderate rise in the stock price while minimizing the risk of assignment and limiting potential losses. The target stock price is 2% above or below the current stock price, so we will select strike prices that align with this range.
Key Considerations:
- Minimizing Assignment Risk: To reduce the risk of having shares assigned, we prioritize options that are slightly out of the money (OTM) or at the money (ATM) for the long call. The short call should be far enough OTM to minimize the likelihood of assignment.
- Profit and Loss Scenarios: The maximum profit is capped at the difference between the strike prices minus the net premium paid. The maximum loss is limited to the net premium paid.
- Greeks Analysis: We focus on Delta (sensitivity to price changes), Theta (time decay), and Vega (sensitivity to volatility) to evaluate the strategy's profitability and risk.
Five Vertical Bull Call Spread Choices:
1. Near-Term Expiration (2-4 Weeks)
- Long Call: Strike price slightly below the current stock price (ATM or slightly OTM).
- Short Call: Strike price 2-3% above the current stock price.
- Analysis:
- Delta: The long call will have a higher Delta (e.g., 0.50-0.60), indicating a strong sensitivity to price changes.
- Theta: The short call will benefit from time decay, reducing the net premium paid.
- Vega: Lower Vega reduces sensitivity to volatility changes, making this strategy less risky in volatile markets.
- Risk/Reward:
- Maximum profit is achieved if the stock rises to the short call strike price.
- Maximum loss is limited to the net premium paid.
- Assignment Risk: Low, as the short call is OTM.
2. Mid-Term Expiration (1-2 Months)
- Long Call: Strike price slightly below the current stock price (ATM).
- Short Call: Strike price 3-4% above the current stock price.
- Analysis:
- Delta: The long call will have a moderate Delta (e.g., 0.45-0.55).
- Theta: The short call will still benefit from time decay, but less than in the near-term strategy.
- Vega: Moderate sensitivity to volatility changes.
- Risk/Reward:
- Higher potential profit due to the wider spread between strike prices.
- Maximum loss remains limited to the net premium paid.
- Assignment Risk: Low, as the short call is OTM.
3. Long-Term Expiration (3-6 Months)
- Long Call: Strike price slightly below the current stock price (ATM).
- Short Call: Strike price 5-7% above the current stock price.
- Analysis:
- Delta: The long call will have a lower Delta (e.g., 0.40-0.50), reflecting reduced sensitivity to price changes over a longer period.
- Theta: Time decay is less impactful, but the strategy benefits from a wider spread.
- Vega: Higher sensitivity to volatility changes, making this strategy more suitable for stable or bullish markets.
- Risk/Reward:
- Higher potential profit due to the wider spread.
- Maximum loss remains limited to the net premium paid.
- Assignment Risk: Very low, as the short call is far OTM.
4. Near-Term Expiration with Narrow Spread (1-2 Weeks)
- Long Call: Strike price slightly below the current stock price (ATM).
- Short Call: Strike price 1-2% above the current stock price.
- Analysis:
- Delta: The long call will have a high Delta (e.g., 0.60-0.70), indicating strong sensitivity to price changes.
- Theta: The short call will benefit significantly from time decay.
- Vega: Low sensitivity to volatility changes.
- Risk/Reward:
- Lower potential profit due to the narrow spread.
- Maximum loss is limited to the net premium paid.
- Assignment Risk: Moderate, as the short call is closer to the current stock price.
5. Long-Term Expiration with Wide Spread (6-12 Months)
- Long Call: Strike price slightly below the current stock price (ATM).
- Short Call: Strike price 8-10% above the current stock price.
- Analysis:
- Delta: The long call will have a lower Delta (e.g., 0.35-0.45), reflecting reduced sensitivity to price changes over a longer period.
- Theta: Time decay is minimal, but the strategy benefits from a very wide spread.
- Vega: High sensitivity to volatility changes, making this strategy more suitable for stable or bullish markets.
- Risk/Reward:
- Highest potential profit due to the very wide spread.
- Maximum loss remains limited to the net premium paid.
- Assignment Risk: Very low, as the short call is far OTM.
Summary of Risk and Reward:
- Near-Term Expiration (2-4 Weeks): Lower potential profit but higher probability of success due to time decay. Low assignment risk.
- Mid-Term Expiration (1-2 Months): Balanced risk/reward with moderate profit potential and low assignment risk.
- Long-Term Expiration (3-6 Months): Higher potential profit with very low assignment risk, but higher sensitivity to volatility.
- Near-Term Expiration with Narrow Spread (1-2 Weeks): Lower profit potential and moderate assignment risk, but quick time decay benefits.
- Long-Term Expiration with Wide Spread (6-12 Months): Highest profit potential with very low assignment risk, but requires a strong bullish outlook.
By selecting the appropriate expiration and strike prices, you can tailor the vertical bull call spread to your risk tolerance and profit objectives while minimizing the risk of assignment.
Spread Option Strategy
To construct a profitable calendar spread options strategy for Palo Alto Networks, Inc. (PANW), we will focus on buying a call option and selling a put option while minimizing the risk of assignment. The target stock price is within 2% of the current stock price, so we will select strike prices and expiration dates that align with this range. The goal is to maximize profitability while managing risk, particularly the risk of early assignment on the short put option.
Key Considerations:
- Minimizing Assignment Risk: Since we are selling a put option, we want to avoid being assigned shares. This means selecting a strike price that is slightly out of the money (OTM) or at the money (ATM) for the short put, reducing the likelihood of the stock price falling below the strike price.
- Target Price Range: The target stock price is within 2% of the current price, so we will focus on strike prices within this range.
- Time Decay (Theta): Calendar spreads benefit from the faster decay of the near-term option (the short put) compared to the longer-term option (the long call). We will prioritize options with favorable Theta values.
- Volatility (Vega): Since PANW is a volatile stock, we will consider options with lower Vega to reduce sensitivity to volatility changes.
- Delta and Gamma: We will aim for a balanced Delta to ensure the strategy is not overly sensitive to small price movements, while Gamma should be moderate to avoid excessive risk.
Strategy Analysis and Recommendations:
1. Near-Term Expiration (30-45 Days)
- Long Call: Buy a call option with a strike price 2% above the current stock price and an expiration date 90-120 days out. This provides time for the stock to move into the target range while benefiting from time decay.
- Short Put: Sell a put option with a strike price 1% below the current stock price and an expiration date 30-45 days out. This strike is slightly OTM, reducing assignment risk while collecting premium.
- Risk/Reward: The maximum loss is limited to the premium paid for the long call minus the premium received for the short put. The maximum profit occurs if the stock price is near the short put strike at expiration, allowing the short put to expire worthless while the long call gains value.
2. Mid-Term Expiration (60-90 Days)
- Long Call: Buy a call option with a strike price 1% above the current stock price and an expiration date 120-150 days out. This strike is closer to the current price, increasing the likelihood of profitability.
- Short Put: Sell a put option with a strike price 2% below the current stock price and an expiration date 60-90 days out. This strike is further OTM, further reducing assignment risk.
- Risk/Reward: The risk is similar to the near-term strategy, but the longer time frame allows for more potential price movement. The reward is higher if the stock price remains stable or rises slightly.
3. Long-Term Expiration (120-150 Days)
- Long Call: Buy a call option with a strike price at the current stock price (ATM) and an expiration date 180-210 days out. This strike maximizes the potential for profit if the stock price rises.
- Short Put: Sell a put option with a strike price 2% below the current stock price and an expiration date 120-150 days out. This strike is OTM, minimizing assignment risk.
- Risk/Reward: The longer time frame increases the potential for larger price movements, but the risk of assignment on the short put remains low. The reward is significant if the stock price rises above the long call strike.
4. Combined Near- and Mid-Term Expiration
- Long Call: Buy a call option with a strike price 1% above the current stock price and an expiration date 120-150 days out.
- Short Put: Sell a put option with a strike price 1% below the current stock price and an expiration date 45-60 days out.
- Risk/Reward: This strategy balances the benefits of near-term time decay with the potential for mid-term price movement. The risk is moderate, with a higher likelihood of profitability if the stock price remains within the target range.
5. Conservative Long-Term Expiration
- Long Call: Buy a call option with a strike price 2% above the current stock price and an expiration date 210-240 days out.
- Short Put: Sell a put option with a strike price 3% below the current stock price and an expiration date 150-180 days out.
- Risk/Reward: This is the most conservative strategy, with the lowest risk of assignment and the highest potential for profit if the stock price rises significantly. The downside is the higher premium cost for the long call.
Profit and Loss Scenarios:
- Best-Case Scenario: The stock price remains within the target range (2% above or below the current price) at the expiration of the short put. The short put expires worthless, and the long call gains value as the stock price rises.
- Worst-Case Scenario: The stock price falls significantly below the short put strike, leading to assignment of shares. The long call loses value, but the loss is partially offset by the premium received from the short put.
- Break-Even Point: The break-even point depends on the premiums paid and received. For example, if the net premium paid is $2, the stock price must rise by at least $2 for the strategy to be profitable.
Conclusion:
The most profitable calendar spread strategy depends on your risk tolerance and time horizon. For aggressive traders, the near-term expiration strategy offers the highest potential return with moderate risk. For conservative traders, the long-term expiration strategy provides the lowest risk of assignment and the highest potential for profit if the stock price rises significantly. Always monitor the position and adjust as needed to manage risk and maximize profitability.
Calendar Spread Option Strategy #1
To construct a profitable calendar spread options strategy for Palo Alto Networks, Inc. (PANW) using a long put and a short call, we need to carefully analyze the Greeks and the risk-reward profile of the strategy. The goal is to minimize the risk of assignment on the short call while maximizing the potential profit from the long put. The target stock price is 2% above or below the current stock price, so we will focus on strike prices within this range.
Key Considerations:
- Time Decay (Theta): Calendar spreads benefit from the accelerated time decay of the short-term option relative to the long-term option. We want the short call to decay faster than the long put.
- Volatility (Vega): A decrease in implied volatility (IV) benefits the short call, while an increase in IV benefits the long put. We aim for a net positive Vega to capitalize on potential volatility changes.
- Delta and Gamma: The long put should have a higher Delta (more sensitive to price changes) than the short call to ensure the strategy profits from a downward move in the stock price. Gamma should be managed to avoid excessive risk from large price swings.
- Assignment Risk: The short call should be out-of-the-money (OTM) to minimize the risk of early assignment. The long put should be slightly in-the-money (ITM) or at-the-money (ATM) to maximize its intrinsic value.
Strategy Analysis:
We will evaluate five calendar spread combinations, ranging from near-term to long-term expirations, with strike prices within 2% of the current stock price.
1. Near-Term Spread (30-60 Days)
- Long Put: Strike price 2% below the current stock price, expiration in 60 days.
- Short Call: Strike price 2% above the current stock price, expiration in 30 days.
Risk/Reward: - Reward: The long put benefits from a downward move, while the short call decays rapidly due to its near-term expiration. The maximum profit occurs if the stock price is near the short call strike at expiration. - Risk: If the stock price rises sharply, the short call could be assigned, requiring the sale of shares at the strike price. The long put would lose value, but the loss is capped by the premium received from the short call.
Greeks: - Theta: Positive (benefits from time decay of the short call). - Vega: Slightly positive (long put benefits from IV increases). - Delta: Negative (profits from a downward move).
2. Medium-Term Spread (60-90 Days)
- Long Put: Strike price 1% below the current stock price, expiration in 90 days.
- Short Call: Strike price 1% above the current stock price, expiration in 60 days.
Risk/Reward: - Reward: The long put has more time to benefit from a downward move, while the short call decays over the medium term. The spread profits if the stock price remains near the short call strike. - Risk: Assignment risk is lower than the near-term spread due to the longer time frame. However, a sharp upward move could still result in assignment.
Greeks: - Theta: Positive (time decay favors the short call). - Vega: Positive (long put benefits from IV increases). - Delta: Negative (profits from a downward move).
3. Balanced Spread (90-120 Days)
- Long Put: Strike price at the current stock price, expiration in 120 days.
- Short Call: Strike price 2% above the current stock price, expiration in 90 days.
Risk/Reward: - Reward: The long put is ATM, providing significant downside protection. The short call is OTM, reducing assignment risk. The spread profits if the stock price remains stable or declines slightly. - Risk: A sharp upward move could result in assignment, but the long put limits losses.
Greeks: - Theta: Positive (time decay favors the short call). - Vega: Positive (long put benefits from IV increases). - Delta: Slightly negative (profits from a downward move).
4. Long-Term Spread (120-180 Days)
- Long Put: Strike price 2% below the current stock price, expiration in 180 days.
- Short Call: Strike price 1% above the current stock price, expiration in 120 days.
Risk/Reward: - Reward: The long put has significant time to benefit from a downward move, while the short call decays over the long term. The spread profits if the stock price remains near the short call strike. - Risk: Assignment risk is low due to the longer time frame, but a sharp upward move could still result in assignment.
Greeks: - Theta: Positive (time decay favors the short call). - Vega: Positive (long put benefits from IV increases). - Delta: Negative (profits from a downward move).
5. Ultra-Long-Term Spread (180-365 Days)
- Long Put: Strike price 1% below the current stock price, expiration in 365 days.
- Short Call: Strike price 2% above the current stock price, expiration in 180 days.
Risk/Reward: - Reward: The long put has substantial time to benefit from a downward move, while the short call decays over the ultra-long term. The spread profits if the stock price remains near the short call strike. - Risk: Assignment risk is minimal due to the extended time frame, but a sharp upward move could still result in assignment.
Greeks: - Theta: Positive (time decay favors the short call). - Vega: Positive (long put benefits from IV increases). - Delta: Slightly negative (profits from a downward move).
Conclusion:
The most profitable calendar spread strategy depends on the desired time horizon and risk tolerance. For near-term traders, the 30-60 day spread offers rapid time decay but higher assignment risk. For long-term traders, the 180-365 day spread provides significant downside protection with minimal assignment risk. The balanced 90-120 day spread is ideal for traders seeking a middle ground between risk and reward.
By carefully selecting strike prices and expiration dates, we can construct a calendar spread that maximizes profit potential while minimizing the risk of assignment.
Calendar Spread Option Strategy #2
To construct a profitable calendar spread options strategy for Palo Alto Networks, Inc. (PANW), we will focus on selling a near-term put option and buying a longer-term call option. This strategy aims to capitalize on time decay (theta) and volatility differences between the two expiration dates while minimizing the risk of early assignment on the short put. The target stock price is within 2% of the current stock price, so we will select strike prices close to this range.
Key Considerations:
- Minimizing Assignment Risk: Since we are selling a put, we want to avoid the stock falling below the strike price, which could lead to assignment. Therefore, we will select a strike price slightly below the current stock price but within the 2% target range.
- Maximizing Theta Decay: The short put should have a high theta, meaning it will lose value quickly as time passes. The long call should have a lower theta, allowing us to benefit from the time decay of the short put.
- Volatility Considerations: We want the short put to have higher implied volatility (IV) than the long call, as this will increase the premium received and provide a cushion against potential losses.
- Delta and Gamma: The short put should have a moderate delta (e.g., -0.3 to -0.4) to balance risk and reward. The long call should have a positive delta (e.g., 0.4 to 0.6) to benefit from upward price movement.
Five Calendar Spread Strategy Choices:
1. Near-Term Put (1 Month) + Long-Term Call (3 Months)
- Short Put: Sell a 1-month put with a strike price 2% below the current stock price. This option will have a high theta, allowing us to profit from rapid time decay.
- Long Call: Buy a 3-month call with a strike price 2% above the current stock price. This option will have a lower theta and a positive delta, benefiting from upward price movement.
- Risk/Reward: The maximum loss is limited to the difference between the strike prices minus the net premium received. The maximum profit is the net premium received if the stock remains between the strike prices at the short put's expiration.
2. Near-Term Put (2 Weeks) + Long-Term Call (2 Months)
- Short Put: Sell a 2-week put with a strike price 1.5% below the current stock price. This option will have an even higher theta, accelerating time decay.
- Long Call: Buy a 2-month call with a strike price 2% above the current stock price. This option will have a moderate delta and lower theta.
- Risk/Reward: The risk of assignment is slightly higher due to the shorter expiration, but the reward is greater due to the higher theta of the short put.
3. Near-Term Put (1 Month) + Long-Term Call (6 Months)
- Short Put: Sell a 1-month put with a strike price 2% below the current stock price. This option will have a high theta and moderate delta.
- Long Call: Buy a 6-month call with a strike price 2% above the current stock price. This option will have a lower theta and a higher delta, providing more upside potential.
- Risk/Reward: The longer expiration of the call reduces the risk of assignment on the short put, but the longer time frame increases the potential for volatility changes.
4. Near-Term Put (3 Weeks) + Long-Term Call (4 Months)
- Short Put: Sell a 3-week put with a strike price 1.8% below the current stock price. This option will have a very high theta, maximizing time decay.
- Long Call: Buy a 4-month call with a strike price 2% above the current stock price. This option will have a moderate delta and lower theta.
- Risk/Reward: The short put's high theta provides significant premium decay, but the risk of assignment increases as the expiration approaches.
5. Near-Term Put (1 Month) + Long-Term Call (1 Year)
- Short Put: Sell a 1-month put with a strike price 2% below the current stock price. This option will have a high theta and moderate delta.
- Long Call: Buy a 1-year call with a strike price 2% above the current stock price. This option will have a low theta and a high delta, providing significant upside potential.
- Risk/Reward: The long expiration of the call reduces the risk of assignment on the short put, but the longer time frame increases the potential for volatility changes and time decay on the call.
Profit and Loss Scenarios:
- Best-Case Scenario: The stock remains between the strike prices at the short put's expiration. The short put expires worthless, and the long call retains its value, allowing us to profit from the net premium received.
- Worst-Case Scenario: The stock falls significantly below the short put's strike price, leading to assignment. The long call may lose value, but the loss is partially offset by the premium received from the short put.
- Moderate Scenario: The stock rises above the long call's strike price, allowing us to profit from the call's appreciation while the short put expires worthless.
Quantifying Risk and Reward:
- Risk: The primary risk is assignment on the short put if the stock falls below the strike price. This risk is minimized by selecting strike prices close to the current stock price and focusing on near-term expirations.
- Reward: The reward is the net premium received from the short put, which is maximized by selecting options with high theta and moderate delta.
Conclusion:
The most profitable calendar spread strategy depends on your risk tolerance and time horizon. For aggressive traders, the 2-week put + 2-month call combination offers the highest theta decay and potential reward. For more conservative traders, the 1-month put + 6-month call combination provides a balance between risk and reward. Always monitor the position for early assignment risk and adjust as necessary.
Similar Companies in Software - Infrastructure:
Zscaler, Inc. (ZS), Cloudflare, Inc. (NET), Okta, Inc. (OKTA), Adobe Inc. (ADBE), UiPath Inc. (PATH), Nutanix, Inc. (NTNX), CrowdStrike Holdings, Inc. (CRWD), Microsoft Corporation (MSFT), Report: Oracle Corporation (ORCL), Oracle Corporation (ORCL), Block, Inc. (SQ), Report: MongoDB, Inc. (MDB), MongoDB, Inc. (MDB), Fortinet, Inc. (FTNT), Cisco Systems, Inc. (CSCO), Check Point Software Technologies Ltd. (CHKP), FireEye, Inc. (FEYE), Proofpoint, Inc. (PFPT), Symantec Corporation (SYMC), Rapid7, Inc. (RPD), Tenable Holdings, Inc. (TENB)
https://www.youtube.com/watch?v=GsEH-Pt8K2s
https://www.fool.com/investing/2025/01/08/why-palo-alto-networks-stock-dropped-on-wednesday/
https://www.fool.com/investing/2025/01/12/history-says-the-sp-500-will-surge-in-2025-2-stock/
https://www.benzinga.com/25/01/42971558/top-2-tech-stocks-that-may-keep-you-up-at-night-in-q1
https://www.fool.com/investing/2025/01/16/got-5000-tech-stocks-to-buy-and-hold/
https://www.fool.com/investing/2025/01/20/soundhound-ai-stock-vs-palo-alto-networks-stock-wa/
https://www.fool.com/investing/2025/01/21/why-palo-alto-networks-stock-is-jumping-today/
https://www.youtube.com/watch?v=DEwdGHaKi2k
https://finance.yahoo.com/news/palo-alto-networks-inc-panw-015327361.html
https://finance.yahoo.com/news/palo-alto-networks-inc-panw-015545653.html
https://finance.yahoo.com/news/rivian-says-other-automakers-knocking-042927998.html
https://www.fool.com/investing/2025/01/24/is-palo-alto-networks-stock-a-buy/
https://www.sec.gov/Archives/edgar/data/1327567/000132756724000040/panw-20241031.htm
Copyright © 2025 Tiny Computers (email@tinycomputers.io)
Report ID: xho4CX
Cost: $0.00000
https://reports.tinycomputers.io/PANW/PANW-2025-01-26.html Home