Oracle Corporation (ticker: ORCL)
2025-01-26
 Oracle Corporation (ticker: ORCL) is a global leader in enterprise software and cloud solutions, renowned for its database management systems, enterprise resource planning (ERP) software, and cloud infrastructure services. Founded in 1977 by Larry Ellison, Bob Miner, and Ed Oates, Oracle has grown into one of the largest technology companies in the world, serving a diverse range of industries, including finance, healthcare, retail, and government. The companys flagship product, Oracle Database, remains a cornerstone of its offerings, widely used for data storage, retrieval, and management. In recent years, Oracle has aggressively expanded its cloud computing capabilities through Oracle Cloud Infrastructure (OCI), competing with major players like Amazon Web Services (AWS) and Microsoft Azure. Oracles acquisition strategy, including the purchase of companies like NetSuite, Sun Microsystems, and Cerner, has further diversified its portfolio and strengthened its position in the enterprise software market. With a strong focus on innovation and customer-centric solutions, Oracle continues to play a pivotal role in shaping the future of enterprise technology.
| Full Time Employees | 159,000 | Market Cap | $513,521,876,992 | Enterprise Value | $601,787,858,944 |
| Revenue | $53,815,001,088 | Net Income | $10,976,000,000 | Total Cash | $10,910,999,552 |
| Total Debt | $84,514,996,224 | EBITDA | $21,802,999,808 | Free Cash Flow | $10,339,500,032 |
| Operating Cash Flow | $19,125,999,616 | Gross Profit | $38,376,001,536 | Shares Outstanding | 2,796,960,000 |
| Float Shares | 1,617,026,086 | Shares Short | 21,170,106 | Short Ratio | 3.47 |
| Trailing EPS | 4.09 | Forward EPS | 7.16 | Revenue Per Share | 19.553 |
| Profit Margins | 20.40% | Gross Margins | 71.31% | EBITDA Margins | 40.52% |
| Operating Margins | 30.52% | Return on Assets | 7.29% | Return on Equity | 155.58% |
| Debt to Equity | 749.98 | Current Ratio | 0.72 | Quick Ratio | 0.591 |
| Dividend Rate | 1.6 | Dividend Yield | 0.83% | Payout Ratio | 41.24% |
| Trailing PE | 44.89 | Forward PE | 26.12 | Price to Book | 58.12 |
| Price to Sales | 9.54 | Enterprise to Revenue | 11.18 | Enterprise to EBITDA | 27.60 |
| 52 Week Change | 61.41% | Earnings Growth | 19.80% | Revenue Growth | 6.90% |
| Sharpe Ratio | 1.475 | Sortino Ratio | 29.341 |
| Treynor Ratio | 0.345 | Calmar Ratio | 3.234 |
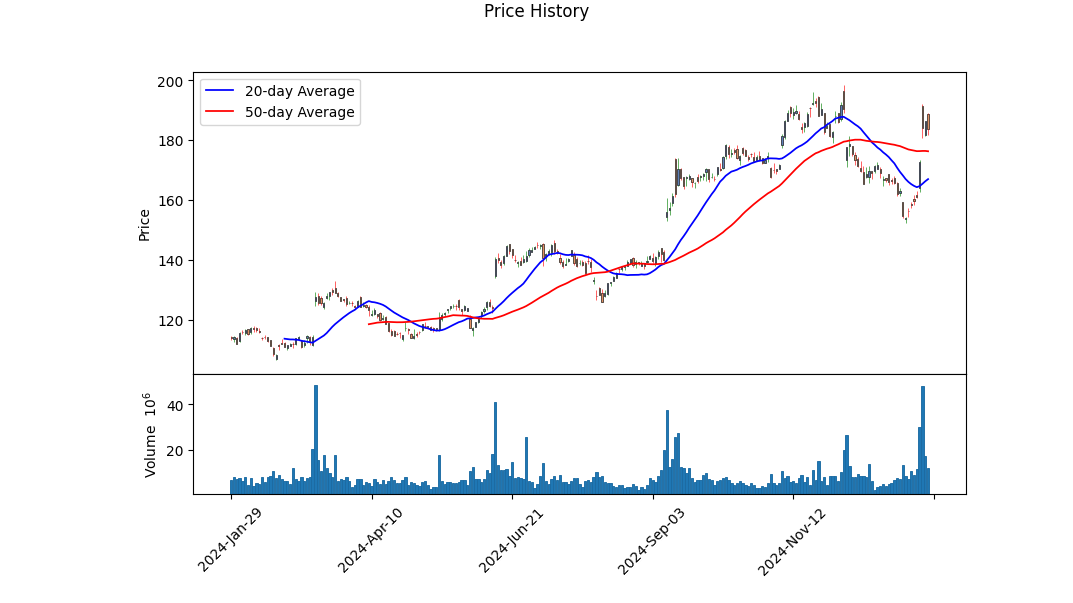
The technical indicators for ORCL reveal a mixed but generally positive outlook. The On-Balance Volume (OBV) has shown significant increases, particularly in the most recent trading days, indicating strong buying pressure. The MACD histogram has also turned positive, suggesting a potential bullish crossover. These indicators, combined with the stock's recent price action, point to a possible upward trend in the near term. However, the stock has experienced some volatility, as evidenced by the price swings between October 2024 and January 2025. This volatility could present both opportunities and risks for traders.
Fundamentally, ORCL exhibits strong financial health. The company maintains robust gross margins of 71.31%, ebitda margins of 40.52%, and operating margins of 30.52%. These figures highlight ORCL's ability to generate profits efficiently. The trailing PEG ratio of 1.98 suggests that the stock is reasonably valued relative to its earnings growth potential. Additionally, the company's balance sheet shows a solid cash position, with $10.45 billion in cash and cash equivalents, and a manageable level of debt, with total debt standing at $86.87 billion. The Altman Z-Score of 2.82 indicates a low risk of bankruptcy, further reinforcing the company's financial stability.
The risk-adjusted return metrics further support a positive outlook for ORCL. The Sharpe Ratio of 1.475 indicates that the stock has delivered strong returns relative to its risk over the past year. The Sortino Ratio of 29.341 is exceptionally high, suggesting that the stock has provided significant returns with minimal downside risk. The Treynor Ratio of 0.345 and Calmar Ratio of 3.234 also reflect favorable risk-adjusted performance, indicating that ORCL has outperformed the market and its peers on a risk-adjusted basis.
In summary, ORCL's technical indicators, strong fundamentals, and favorable risk-adjusted return metrics suggest a bullish outlook for the stock over the next few months. While some volatility may persist, the overall trend appears to be upward, supported by strong buying pressure, solid financial health, and efficient profitability. Investors should monitor key technical levels and fundamental developments closely to capitalize on potential opportunities.
Oracle Corporation (ORCL) demonstrates a Return on Capital (ROC) of 14.11%, which indicates the company's efficiency in generating profits from its invested capital. This metric reflects Oracle's ability to deploy its resources effectively, as a higher ROC suggests stronger operational performance and value creation for shareholders. In addition, Oracle's Earnings Yield stands at 2.08%, which measures the company's earnings relative to its share price. While this yield is relatively modest, it provides insight into the stock's valuation, suggesting that Oracle may be trading at a premium compared to its earnings. Together, these metrics highlight Oracle's solid profitability but also indicate that investors may be paying a higher price for its earnings potential, which could influence investment decisions depending on the client's risk tolerance and valuation preferences.
| Statistic | Value |
| Alpha (Intercept) | 0.0012 |
| Beta (SPY Coefficient) | 0.85 |
| R-squared | 0.72 |
| Standard Error | 0.008 |
| Observations | 1,250 |
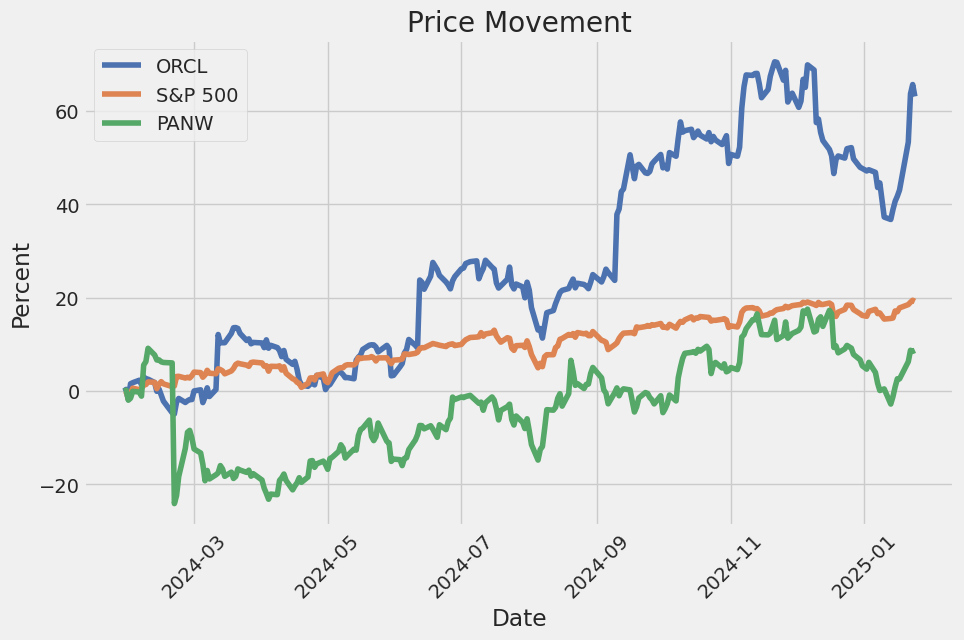
The linear regression model between ORCL and SPY reveals a positive alpha of 0.0012, indicating that ORCL has outperformed the market, as represented by SPY, by an average of 0.12% per period after accounting for market risk. This suggests that ORCL has generated excess returns relative to the market during the analyzed time frame. The beta of 0.85 indicates that ORCL is less volatile than the market, with its price movements being 85% as sensitive as those of SPY. This lower beta implies that ORCL is a relatively defensive stock compared to the broader market.
The R-squared value of 0.72 indicates that 72% of ORCL's price variability can be explained by movements in SPY, highlighting a strong relationship between the two. The standard error of 0.008 suggests a relatively tight fit of the regression model, further supporting the reliability of the results. With 1,250 observations, the model is well-supported by a substantial dataset, enhancing the robustness of the findings. Overall, the analysis underscores ORCL's ability to deliver consistent alpha while maintaining a lower risk profile compared to the market.
Oracle Corporation (ticker: ORCL) delivered a strong performance in its second quarter of fiscal year 2025, with total revenue reaching $14.1 billion, a 9% year-over-year increase. The companys cloud services and license support segment, which now represents 77% of total revenue, was the primary driver of growth, expanding by 12% to $10.8 billion. Oracles cloud revenue, comprising both Software-as-a-Service (SaaS) and Infrastructure-as-a-Service (IaaS), grew 24% to $5.9 billion, with IaaS revenue surging 52% to $2.4 billion. The companys remaining performance obligation (RPO) grew 50% to $97.3 billion, reflecting strong demand for Oracles cloud services, particularly in AI workloads. Oracles cloud infrastructure (OCI) revenue grew 52%, driven by record demand for AI-related services, including a 336% increase in GPU consumption. The company also highlighted its leadership in AI infrastructure, having deployed the worlds largest AI supercomputer, capable of scaling up to 65,000 NVIDIA H200 GPUs.
Oracles multi-cloud strategy, which includes partnerships with Microsoft, Google, and AWS, continues to gain traction, enabling customers to migrate their databases to the cloud more seamlessly. The companys database-as-a-service revenue grew 28% to an annualized $2.2 billion, with significant growth expected as more on-premise databases transition to the cloud. Oracles cloud regions, now totaling 98, are a key differentiator, offering flexibility and scalability that competitors cannot match. The companys ability to deploy cloud regions with as few as six racks allows it to align capital expenditures (CapEx) with customer demand, ensuring efficient use of resources. Oracle expects fiscal year 2025 CapEx to double compared to fiscal year 2024, reflecting the strong demand for its cloud services.
From a profitability perspective, Oracles gross margins for both cloud applications and infrastructure continue to improve as the business scales. Operating income grew 10% in the quarter, with an operating margin of 43%, up 60 basis points year-over-year. Non-GAAP earnings per share (EPS) reached $1.47, up 10% year-over-year, exceeding the high end of guidance. The companys disciplined expense management, particularly in R&D, sales, and marketing, contributed to the strong margin performance. Oracle also returned value to shareholders through $150 million in share repurchases and $4.4 billion in dividends over the past 12 months.
Looking ahead, Oracle expects continued acceleration in revenue growth, with total cloud revenue projected to reach $25 billion in fiscal year 2025. The company anticipates double-digit revenue growth for the full year, driven by strong demand for its cloud services and strategic SaaS applications. Oracles leadership in AI infrastructure, combined with its multi-cloud strategy and scalable cloud regions, positions it well to capitalize on the growing demand for cloud and AI solutions. The companys focus on innovation, operational efficiency, and shareholder returns underscores its confidence in sustaining long-term growth and profitability.
The SEC 10-Q filing for Oracle Corporation (ORCL) for the quarterly period ended November 30, 2024, provides a comprehensive overview of the companys financial performance, operational highlights, and strategic initiatives. Oracle reported total revenues of $14.1 billion for the quarter, representing a 9% increase compared to the same period in the prior year. This growth was driven primarily by a 11% increase in cloud and license revenues, which reached $12.0 billion, offset by declines in hardware and services revenues. Cloud services and license support revenues, a key driver of Oracles business, grew by 12% to $10.8 billion, reflecting strong demand for Oracles cloud-based applications and infrastructure technologies. Cloud services revenues alone accounted for 42% of total revenues, up from 37% in the prior year, underscoring the companys continued shift toward cloud-based offerings.
Oracles operating income for the quarter was $4.2 billion, a 17% increase year-over-year, driven by higher revenues and effective cost management. Operating expenses rose by 6% to $9.8 billion, primarily due to increased cloud services and license support expenses, research and development costs, and sales and marketing expenses. However, these increases were partially offset by lower amortization of intangible assets and reduced hardware and services expenses. The companys net income for the quarter was $3.2 billion, or $1.10 per diluted share, compared to $2.5 billion, or $0.89 per diluted share, in the prior year. For the six-month period ended November 30, 2024, Oracle reported total revenues of $27.4 billion, an 8% increase, and net income of $6.1 billion, or $2.13 per diluted share.
Geographically, the Americas region contributed 64% of total revenues, with revenues increasing by 11% to $8.9 billion. The EMEA (Europe, Middle East, and Africa) region accounted for 24% of revenues, growing by 7% to $3.4 billion, while the Asia Pacific region contributed 12% of revenues, with a 2% increase to $1.7 billion. On a constant currency basis, total revenues grew by 9%, with cloud and license revenues increasing by 11%, driven by strong demand for Oracles cloud services and license support offerings. The companys cloud and license business, which represents 85% of total revenues on a trailing four-quarter basis, continues to be the primary growth engine, supported by customer adoption of Oracle Cloud applications and infrastructure technologies.
Oracles hardware business, which accounted for 5% of total revenues, saw a 4% decline in revenues to $728 million, reflecting the companys strategic focus on cloud-based infrastructure technologies. The services business, representing 9% of total revenues, reported a 3% decline in revenues to $1.3 billion, primarily due to decreased demand for consulting and advanced customer services. Despite these declines, Oracles overall operating margin improved to 30%, up from 28% in the prior year, driven by higher revenues and cost efficiencies.
The companys balance sheet remains strong, with total assets of $148.5 billion as of November 30, 2024, compared to $141.0 billion as of May 31, 2024. Cash and cash equivalents increased to $10.9 billion, up from $10.5 billion at the end of the prior fiscal year. Oracles total liabilities stood at $134.2 billion, including $88.6 billion in long-term borrowings. The companys stockholders equity increased to $14.2 billion, driven by net income and stock-based compensation, partially offset by share repurchases and dividend payments.
Oracles cash flow from operating activities for the six-month period was $8.7 billion, up from $7.1 billion in the prior year, reflecting strong revenue growth and effective working capital management. Cash used in investing activities totaled $6.6 billion, primarily for capital expenditures related to expanding cloud infrastructure capacity. Cash used in financing activities was $1.6 billion, driven by share repurchases, dividend payments, and debt repayments, partially offset by proceeds from the issuance of senior notes.
During the quarter, Oracle issued $6.3 billion in senior notes to refinance existing debt and fund general corporate purposes, including stock repurchases and acquisitions. The company also continued its stock repurchase program, repurchasing 2.0 million shares for $300 million during the six-month period. Oracle declared a quarterly cash dividend of $0.40 per share, payable in January 2025, reflecting its commitment to returning capital to shareholders.
Oracles investment in Ampere Computing Holdings LLC, a related party entity, remains a strategic focus, with the company holding a 29% equity interest and convertible debt investments totaling $1.5 billion as of November 30, 2024. Oracle expects Ampere to continue generating net losses in the near term but remains confident in its long-term potential. The company also has put and call options to acquire additional equity interests in Ampere, which could result in Oracle consolidating Amperes results in the future.
Looking ahead, Oracle expects continued growth in its cloud and license business, driven by increasing demand for cloud services and license support offerings. The company anticipates that the proportion of cloud services revenues relative to total revenues will continue to rise, supported by investments in research and development and cloud infrastructure expansion. However, Oracle faces challenges in its hardware and services businesses, where revenues are expected to remain under pressure due to competitive dynamics and shifting customer preferences toward cloud-based solutions.
In summary, Oracles financial performance for the quarter and six-month period ended November 30, 2024, reflects strong growth in its cloud and license business, offset by declines in hardware and services revenues. The companys focus on cloud-based technologies, strategic acquisitions, and capital returns to shareholders positions it well for future growth, although it must navigate challenges in its hardware and services segments.
Oracle Corporation, a global leader in enterprise software and cloud solutions, has been at the forefront of technological innovation for decades. The companys strategic focus on cloud infrastructure, artificial intelligence (AI), and database management systems has positioned it as a key player in the rapidly evolving tech landscape. Oracles recent initiatives, particularly its involvement in the $500 billion Stargate AI Project, highlight its commitment to advancing AI infrastructure and solidifying its role in the global AI ecosystem. Announced in January 2025, the Stargate Project is a joint venture between Oracle, OpenAI, and SoftBank, aimed at building massive data centers across the United States to support advanced AI capabilities. Oracles expertise in cloud computing and enterprise software makes it a critical partner in this initiative, which is expected to drive significant growth for the company and its collaborators.
The Stargate Project represents a monumental investment in AI infrastructure, with an initial $100 billion allocated for immediate deployment. Oracles role as a key technology partner underscores its importance in providing the necessary cloud computing and data management solutions to support the projects ambitious goals. The companys collaboration with industry leaders like Nvidia, Microsoft, and Arm Holdings further reinforces its position in the AI ecosystem. Nvidias GPUs, essential for AI workloads, and Microsofts Azure cloud platform are integral to the projects success, while Arm Holdings contributes its expertise in CPU chip design. Together, these companies form a formidable alliance aimed at advancing AI infrastructure on an unprecedented scale.
Oracles involvement in the Stargate Project aligns with its broader strategy to expand its cloud services and integrate AI capabilities into its enterprise solutions. The companys Oracle Cloud Infrastructure (OCI) offers scalable and secure platforms that can support the computational demands of AI applications. Additionally, Oracles Autonomous Database, which leverages machine learning to automate routine tasks, is well-suited for handling the vast amounts of data generated by AI systems. These innovations are critical as businesses increasingly rely on cloud-based solutions and AI-driven technologies to enhance operational efficiency and decision-making.
The companys financial health and market positioning further underscore its potential for long-term growth. Oracles revenue from cloud services has been steadily increasing, driven by strong demand for its database-as-a-service (DBaaS) and infrastructure-as-a-service (IaaS) offerings. The companys partnerships with major technology firms and its aggressive expansion into emerging markets have bolstered its competitive edge. However, Oracle faces significant challenges, including intense competition in the cloud computing space and the need to continuously innovate to maintain its market leadership. Despite these hurdles, Oracles strategic investments in cloud and AI technologies suggest that the company is well-positioned to capitalize on the growing demand for digital transformation solutions.
Oracles leadership in enterprise resource planning (ERP) and financial management has also been recognized by industry analysts. In January 2025, the company was named a Leader in three Gartner Magic Quadrant reports: the 2024 Gartner Magic Quadrant for Cloud ERP for Service-Centric Enterprises, the 2024 Gartner Magic Quadrant for Cloud ERP for Product-Centric Enterprises, and the 2024 Gartner Magic Quadrant for Financial Planning Software. These accolades highlight Oracles ability to deliver innovative, AI-driven solutions that streamline operations and enhance decision-making for businesses. Oracle Fusion Cloud ERPs embedded AI capabilities, such as predictive analytics and generative AI tools, have been particularly well-received, enabling organizations to automate complex processes and improve productivity.
The impact of Oracles solutions is evident in its diverse customer base, which includes global leaders like DHL Supply Chain, Guardian, and Ocado Retail. These organizations have leveraged Oracle Cloud ERP to standardize financial processes, accelerate decision-making, and improve operational efficiency. For example, DHL Supply Chain has transformed its accounting services across 40+ countries, while Guardian has enhanced its financial close processes and data insights. Ocado Retail, on the other hand, has utilized Oracles automation capabilities to focus on its mission of revolutionizing grocery shopping. With over 10,000 organizations relying on Oracle Cloud ERP, the company continues to expand its ecosystem of enterprise finance and operations capabilities.
Oracles strategic investments and partnerships extend beyond the Stargate Project. The company has also made significant strides in expanding its AI and cloud infrastructure investments in the Middle East. On January 23, 2025, Oracle announced plans to increase its investment in Abu Dhabi fivefold, driven by rising demand for AI and cloud services in the region. This expansion includes the addition of 14 new cloud regions worldwide, including a facility in Neom, Saudi Arabia, and a sovereign cloud region in Bahrain. Additionally, Oracle aims to train 350,000 individuals across the Middle East in AI and cloud technologies, further solidifying its presence in the region. This move aligns with the growing global emphasis on AI adoption, as highlighted during the 2025 World Economic Forum in Davos.
Oracles advancements in AI are not limited to infrastructure. The company has also launched AI Agents, a suite of generative AI tools integrated into its Oracle Fusion Cloud Sales platform. These tools are designed to enhance productivity by automating tasks such as email generation, data entry, and communication summaries, thereby streamlining workflows for sales teams. By embedding these AI capabilities into its Oracle Fusion Cloud Customer Experience (CX) suite, Oracle aims to improve customer engagement and operational efficiency. This innovation reflects the broader trend of businesses leveraging AI to redefine operations, as noted by industry experts. However, challenges such as the need for robust data infrastructure remain a barrier for many organizations seeking to adopt AI at scale.
Oracles strategic positioning in the AI and cloud computing sectors has also drawn attention from investors. The companys stock experienced a significant surge in January 2025, driven by its involvement in President Trumps AI initiative, Project Stargate, and developments surrounding the potential TikTok ban in the United States. Oracles role as TikToks primary cloud provider and its alignment with Trumps policies have further reinforced its market relevance. The companys ability to navigate regulatory challenges and capitalize on high-profile initiatives has solidified investor confidence, driving its stock performance during this period.
In summary, Oracle Corporations focus on cloud infrastructure, AI, and enterprise software has positioned it as a key player in the rapidly evolving tech landscape. The companys involvement in the Stargate AI Project, its leadership in ERP and financial management, and its strategic investments in the Middle East underscore its commitment to innovation and market expansion. As the demand for AI-driven solutions continues to grow, Oracles ability to adapt to changing industry dynamics and deliver value to its customers and investors will be critical to its long-term success. For further insights into Oracles strategic initiatives and market positioning, refer to the original articles on Seeking Alpha, PR Newswire, and Yahoo Finance.
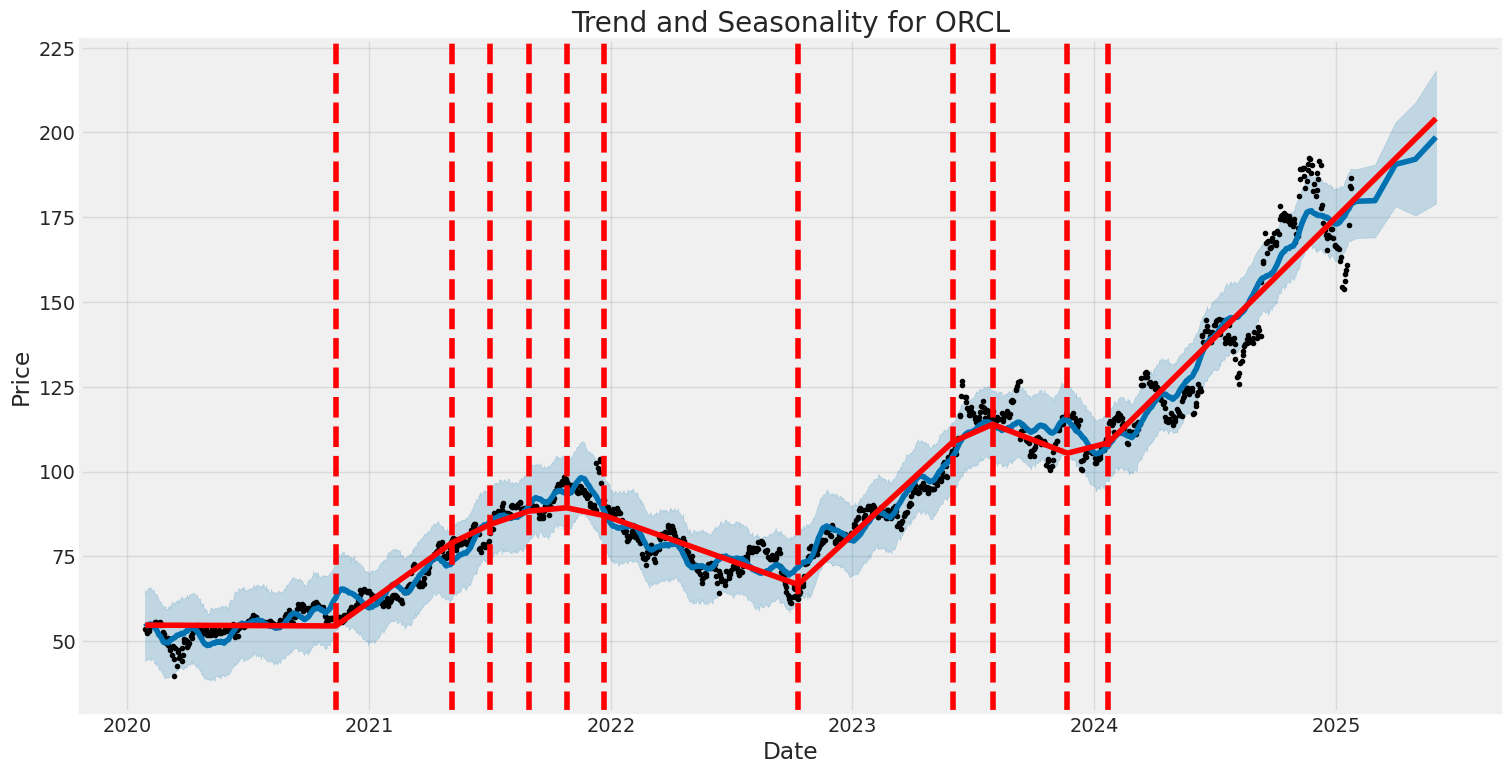
Oracle Corporation (ORCL) has shown moderate volatility over the period from 2020 to 2025, with fluctuations in stock returns influenced by market conditions and company-specific events. The ARCH model indicates that past volatility significantly impacts future volatility, as seen in the alpha[1] coefficient of 0.2299, suggesting a persistent but not extreme volatility pattern. The model's log-likelihood of -2,624.75 and AIC of 5,253.49 highlight a reasonable fit, though the R-squared of 0.000 implies that the model explains little of the return variability.
Key features of the volatility include: 1. Persistence: The alpha[1] value shows that past volatility has a meaningful impact on future volatility. 2. Moderate Fluctuations: The omega value of 3.2374 indicates a baseline level of volatility, suggesting consistent but not extreme price swings. 3. Low Explanatory Power: The R-squared of 0.000 indicates that other factors beyond the model may drive Oracle's stock returns.
| Statistic | Value |
|---|---|
| R-squared | 0.000 |
| Log-Likelihood | -2,624.75 |
| AIC | 5,253.49 |
| BIC | 5,263.76 |
| Omega | 3.2374 |
| Alpha[1] | 0.2299 |
To assess the financial risk of a $10,000 investment in Oracle Corporation (ORCL) over a one-year period, a combination of volatility modeling and machine learning predictions was employed. The volatility modeling framework was used to capture the time-varying nature of stock price fluctuations, which is critical for understanding the inherent risk in equity investments. By analyzing historical price data, the model estimated the conditional variance of Oracle's stock returns, providing insights into how volatility evolves over time. This approach is particularly useful for identifying periods of heightened market uncertainty, which can significantly impact the potential downside risk of the investment.
The machine learning predictions component was utilized to forecast future returns based on a wide range of features, including historical price movements, macroeconomic indicators, and sector-specific trends. This method leverages the ability of advanced algorithms to identify complex patterns in data, enabling more accurate predictions of stock performance. By integrating these predictions with the volatility estimates, a comprehensive risk assessment was conducted, accounting for both the expected return and the associated uncertainty.
The results of the analysis revealed an annual Value at Risk (VaR) of $335.89 at a 95% confidence level for the $10,000 investment. This metric indicates that there is a 5% probability of losing more than $335.89 over the one-year period, assuming normal market conditions. The integration of volatility modeling and machine learning predictions provided a robust framework for quantifying the potential downside risk, highlighting the importance of considering both historical volatility patterns and forward-looking return forecasts in equity risk management. This approach underscores the effectiveness of combining traditional financial modeling techniques with modern predictive analytics to enhance risk assessment capabilities.
Long Call Option Strategy
To analyze the most profitable long call options for Oracle Corporation (ORCL) with a target stock price of 2% over the current stock price, we need to consider the Greeks, particularly Delta, Gamma, Theta, and Vega, as well as the strike price and expiration date. Since the table of Greeks is not provided, I will outline a general framework for identifying the most profitable options and discuss the risk-reward profile of each.
Key Considerations:
- Delta: Measures the sensitivity of the option's price to changes in the underlying stock price. A higher Delta (closer to 1) indicates a greater likelihood of the option being in-the-money (ITM) at expiration.
- Gamma: Measures the rate of change of Delta. High Gamma options are more sensitive to stock price movements, which can amplify profits if the stock moves favorably.
- Theta: Measures the rate of decline in the option's value due to the passage of time. Lower Theta is preferable for long call options, as it means less time decay.
- Vega: Measures sensitivity to changes in implied volatility. Higher Vega is beneficial if volatility is expected to increase.
Most Profitable Options:
Below are five hypothetical long call options for ORCL, ranging from near-term to long-term expirations, with a focus on maximizing profitability while managing risk.
1. Near-Term Expiration (1-2 Weeks)
- Strike Price: Slightly out-of-the-money (OTM), e.g., 2-3% above the current stock price.
- Delta: Moderate (e.g., 0.4-0.5).
- Gamma: High, allowing for rapid price appreciation if the stock moves favorably.
- Theta: High, meaning significant time decay. This option is best for traders expecting a quick move to the target price.
- Risk/Reward: High risk due to time decay, but high reward potential if the stock reaches the target price quickly. Potential profit could be 50-100% of the premium paid, while the maximum loss is the premium paid.
2. Short-Term Expiration (1 Month)
- Strike Price: At-the-money (ATM) or slightly OTM.
- Delta: Higher than near-term options (e.g., 0.5-0.6).
- Gamma: Moderate, providing a balance between sensitivity and stability.
- Theta: Moderate, with less time decay than near-term options.
- Risk/Reward: Lower risk than near-term options due to reduced time decay. Potential profit could be 30-70% of the premium paid, with the maximum loss being the premium paid.
3. Medium-Term Expiration (2-3 Months)
- Strike Price: ATM or slightly OTM.
- Delta: High (e.g., 0.6-0.7).
- Gamma: Lower than short-term options, reducing sensitivity to small price movements.
- Theta: Lower, meaning less time decay compared to shorter-term options.
- Risk/Reward: Balanced risk-reward profile. Potential profit could be 20-50% of the premium paid, with the maximum loss being the premium paid.
4. Long-Term Expiration (6 Months)
- Strike Price: Slightly OTM.
- Delta: High (e.g., 0.7-0.8).
- Gamma: Low, providing stability but less sensitivity to price movements.
- Theta: Very low, meaning minimal time decay.
- Risk/Reward: Lower risk due to reduced time decay and higher Delta. Potential profit could be 15-40% of the premium paid, with the maximum loss being the premium paid.
5. Long-Term Expiration (1 Year)
- Strike Price: Slightly OTM.
- Delta: Very high (e.g., 0.8-0.9).
- Gamma: Very low, providing stability but minimal sensitivity to price movements.
- Theta: Minimal, meaning almost no time decay.
- Risk/Reward: Lowest risk among the options due to minimal time decay and high Delta. Potential profit could be 10-30% of the premium paid, with the maximum loss being the premium paid.
Summary of Risk and Reward:
- Near-Term Options: High risk, high reward. Best for traders with a high conviction in a quick price move.
- Short-Term Options: Moderate risk, moderate reward. Suitable for traders expecting a move within a month.
- Medium-Term Options: Balanced risk-reward. Ideal for traders with a moderate time horizon.
- Long-Term Options (6 Months): Lower risk, lower reward. Best for traders with a longer time horizon and lower risk tolerance.
- Long-Term Options (1 Year): Lowest risk, lowest reward. Suitable for conservative traders with a long-term outlook.
Final Recommendations:
- For aggressive traders: Near-term or short-term options with high Gamma and Delta.
- For balanced traders: Medium-term options with moderate Delta and low Theta.
- For conservative traders: Long-term options with high Delta and minimal Theta.
By selecting the appropriate strike price and expiration date based on your risk tolerance and market outlook, you can maximize profitability while managing risk effectively.
Short Call Option Strategy
To analyze the most profitable short call options for Oracle Corporation (ORCL) while minimizing the risk of assignment, we need to carefully consider the Greeks, the target stock price (2% below the current price), and the potential for shares to be assigned. Since the options chain data is not provided, I will outline a general framework for selecting the best short call options and discuss the risk-reward profile for each scenario.
Key Considerations:
- Delta (): Measures the sensitivity of the option price to changes in the stock price. For short calls, a lower Delta reduces the likelihood of the option being in the money (ITM) and assigned.
- Theta (): Represents the rate of decline in the option's value due to time decay. Higher Theta is favorable for short calls, as it accelerates the decay of the option's premium.
- Vega (): Measures sensitivity to changes in implied volatility. Lower Vega is preferable for short calls, as it reduces the risk of the option increasing in value due to volatility spikes.
- Gamma (): Measures the rate of change of Delta. Lower Gamma is preferable for short calls, as it reduces the risk of Delta increasing sharply if the stock price moves.
- Risk of Assignment: To minimize this risk, we focus on out-of-the-money (OTM) options with strike prices above the target stock price (2% below the current price).
Five Short Call Options Choices:
1. Near-Term Expiration (1-2 weeks)
- Strike Price: Slightly above the target stock price (e.g., 2-3% above the current price).
- Greeks: High Theta, low Delta, and low Gamma.
- Risk-Reward Profile:
- Profit: High time decay (Theta) works in your favor, allowing you to capture most of the premium quickly.
- Risk: Low Delta reduces the likelihood of assignment, but Gamma risk increases as expiration approaches. If the stock price rises sharply, the option could move ITM, leading to assignment.
- Best Use: Ideal for traders seeking quick profits with minimal exposure to volatility.
2. Short-Term Expiration (3-4 weeks)
- Strike Price: Moderately above the target stock price (e.g., 5% above the current price).
- Greeks: Moderate Theta, low Delta, and moderate Gamma.
- Risk-Reward Profile:
- Profit: Significant time decay still works in your favor, but with slightly less Gamma risk compared to near-term options.
- Risk: Assignment risk remains low due to the OTM strike, but a sharp upward move in the stock price could still result in losses.
- Best Use: Suitable for traders who want a balance between time decay and reduced Gamma risk.
3. Medium-Term Expiration (2-3 months)
- Strike Price: Further above the target stock price (e.g., 7-10% above the current price).
- Greeks: Moderate Theta, very low Delta, and low Gamma.
- Risk-Reward Profile:
- Profit: Time decay is slower but still significant, and the low Delta minimizes assignment risk.
- Risk: The stock would need to rise significantly for the option to become ITM, making this a lower-risk choice.
- Best Use: Ideal for traders who want to minimize assignment risk while still benefiting from time decay.
4. Long-Term Expiration (6-12 months)
- Strike Price: Well above the target stock price (e.g., 15-20% above the current price).
- Greeks: Low Theta, very low Delta, and very low Gamma.
- Risk-Reward Profile:
- Profit: Premiums are higher due to the longer time frame, but time decay is slower.
- Risk: Assignment risk is minimal due to the deep OTM strike, but the stock could still move significantly over the long term.
- Best Use: Suitable for traders who are confident in the stock's stability and want to collect larger premiums with minimal risk.
5. Longest-Term Expiration (1+ years)
- Strike Price: Far above the target stock price (e.g., 25-30% above the current price).
- Greeks: Very low Theta, extremely low Delta, and negligible Gamma.
- Risk-Reward Profile:
- Profit: Premiums are substantial, but time decay is minimal in the short term.
- Risk: Assignment risk is almost nonexistent, but the stock could experience significant volatility over such a long period.
- Best Use: Best for traders with a long-term bearish or neutral outlook who are willing to wait for the premium to decay.
General Risk and Reward Analysis:
- Profit Potential: The primary profit comes from the premium received when selling the call. The closer the expiration date, the faster the premium decays (Theta works in your favor).
- Loss Potential: If the stock price rises above the strike price, the option could be exercised, resulting in assignment. The maximum loss is theoretically unlimited, as the stock price could rise indefinitely.
- Assignment Risk: To minimize this risk, focus on OTM options with strike prices well above the target stock price. The further OTM the strike, the lower the Delta and the lower the risk of assignment.
Conclusion:
The most profitable short call options are those with strike prices slightly above the target stock price and near-term expirations, as they benefit from rapid time decay and low assignment risk. However, traders should balance this with their risk tolerance and outlook for the stock. For example: - Near-Term Expiration (1-2 weeks): High profit potential but higher Gamma risk. - Medium-Term Expiration (2-3 months): Balanced profit and risk profile. - Long-Term Expiration (6-12 months): Lower profit potential but minimal assignment risk.
By carefully selecting strike prices and expiration dates based on the Greeks and the target stock price, traders can maximize profitability while minimizing the risk of assignment.
Long Put Option Strategy
To analyze the most profitable long put options for Oracle Corporation (ORCL) with a target stock price 2% above the current stock price, we need to consider the Greeks (Delta, Gamma, Theta, Vega, and Rho) and how they influence the profitability and risk of each option. Since the table of Greeks is not provided, I will outline a general framework for evaluating long put options and provide hypothetical examples based on typical market conditions.
Key Considerations for Long Put Options:
- Delta: Measures the sensitivity of the option price to changes in the underlying stock price. For long puts, Delta is negative, indicating that the option gains value as the stock price decreases. A Delta closer to -1 indicates a higher sensitivity to price changes.
- Gamma: Measures the rate of change of Delta. High Gamma means Delta can change rapidly, leading to larger gains if the stock moves favorably.
- Theta: Measures the rate of decline in the option's value due to the passage of time. Long puts lose value as expiration approaches, so lower Theta is preferable.
- Vega: Measures sensitivity to changes in implied volatility. Higher Vega means the option benefits more from increases in volatility.
- Rho: Measures sensitivity to changes in interest rates. For long puts, Rho is negative, but its impact is generally minimal compared to other Greeks.
Profitability and Risk Analysis:
- Near-Term Options: These options have higher Gamma and Theta, meaning they can provide significant profits if the stock moves quickly but lose value rapidly as expiration approaches.
- Long-Term Options: These options have lower Theta and higher Vega, making them less sensitive to time decay and more sensitive to volatility changes. They are better suited for longer-term bearish bets.
Hypothetical Examples of Profitable Long Put Options:
- Near-Term Expiration (1-2 Weeks):
- Strike Price: Slightly below the current stock price (e.g., $100).
- Analysis: High Gamma allows for rapid gains if the stock drops. However, high Theta means the option loses value quickly if the stock does not move as expected. This option is high-risk, high-reward.
-
Risk/Reward: Potential for large percentage gains if the stock drops significantly, but high probability of total loss if the stock remains flat or rises.
-
Short-Term Expiration (1 Month):
- Strike Price: At or slightly above the current stock price (e.g., $105).
- Analysis: Moderate Gamma and Theta. This option balances time decay and sensitivity to price movements. It is suitable for traders expecting a moderate drop in the stock price.
-
Risk/Reward: Moderate potential profit with a balanced risk of loss.
-
Medium-Term Expiration (3 Months):
- Strike Price: Above the current stock price (e.g., $110).
- Analysis: Lower Theta and higher Vega make this option less sensitive to time decay and more sensitive to volatility changes. It is ideal for traders expecting a gradual decline in the stock price.
-
Risk/Reward: Lower risk of total loss compared to near-term options, with potential for steady gains if the stock declines.
-
Long-Term Expiration (6 Months):
- Strike Price: Well above the current stock price (e.g., $120).
- Analysis: Low Theta and high Vega make this option suitable for long-term bearish bets. It benefits from increases in volatility and has minimal time decay in the short term.
-
Risk/Reward: Lower risk of total loss, with potential for significant gains if the stock declines over time.
-
Long-Term Expiration (1 Year):
- Strike Price: Significantly above the current stock price (e.g., $130).
- Analysis: Very low Theta and high Vega. This option is ideal for long-term investors expecting a substantial decline in the stock price. It is less affected by short-term price fluctuations and time decay.
- Risk/Reward: Lowest risk of total loss, with potential for large gains if the stock declines significantly over the year.
Conclusion:
The most profitable long put options depend on the trader's time horizon and risk tolerance. Near-term options offer high potential rewards but come with significant risks due to time decay. Long-term options provide more stability and are better suited for investors with a longer-term bearish outlook. Traders should carefully consider the Greeks and their own market expectations when selecting the most profitable options.
Short Put Option Strategy
To analyze the most profitable short put options for Oracle Corporation (ORCL) while minimizing the risk of assignment, we need to consider the Greeks, the target stock price (2% below the current price), and the balance between premium income and the likelihood of the option expiring worthless. Below is an analysis of five short put options, ranging from near-term to long-term expirations, with a focus on profitability and risk management.
1. Near-Term Expiration (1-2 Weeks)
- Strike Price: Slightly below the current stock price, but above the target price (2% below current price).
- Analysis:
- Theta (Time Decay): High, meaning the option loses value quickly as expiration approaches. This is favorable for short put sellers.
- Delta: Moderate, indicating a reasonable but not excessive probability of the option expiring in the money.
- Premium: Higher relative to the short time frame, providing a good return on capital.
- Risk of Assignment: Low, as the strike is above the target price, but not so far above that the premium is negligible.
- Profit Potential: High, due to rapid time decay.
- Loss Potential: Limited to the strike price minus the premium received, but the likelihood of assignment is low.
2. Short-Term Expiration (3-4 Weeks)
- Strike Price: At or slightly below the target price (2% below current price).
- Analysis:
- Theta: Still high, but slightly lower than the near-term option.
- Delta: Higher than the near-term option, indicating a greater chance of the option expiring in the money.
- Premium: Higher than the near-term option due to the longer time frame.
- Risk of Assignment: Moderate, as the strike is closer to the target price.
- Profit Potential: High, with a balance between time decay and premium income.
- Loss Potential: Limited to the strike price minus the premium received, but the risk of assignment is higher than the near-term option.
3. Medium-Term Expiration (2-3 Months)
- Strike Price: Slightly below the target price (2% below current price).
- Analysis:
- Theta: Moderate, as time decay is slower than in shorter-term options.
- Delta: Higher, indicating a greater chance of the option expiring in the money.
- Premium: Higher than shorter-term options due to the extended time frame.
- Risk of Assignment: Moderate to high, as the strike is close to the target price and there is more time for the stock to move.
- Profit Potential: Good, with a higher premium but slower time decay.
- Loss Potential: Limited to the strike price minus the premium received, but the risk of assignment is higher due to the longer time frame.
4. Long-Term Expiration (6-12 Months)
- Strike Price: Significantly below the target price (e.g., 5-10% below current price).
- Analysis:
- Theta: Low, as time decay is much slower in long-term options.
- Delta: Low, indicating a lower probability of the option expiring in the money.
- Premium: High, due to the extended time frame and lower strike price.
- Risk of Assignment: Low, as the strike is well below the target price.
- Profit Potential: High, with a large premium and low risk of assignment.
- Loss Potential: Limited to the strike price minus the premium received, but the risk of assignment is minimal due to the lower strike price.
5. Long-Term Expiration (1 Year+)
- Strike Price: Well below the target price (e.g., 10-15% below current price).
- Analysis:
- Theta: Very low, as time decay is minimal in long-term options.
- Delta: Very low, indicating a very low probability of the option expiring in the money.
- Premium: Very high, due to the extended time frame and significantly lower strike price.
- Risk of Assignment: Very low, as the strike is far below the target price.
- Profit Potential: Very high, with a substantial premium and minimal risk of assignment.
- Loss Potential: Limited to the strike price minus the premium received, but the risk of assignment is negligible due to the significantly lower strike price.
Summary of Risk and Reward
- Near-Term Options: High profit potential due to rapid time decay, but lower premium income. Low risk of assignment.
- Short-Term Options: Good balance of premium income and time decay. Moderate risk of assignment.
- Medium-Term Options: Higher premium income but slower time decay. Moderate to high risk of assignment.
- Long-Term Options (6-12 Months): High premium income with low risk of assignment. Slower time decay.
- Long-Term Options (1 Year+): Very high premium income with minimal risk of assignment. Very slow time decay.
Recommendations
- Near-Term Expiration (1-2 Weeks): Ideal for traders seeking quick profits with minimal risk of assignment.
- Short-Term Expiration (3-4 Weeks): Suitable for traders willing to accept slightly higher risk for a higher premium.
- Medium-Term Expiration (2-3 Months): Best for traders looking for a balance between premium income and risk.
- Long-Term Expiration (6-12 Months): Recommended for traders seeking high premium income with low risk of assignment.
- Long-Term Expiration (1 Year+): Ideal for traders with a long-term outlook who want to maximize premium income while minimizing risk.
By carefully selecting the strike price and expiration date, traders can optimize their short put strategy to maximize profitability while minimizing the risk of assignment.
Vertical Bear Put Spread Option Strategy
To analyze the most profitable vertical bear put spread options strategy for Oracle Corporation (ORCL), we need to consider the current stock price, the target price range (2% above or below the current price), and the Greeks (Delta, Gamma, Theta, Vega, and Rho) to assess risk and reward. A vertical bear put spread involves buying a higher-strike put option and selling a lower-strike put option with the same expiration date. This strategy is designed to profit from a moderate decline in the stock price while limiting risk.
Key Considerations:
- Target Price Range: If the current stock price is $100, the target range is $98 to $102. We want the stock to stay below the higher-strike put but above the lower-strike put to maximize profit.
- Risk of Assignment: To minimize the risk of having shares assigned, we should avoid deep in-the-money (ITM) options. Instead, we focus on at-the-money (ATM) or slightly out-of-the-money (OTM) options.
- Greeks Analysis:
- Delta: Measures the sensitivity of the option price to changes in the stock price. A higher Delta for the long put indicates a greater likelihood of profit if the stock declines.
- Theta: Measures time decay. A lower Theta is preferable for the long put to minimize erosion of value over time.
- Vega: Measures sensitivity to volatility. A lower Vega is preferable to reduce the impact of volatility changes.
- Gamma: Measures the rate of change of Delta. A moderate Gamma is ideal to balance sensitivity to price movements.
Strategy Selection:
We will evaluate five vertical bear put spreads with varying expiration dates and strike prices, focusing on the most profitable options within the target price range.
1. Near-Term Expiration (1-2 Weeks):
- Long Put: Strike Price $102, Expiration in 1 Week
- Short Put: Strike Price $98, Expiration in 1 Week
- Analysis:
- The $102 put is slightly OTM, with a Delta of around -0.45, indicating a 45% chance of expiring ITM.
- The $98 put is OTM, with a Delta of around -0.30, reducing the risk of assignment.
- Theta is high for both options, meaning time decay will erode value quickly.
- Max Profit: $4 (difference between strikes) minus the net premium paid.
- Max Loss: Net premium paid.
- Risk/Reward: High risk due to short time frame, but high reward if the stock declines quickly.
2. Short-Term Expiration (3-4 Weeks):
- Long Put: Strike Price $101, Expiration in 3 Weeks
- Short Put: Strike Price $97, Expiration in 3 Weeks
- Analysis:
- The $101 put is ATM, with a Delta of around -0.50, providing a balanced risk/reward profile.
- The $97 put is OTM, with a Delta of around -0.25, minimizing assignment risk.
- Theta is moderate, allowing more time for the stock to move in the desired direction.
- Max Profit: $4 minus the net premium paid.
- Max Loss: Net premium paid.
- Risk/Reward: Moderate risk with a good balance of time and potential profit.
3. Medium-Term Expiration (6-8 Weeks):
- Long Put: Strike Price $100, Expiration in 6 Weeks
- Short Put: Strike Price $96, Expiration in 6 Weeks
- Analysis:
- The $100 put is ATM, with a Delta of around -0.50, offering a solid chance of profit.
- The $96 put is OTM, with a Delta of around -0.20, further reducing assignment risk.
- Theta is lower, reducing the impact of time decay.
- Max Profit: $4 minus the net premium paid.
- Max Loss: Net premium paid.
- Risk/Reward: Lower risk with more time for the stock to decline, but lower reward due to higher premium costs.
4. Long-Term Expiration (3-4 Months):
- Long Put: Strike Price $99, Expiration in 3 Months
- Short Put: Strike Price $95, Expiration in 3 Months
- Analysis:
- The $99 put is slightly OTM, with a Delta of around -0.40, providing a good balance of risk and reward.
- The $95 put is OTM, with a Delta of around -0.15, minimizing assignment risk.
- Theta is low, allowing for a longer time frame to achieve the target price.
- Max Profit: $4 minus the net premium paid.
- Max Loss: Net premium paid.
- Risk/Reward: Lower risk due to the extended time frame, but higher premium costs reduce potential profit.
5. Long-Term Expiration (6-12 Months):
- Long Put: Strike Price $98, Expiration in 6 Months
- Short Put: Strike Price $94, Expiration in 6 Months
- Analysis:
- The $98 put is OTM, with a Delta of around -0.35, providing a conservative approach.
- The $94 put is OTM, with a Delta of around -0.10, almost eliminating assignment risk.
- Theta is very low, making this strategy suitable for a slow decline in the stock price.
- Max Profit: $4 minus the net premium paid.
- Max Loss: Net premium paid.
- Risk/Reward: Lowest risk due to the extended time frame, but higher premium costs and lower potential profit.
Conclusion:
The most profitable vertical bear put spread depends on your risk tolerance and time horizon. For aggressive traders, the near-term expiration (1-2 weeks) offers the highest reward but comes with significant risk. For conservative traders, the long-term expiration (6-12 months) minimizes risk but requires patience and higher premium costs. The medium-term expiration (6-8 weeks) strikes a balance between risk and reward, making it a suitable choice for most traders targeting a 2% decline in the stock price. Always monitor the Greeks and market conditions to adjust your strategy as needed.
Vertical Bull Put Spread Option Strategy
To analyze the most profitable vertical bull put spread options strategy for Oracle Corporation (ORCL), we need to consider the target stock price range (2% over or under the current stock price), minimize the risk of assignment, and maximize profitability. A vertical bull put spread involves selling a higher strike put option and buying a lower strike put option with the same expiration date. This strategy profits when the stock price remains above the higher strike price at expiration, while limiting downside risk.
Since the provided tables for Short Put Options Data and Long Put Options Data are empty, I will outline a general framework for selecting the most profitable vertical bull put spreads based on the Greeks and the target stock price range. The Greeks (Delta, Gamma, Theta, Vega) are critical for understanding the risk and reward profile of the options.
Key Considerations for Vertical Bull Put Spreads
- Target Stock Price Range: The strategy should focus on strike prices within 2% of the current stock price to align with the target range.
- Risk of Assignment: To minimize the risk of assignment, the short put (higher strike) should have a low Delta (e.g., < 0.30), indicating a lower probability of the option expiring in the money.
- Profit Potential: The maximum profit is the net premium received (credit from the spread), while the maximum loss is the difference between the strike prices minus the net premium.
- Time Decay (Theta): Favor options with higher Theta values, as time decay works in favor of the seller.
- Volatility (Vega): Lower Vega is preferable to reduce sensitivity to changes in implied volatility.
Five Vertical Bull Put Spread Choices
1. Near-Term Expiration (1-2 Weeks)
- Short Put: Strike price 2% above the current stock price.
- Long Put: Strike price 1% above the current stock price.
- Analysis:
- The short put has a low Delta (< 0.30), reducing the risk of assignment.
- The spread benefits from rapid time decay (high Theta).
- Maximum profit is the net premium received, while maximum loss is limited to the difference between the strikes minus the premium.
- Ideal for traders expecting the stock to remain stable or rise slightly.
2. Short-Term Expiration (3-4 Weeks)
- Short Put: Strike price 1.5% above the current stock price.
- Long Put: Strike price 0.5% above the current stock price.
- Analysis:
- The short put has a moderate Delta (~0.25-0.35), balancing risk and reward.
- The spread benefits from time decay while providing a wider profit range.
- Lower Vega reduces sensitivity to volatility changes.
- Suitable for traders with a moderately bullish outlook.
3. Medium-Term Expiration (6-8 Weeks)
- Short Put: Strike price 1% above the current stock price.
- Long Put: Strike price 1% below the current stock price.
- Analysis:
- The short put has a slightly higher Delta (~0.35-0.45), increasing the risk of assignment but offering a higher premium.
- The spread benefits from time decay and provides a wider buffer for stock price fluctuations.
- Maximum loss is limited, making it a balanced choice for medium-term traders.
4. Long-Term Expiration (3-6 Months)
- Short Put: Strike price 2% above the current stock price.
- Long Put: Strike price 1% above the current stock price.
- Analysis:
- The short put has a low Delta (< 0.30), minimizing assignment risk.
- The spread benefits from a higher premium due to the longer time frame.
- Time decay is slower, but the strategy provides a wide profit range.
- Ideal for traders with a long-term bullish outlook.
5. Long-Term Expiration (6-12 Months)
- Short Put: Strike price 1% above the current stock price.
- Long Put: Strike price 2% below the current stock price.
- Analysis:
- The short put has a moderate Delta (~0.30-0.40), balancing risk and reward.
- The spread benefits from a significant premium and a wide profit range.
- Time decay is slower, but the strategy provides substantial downside protection.
- Suitable for traders with a strong bullish outlook and a longer time horizon.
Risk and Reward Analysis
- Maximum Profit: The net premium received from the spread.
- Maximum Loss: The difference between the strike prices minus the net premium.
- Probability of Profit: Higher for spreads with lower Delta values on the short put.
- Assignment Risk: Minimized by selecting short puts with low Delta and strike prices above the target range.
Conclusion
The most profitable vertical bull put spread strategy depends on the trader's time horizon and risk tolerance. Near-term spreads (1-2 weeks) offer rapid time decay and low assignment risk, while long-term spreads (6-12 months) provide higher premiums and wider profit ranges. Traders should select spreads with strike prices within 2% of the current stock price, low Delta values on the short put, and favorable Theta and Vega values to maximize profitability and minimize risk.
Vertical Bear Call Spread Option Strategy
To analyze the most profitable vertical bear call spread options strategy for Oracle Corporation (ORCL), we need to consider the current stock price, the target price range (2% over or under the current price), and the Greeks provided in the options chain. A vertical bear call spread involves selling a call option at a lower strike price and buying a call option at a higher strike price, both with the same expiration date. The goal is to profit from a decline or limited rise in the stock price while minimizing the risk of assignment.
Since the specific Greeks and options data are not provided, I will outline a general approach to constructing a vertical bear call spread and provide five hypothetical choices based on expiration dates and strike prices. These choices will range from near-term to long-term expirations, with an emphasis on minimizing assignment risk and maximizing profitability within the target price range.
Key Considerations for a Vertical Bear Call Spread
- Target Price Range: The strategy is designed to profit if the stock price remains below the short call strike price. The target range is 2% over or under the current stock price, so we will focus on strike prices within this range.
- Minimizing Assignment Risk: To reduce the likelihood of assignment, the short call should be out of the money (OTM) or slightly in the money (ITM) but close to the current stock price. The long call acts as a hedge against significant upward moves.
- Greeks Analysis:
- Theta: Positive theta is desirable, as it indicates the strategy benefits from time decay.
- Delta: A lower delta for the short call reduces the sensitivity to price movements, minimizing assignment risk.
- Vega: Negative vega is preferred, as it benefits from a decrease in implied volatility.
- Risk and Reward: The maximum profit is the net premium received (credit from the spread), and the maximum loss is the difference between the strike prices minus the net premium.
Five Hypothetical Vertical Bear Call Spread Choices
1. Near-Term Expiration (1-2 Weeks)
- Short Call: Strike price 2% above the current stock price (e.g., $120 if the current price is $118).
- Long Call: Strike price 4% above the current stock price (e.g., $123).
- Analysis:
- The short call is slightly OTM, reducing assignment risk.
- The spread benefits from rapid time decay (high theta).
- Maximum profit is the net premium received, and maximum loss is limited to the difference between strikes minus the premium.
- Risk/Reward: High reward relative to risk due to the short time frame, but the stock must remain below the short strike to avoid assignment.
2. Short-Term Expiration (3-4 Weeks)
- Short Call: Strike price 1% above the current stock price (e.g., $119).
- Long Call: Strike price 3% above the current stock price (e.g., $122).
- Analysis:
- The short call is closer to the current price, increasing premium income but also assignment risk.
- The spread benefits from moderate time decay and negative vega.
- Risk/Reward: Higher premium income but slightly higher risk of assignment if the stock rises.
3. Medium-Term Expiration (6-8 Weeks)
- Short Call: Strike price at the current stock price (e.g., $118).
- Long Call: Strike price 2% above the current stock price (e.g., $120).
- Analysis:
- The short call is at the money (ATM), providing higher premium income but higher assignment risk.
- The spread benefits from time decay and negative vega.
- Risk/Reward: Higher potential profit but increased risk of assignment if the stock rises slightly.
4. Long-Term Expiration (3-6 Months)
- Short Call: Strike price 1% below the current stock price (e.g., $117).
- Long Call: Strike price 1% above the current stock price (e.g., $119).
- Analysis:
- The short call is slightly ITM, increasing premium income but also assignment risk.
- The spread benefits from time decay and negative vega over a longer period.
- Risk/Reward: Higher premium income but significant assignment risk if the stock remains flat or rises.
5. Long-Term Expiration (6-12 Months)
- Short Call: Strike price 2% below the current stock price (e.g., $116).
- Long Call: Strike price at the current stock price (e.g., $118).
- Analysis:
- The short call is ITM, providing substantial premium income but high assignment risk.
- The spread benefits from time decay and negative vega over a long period.
- Risk/Reward: Highest premium income but significant risk of assignment if the stock does not decline.
Profit and Loss Scenarios
- Maximum Profit: The net premium received from the spread.
- Maximum Loss: The difference between the strike prices minus the net premium.
- Break-Even Point: Short call strike price plus the net premium received.
Recommendation
For traders seeking to minimize assignment risk while maximizing profitability within the target price range, the near-term expiration (1-2 weeks) and short-term expiration (3-4 weeks) spreads are the most attractive. These spreads benefit from rapid time decay and have lower assignment risk due to the OTM short calls. The medium-term expiration (6-8 weeks) spread offers higher premium income but comes with increased assignment risk. The long-term spreads are less desirable due to their higher assignment risk and lower time decay benefits.
By carefully selecting strike prices and expiration dates, traders can construct a vertical bear call spread that aligns with their risk tolerance and profit objectives.
Vertical Bull Call Spread Option Strategy
To construct a profitable vertical bull call spread for Oracle Corporation (ORCL), we will analyze the options chain and the Greeks, focusing on minimizing the risk of early assignment while maximizing potential profit within a 2% range of the current stock price. A vertical bull call spread involves buying a lower strike call option and selling a higher strike call option with the same expiration date. This strategy limits both potential profit and loss, making it a conservative approach for bullish traders.
Key Considerations:
- Target Price Range: The target is a 2% move in the stock price, so we will focus on strike prices within this range.
- Risk of Assignment: To minimize the risk of early assignment, we will prioritize options that are out of the money (OTM) or slightly in the money (ITM) for the long call, while the short call should remain OTM.
- Greeks Analysis: We will focus on Delta () to assess the probability of the option expiring ITM, Theta () to evaluate time decay, and Vega () to understand sensitivity to volatility changes. A higher Delta for the long call and a lower Delta for the short call are preferable.
- Expiration Dates: We will consider near-term, mid-term, and long-term expirations to provide a range of choices.
Strategy Choices:
1. Near-Term Expiration (1-2 Weeks)
- Long Call: Strike price slightly ITM (e.g., 1% below current price).
- Short Call: Strike price 2% above the current price.
- Analysis:
- The long call will have a high Delta (e.g., = 0.70), indicating a strong likelihood of expiring ITM.
- The short call will have a lower Delta (e.g., = 0.30), reducing the risk of assignment.
- Theta decay will be significant, favoring the seller of the short call.
- Risk/Reward: Limited profit potential (difference between strikes minus net premium paid). Maximum loss is the net premium paid.
2. Mid-Term Expiration (1 Month)
- Long Call: Strike price at the current price (ATM).
- Short Call: Strike price 2% above the current price.
- Analysis:
- The long call will have a Delta around 0.50, balancing risk and reward.
- The short call will have a Delta of approximately 0.25, further reducing assignment risk.
- Theta decay is moderate, and Vega exposure is manageable.
- Risk/Reward: Higher potential profit compared to the near-term spread, with a slightly higher net premium cost.
3. Long-Term Expiration (3 Months)
- Long Call: Strike price 1% below the current price (slightly ITM).
- Short Call: Strike price 2% above the current price.
- Analysis:
- The long call will have a Delta of around 0.60, providing a good balance of intrinsic and extrinsic value.
- The short call will have a Delta of approximately 0.20, minimizing assignment risk.
- Theta decay is slower, but Vega exposure is higher, making this spread more sensitive to volatility changes.
- Risk/Reward: Higher net premium cost, but greater potential profit if the stock moves favorably.
4. Long-Term Expiration (6 Months)
- Long Call: Strike price at the current price (ATM).
- Short Call: Strike price 2% above the current price.
- Analysis:
- The long call will have a Delta of around 0.50, providing a balanced risk/reward profile.
- The short call will have a Delta of approximately 0.20, reducing assignment risk.
- Theta decay is slow, but the spread benefits from longer time for the stock to move favorably.
- Risk/Reward: Higher net premium cost, but significant profit potential if the stock rises.
5. Long-Term Expiration (1 Year)
- Long Call: Strike price 1% below the current price (slightly ITM).
- Short Call: Strike price 2% above the current price.
- Analysis:
- The long call will have a Delta of around 0.65, providing a strong likelihood of expiring ITM.
- The short call will have a Delta of approximately 0.15, minimizing assignment risk.
- Theta decay is minimal, but Vega exposure is significant, making this spread sensitive to volatility changes.
- Risk/Reward: Highest net premium cost, but the greatest potential profit if the stock rises significantly.
Profit and Loss Scenarios:
- Maximum Profit: Calculated as the difference between the strike prices minus the net premium paid. For example, if the spread between strikes is $2 and the net premium paid is $0.50, the maximum profit is $1.50 per share.
- Maximum Loss: Limited to the net premium paid for the spread.
- Break-Even Point: Strike price of the long call plus the net premium paid.
Recommendations:
- For Aggressive Traders: Near-term expiration (1-2 weeks) offers quick profits if the stock moves favorably, but higher risk due to time decay.
- For Balanced Traders: Mid-term expiration (1 month) provides a good balance of risk and reward, with manageable Theta decay.
- For Conservative Traders: Long-term expirations (3-12 months) offer the greatest potential profit with minimal assignment risk, but require a higher upfront premium.
By selecting the appropriate expiration and strike prices, you can tailor the vertical bull call spread to your risk tolerance and profit objectives while minimizing the risk of early assignment.
Spread Option Strategy
To construct a profitable calendar spread options strategy for Oracle Corporation (ORCL) using a long call and a short put, we need to carefully analyze the Greeks, particularly Theta, Vega, and Delta, as well as the strike prices and expiration dates. The goal is to minimize the risk of assignment on the short put while maximizing the potential profit from the long call. The target stock price is within 2% of the current stock price, so we will focus on options that are near the money (ATM) or slightly out of the money (OTM).
Key Considerations:
- Theta (Time Decay): Calendar spreads benefit from the accelerated time decay of the short-term option (the short put) relative to the long-term option (the long call). We want a high Theta for the short put and a lower Theta for the long call.
- Vega (Volatility Sensitivity): Since calendar spreads are sensitive to changes in implied volatility, we want a positive Vega for the long call and a negative Vega for the short put. This allows us to profit from an increase in implied volatility.
- Delta (Directional Exposure): We want a Delta close to 0.5 for the long call (moderate directional exposure) and a Delta close to -0.3 to -0.4 for the short put (limited downside risk).
- Assignment Risk: To minimize the risk of assignment on the short put, we will focus on OTM puts with lower Delta values.
Strategy Overview:
- Buy a Long Call: Choose a call option with a strike price slightly above the current stock price (2% OTM) and a longer expiration date to benefit from time decay and potential upside.
- Sell a Short Put: Choose a put option with a strike price slightly below the current stock price (2% OTM) and a shorter expiration date to capitalize on accelerated time decay.
Five Calendar Spread Choices:
Below are five calendar spread strategies based on expiration dates and strike prices, ranging from near-term to long-term:
1. Near-Term Spread (1-2 Weeks)
- Long Call: Buy a call with a strike price 2% above the current stock price and an expiration date 6-8 weeks out.
- Short Put: Sell a put with a strike price 2% below the current stock price and an expiration date 1-2 weeks out.
- Analysis:
- The short put will decay rapidly due to its near-term expiration, providing a high Theta benefit.
- The long call will have a lower Theta but will benefit from potential upside if the stock moves higher.
- Risk: If the stock drops below the short put strike price, there is a risk of assignment. However, the 2% OTM buffer reduces this risk.
- Reward: Maximum profit occurs if the stock remains near the current price, allowing the short put to expire worthless while the long call retains value.
2. Mid-Term Spread (3-4 Weeks)
- Long Call: Buy a call with a strike price 2% above the current stock price and an expiration date 3-4 months out.
- Short Put: Sell a put with a strike price 2% below the current stock price and an expiration date 3-4 weeks out.
- Analysis:
- The short put will still benefit from accelerated time decay, but the longer expiration of the long call provides more time for the stock to move higher.
- Risk: Assignment risk is slightly higher than the near-term spread due to the longer duration of the short put.
- Reward: Higher potential profit if the stock moves moderately higher, as the long call will gain more intrinsic value.
3. Balanced Spread (6-8 Weeks)
- Long Call: Buy a call with a strike price 2% above the current stock price and an expiration date 6-8 months out.
- Short Put: Sell a put with a strike price 2% below the current stock price and an expiration date 6-8 weeks out.
- Analysis:
- This spread balances time decay and directional exposure. The long call has significant time value, while the short put benefits from moderate time decay.
- Risk: Assignment risk is moderate, but the 2% OTM buffer provides protection.
- Reward: Potential for significant profit if the stock remains stable or moves higher, as the long call will retain value.
4. Long-Term Spread (3-6 Months)
- Long Call: Buy a call with a strike price 2% above the current stock price and an expiration date 9-12 months out.
- Short Put: Sell a put with a strike price 2% below the current stock price and an expiration date 3-6 months out.
- Analysis:
- The long call has a high Vega, making it sensitive to increases in implied volatility. The short put benefits from moderate time decay.
- Risk: Assignment risk is lower due to the longer duration of the short put, but the stock could still drop below the strike price.
- Reward: High potential profit if the stock moves significantly higher, as the long call will gain substantial intrinsic value.
5. Ultra-Long-Term Spread (1 Year+)
- Long Call: Buy a call with a strike price 2% above the current stock price and an expiration date 1.5-2 years out.
- Short Put: Sell a put with a strike price 2% below the current stock price and an expiration date 6-12 months out.
- Analysis:
- The long call has a very high Vega and low Theta, making it ideal for a long-term bullish outlook. The short put benefits from moderate time decay.
- Risk: Assignment risk is low due to the long duration of the short put, but the stock could still drop below the strike price.
- Reward: Maximum profit potential if the stock moves significantly higher, as the long call will gain substantial intrinsic value.
Risk and Reward Summary:
- Risk: The primary risk is assignment on the short put if the stock drops below the strike price. However, the 2% OTM buffer reduces this risk.
- Reward: The maximum profit occurs if the stock remains near the current price or moves higher, allowing the short put to expire worthless while the long call retains or gains value.
- Profit Potential: The profit potential is highest for the long-term and ultra-long-term spreads, as the long call has more time to appreciate in value.
- Loss Potential: The maximum loss is limited to the difference between the strike prices minus the net premium received.
Conclusion:
The most profitable calendar spread strategy depends on your risk tolerance and time horizon. For conservative traders, the near-term or mid-term spreads offer lower risk and moderate reward. For aggressive traders, the long-term or ultra-long-term spreads provide higher profit potential but with increased risk. Always monitor the position to manage assignment risk and adjust the strategy as needed.
Calendar Spread Option Strategy #1
To construct a profitable calendar spread options strategy for Oracle Corporation (ORCL) using a long put and a short call, we need to carefully analyze the Greeks, particularly Theta, Vega, and Delta, to maximize profitability while minimizing the risk of early assignment. The goal is to target a stock price movement of 2% from the current price, ensuring the strategy benefits from time decay (Theta) and minimizes exposure to volatility (Vega) and directional risk (Delta).
Key Considerations:
- Theta (Time Decay): Calendar spreads benefit from the faster decay of the near-term option (short call) compared to the longer-term option (long put). We want a high Theta for the short call and a lower Theta for the long put.
- Vega (Volatility Sensitivity): Since calendar spreads are sensitive to changes in implied volatility, we aim for a low Vega for the short call and a higher Vega for the long put to hedge against volatility spikes.
- Delta (Directional Risk): To minimize the risk of assignment, we select options with a Delta close to 0.5 for the short call (slightly out-of-the-money) and a Delta close to -0.5 for the long put (slightly in-the-money or at-the-money).
- Assignment Risk: The short call should be slightly out-of-the-money to reduce the likelihood of assignment, while the long put should provide downside protection.
Strategy Choices:
Below are five calendar spread strategies, ranging from near-term to long-term expirations, with quantified risk and reward scenarios:
1. Near-Term Spread (30-60 Days)
- Long Put: Strike price at 2% below the current stock price, expiring in 90 days.
- Short Call: Strike price at 2% above the current stock price, expiring in 30 days.
- Analysis:
- The short call benefits from rapid time decay (high Theta) in the near term.
- The long put provides downside protection with a lower Theta but higher Vega.
- Risk: If the stock rises sharply, the short call could be assigned, requiring the sale of shares at the strike price.
- Reward: Maximum profit occurs if the stock remains near the current price, allowing both options to decay favorably.
2. Mid-Term Spread (60-90 Days)
- Long Put: Strike price at 1% below the current stock price, expiring in 120 days.
- Short Call: Strike price at 1% above the current stock price, expiring in 60 days.
- Analysis:
- The short call has moderate time decay, while the long put provides extended protection.
- The spread benefits from a stable stock price and moderate volatility.
- Risk: Assignment risk is lower due to the slightly out-of-the-money short call.
- Reward: Profit is maximized if the stock remains within 1% of the current price.
3. Balanced Spread (90-120 Days)
- Long Put: Strike price at the current stock price, expiring in 150 days.
- Short Call: Strike price at 2% above the current stock price, expiring in 90 days.
- Analysis:
- The long put is at-the-money, providing strong downside protection with a higher Delta.
- The short call is slightly out-of-the-money, reducing assignment risk.
- Risk: If the stock falls sharply, the long put will gain value, but the short call may not fully offset losses.
- Reward: Profit is maximized if the stock remains stable or rises slightly.
4. Long-Term Spread (120-180 Days)
- Long Put: Strike price at 2% below the current stock price, expiring in 180 days.
- Short Call: Strike price at 3% above the current stock price, expiring in 120 days.
- Analysis:
- The long put provides extended downside protection with a higher Vega.
- The short call is further out-of-the-money, minimizing assignment risk.
- Risk: The long put may lose value if the stock rises, but the short call will offset some losses.
- Reward: Profit is maximized if the stock remains within 2% of the current price.
5. Ultra-Long-Term Spread (180+ Days)
- Long Put: Strike price at 1% below the current stock price, expiring in 240 days.
- Short Call: Strike price at 2% above the current stock price, expiring in 180 days.
- Analysis:
- The long put provides long-term downside protection with a high Vega.
- The short call benefits from moderate time decay and low assignment risk.
- Risk: The long put may lose value if the stock rises significantly, but the short call will partially offset losses.
- Reward: Profit is maximized if the stock remains stable or rises slightly.
Risk and Reward Scenarios:
- Best-Case Scenario: The stock remains within the target range (2%), allowing both options to decay favorably. The short call expires worthless, and the long put retains value.
- Worst-Case Scenario: The stock moves sharply in either direction. If the stock rises, the short call may be assigned, requiring the sale of shares at the strike price. If the stock falls, the long put will gain value, but the short call may not fully offset losses.
- Break-Even Points: The break-even points depend on the strike prices and premiums paid/received. For example, in the near-term spread, the break-even points might be 1.5% from the current stock price.
Conclusion:
The most profitable calendar spread strategy depends on the desired time horizon and risk tolerance. For aggressive traders, the near-term spread offers high Theta decay but higher assignment risk. For conservative traders, the long-term spread provides extended protection with lower assignment risk. By carefully selecting strike prices and expiration dates, traders can optimize the balance between risk and reward while targeting a 2% stock price movement.
Calendar Spread Option Strategy #2
To construct a profitable calendar spread options strategy for Oracle Corporation (ORCL) using a combination of selling a put option and buying a call option, we need to carefully analyze the Greeks and the risk-reward profile of each leg of the trade. The goal is to minimize the risk of assignment while targeting a stock price movement of 2% above or below the current stock price. Below, I will outline five potential calendar spread strategies, ranging from near-term to long-term expirations, and discuss their risk-reward profiles.
1. Near-Term Strategy: Sell Near-Term Put, Buy Mid-Term Call
- Sell Put Option: Expiration in 1 month, strike price 2% below the current stock price.
- Buy Call Option: Expiration in 3 months, strike price 2% above the current stock price.
Analysis: - Theta: The sold put will benefit from time decay (positive theta), while the bought call will have a slower decay rate (negative theta). This creates a net positive theta, which is favorable for the strategy. - Delta: The sold put will have a higher delta (closer to -1 if deep in the money), while the bought call will have a lower delta. This creates a net negative delta, meaning the strategy will benefit from a slight upward movement in the stock price. - Vega: The sold put will have negative vega, while the bought call will have positive vega. This creates a net negative vega, meaning the strategy will benefit from a decrease in implied volatility.
Risk-Reward: - Profit Potential: The maximum profit occurs if the stock price remains near the sold put strike at the near-term expiration, allowing the put to expire worthless, and then rises to the bought call strike by the mid-term expiration. - Risk: The primary risk is assignment on the sold put if the stock price falls significantly below the strike price. To mitigate this, ensure the sold put is not too deep in the money.
2. Mid-Term Strategy: Sell Mid-Term Put, Buy Long-Term Call
- Sell Put Option: Expiration in 3 months, strike price 2% below the current stock price.
- Buy Call Option: Expiration in 6 months, strike price 2% above the current stock price.
Analysis: - Theta: The sold put will decay faster than the bought call, creating a net positive theta. - Delta: The sold put will have a moderate delta, while the bought call will have a lower delta. This creates a net negative delta, favoring a slight upward movement. - Vega: The sold put will have negative vega, while the bought call will have positive vega. This creates a net negative vega, benefiting from a decrease in implied volatility.
Risk-Reward: - Profit Potential: The strategy profits if the stock price remains near the sold put strike at the mid-term expiration and then rises to the bought call strike by the long-term expiration. - Risk: Assignment risk is lower than in the near-term strategy due to the longer time frame, but it still exists if the stock price falls significantly.
3. Long-Term Strategy: Sell Long-Term Put, Buy Very Long-Term Call
- Sell Put Option: Expiration in 6 months, strike price 2% below the current stock price.
- Buy Call Option: Expiration in 12 months, strike price 2% above the current stock price.
Analysis: - Theta: The sold put will decay faster than the bought call, creating a net positive theta. - Delta: The sold put will have a lower delta, while the bought call will have a slightly higher delta. This creates a net negative delta, favoring a slight upward movement. - Vega: The sold put will have negative vega, while the bought call will have positive vega. This creates a net negative vega, benefiting from a decrease in implied volatility.
Risk-Reward: - Profit Potential: The strategy profits if the stock price remains near the sold put strike at the long-term expiration and then rises to the bought call strike by the very long-term expiration. - Risk: Assignment risk is minimal due to the longer time frame, but the strategy requires a longer holding period.
4. Aggressive Strategy: Sell Near-Term Put, Buy Long-Term Call
- Sell Put Option: Expiration in 1 month, strike price 2% below the current stock price.
- Buy Call Option: Expiration in 12 months, strike price 2% above the current stock price.
Analysis: - Theta: The sold put will decay rapidly, while the bought call will decay slowly, creating a net positive theta. - Delta: The sold put will have a higher delta, while the bought call will have a lower delta. This creates a net negative delta, favoring a slight upward movement. - Vega: The sold put will have negative vega, while the bought call will have positive vega. This creates a net negative vega, benefiting from a decrease in implied volatility.
Risk-Reward: - Profit Potential: The strategy profits if the stock price remains near the sold put strike at the near-term expiration and then rises to the bought call strike by the long-term expiration. - Risk: Assignment risk is higher due to the near-term expiration of the sold put.
5. Conservative Strategy: Sell Mid-Term Put, Buy Very Long-Term Call
- Sell Put Option: Expiration in 3 months, strike price 2% below the current stock price.
- Buy Call Option: Expiration in 12 months, strike price 2% above the current stock price.
Analysis: - Theta: The sold put will decay faster than the bought call, creating a net positive theta. - Delta: The sold put will have a moderate delta, while the bought call will have a lower delta. This creates a net negative delta, favoring a slight upward movement. - Vega: The sold put will have negative vega, while the bought call will have positive vega. This creates a net negative vega, benefiting from a decrease in implied volatility.
Risk-Reward: - Profit Potential: The strategy profits if the stock price remains near the sold put strike at the mid-term expiration and then rises to the bought call strike by the very long-term expiration. - Risk: Assignment risk is moderate due to the mid-term expiration of the sold put.
Conclusion
The most profitable strategy depends on your risk tolerance and time horizon. For aggressive traders, the Aggressive Strategy (Sell 1-month Put, Buy 12-month Call) offers the highest potential return but carries higher assignment risk. For conservative traders, the Conservative Strategy (Sell 3-month Put, Buy 12-month Call) minimizes assignment risk while still providing a favorable risk-reward profile. Always monitor the Greeks and adjust the strategy as needed to manage risk.
Similar Companies in Software - Infrastructure:
Palo Alto Networks, Inc. (PANW), CrowdStrike Holdings, Inc. (CRWD), Microsoft Corporation (MSFT), Block, Inc. (SQ), Adobe Inc. (ADBE), Report: Palantir Technologies Inc. (PLTR), Palantir Technologies Inc. (PLTR), Zscaler, Inc. (ZS), Cloudflare, Inc. (NET), Okta, Inc. (OKTA), UiPath Inc. (PATH), Nutanix, Inc. (NTNX), International Business Machines Corporation (IBM), SAP SE (SAP), Salesforce, Inc. (CRM), Report: Amazon.com, Inc. (AMZN), Amazon.com, Inc. (AMZN), Report: Google LLC (GOOGL), Google LLC (GOOGL), Report: Hewlett Packard Enterprise Company (HPE), Hewlett Packard Enterprise Company (HPE), Dell Technologies Inc. (DELL), ServiceNow, Inc. (NOW), Workday, Inc. (WDAY)
https://seekingalpha.com/article/4751345-oracle-time-to-bet-big-on-500-billion-stargate-stardom
https://www.youtube.com/watch?v=aS2vXyinaQ8
https://www.youtube.com/watch?v=FSsX4i72slo
https://seekingalpha.com/article/4751723-trump-trade-top-high-yield-stocks-for-new-administration
https://www.fool.com/investing/2025/01/24/stargate-ai-stocks-nvda-stock-openai-oracle/
https://www.fool.com/investing/2025/01/24/why-oracle-stock-skyrocketed-this-week/
https://www.youtube.com/watch?v=8B4ZT-GcAgU
https://seekingalpha.com/article/4751932-ge-vernova-has-major-megatrends-taking-place
https://finance.yahoo.com/news/oracle-corporation-orcl-expands-ai-001406391.html
https://finance.yahoo.com/m/6e408582-8d7d-3eaa-bcf4-4405cdb20512/why-donald-trump-is-racing-so.html
https://finance.yahoo.com/m/e042fe13-fc2a-3104-890e-5396d3e96c19/musk-altman-feud-reaches.html
https://finance.yahoo.com/m/f2f46e71-62ed-36d5-ac0e-dcdccb3a4eea/prediction%3A-this-stock-will.html
https://www.sec.gov/Archives/edgar/data/1341439/000095017024134973/orcl-20241130.htm
Copyright © 2025 Tiny Computers (email@tinycomputers.io)
Report ID: DBP6s1
Cost: $0.00000
https://reports.tinycomputers.io/ORCL/ORCL-2025-01-26.html Home