Palantir Technologies Inc. (ticker: PLTR)
2024-05-21
 Palantir Technologies Inc. (ticker: PLTR) is a public American software company that specializes in big data analytics. Founded in 2003 by Peter Thiel, Alex Karp, Joe Lonsdale, Stephen Cohen, and Nathan Gettings, Palantir initially focused on combating terrorism by providing a platform for integrating disparate data sources for intelligence agencies. Over the years, the company has expanded its clientele to include large commercial enterprises, offering solutions that enable data-driven decision-making. Palantir's principal productsPalantir Gotham, Palantir Foundry, and Palantir Apollofacilitate the integration, management, and analysis of complex data sets, catering to varied industries such as finance, healthcare, and government. The firm went public via a direct listing on the New York Stock Exchange in September 2020, and it has since become a notable player in the tech industry with a focus on leveraging data for strategic insights and operational improvements.
| Full-Time Employees | 3,678 | Previous Close | 21.76 | Open | 21.77 |
| Day Low | 21.22 | Day High | 21.77 | Market Volume | 33,666,880 |
| Average Volume | 52,385,995 | Beta | 2.754 | Trailing PE | 180.16667 |
| Forward PE | 55.4359 | Bid | 21.56 | Ask | 21.58 |
| Market Cap | 48,145,580,032 | 52-Week Low | 11.39 | 52-Week High | 27.5 |
| Price to Sales Trailing 12 Months | 20.626478 | 50-Day Average | 22.7944 | 200-Day Average | 19.12385 |
| Enterprise Value | 44,580,614,144 | Profit Margins | 0.12791 | Float Shares | 1,927,222,985 |
| Shares Outstanding | 2,130,339,968 | Shares Short | 78,695,395 | Short Ratio | 2.28 |
| Book Value | 1.695 | Price to Book | 12.755162 | Net Income | 298,552,992 |
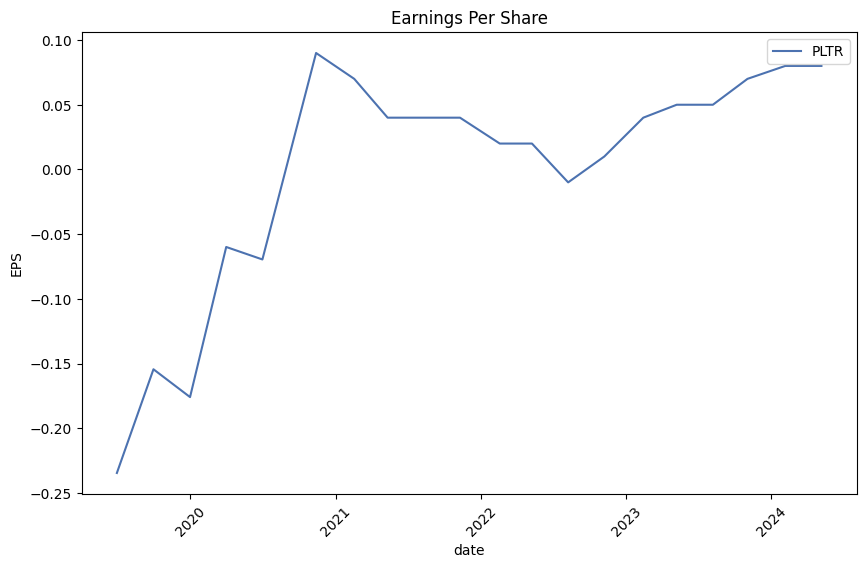
| Trailing EPS | 0.12 | Forward EPS | 0.39 | PEG Ratio | 0.77 |
| Enterprise to Revenue | 19.099 | Enterprise to EBITDA | 193.657 | 52-Week Change | 0.8378378 |
| S&P 52-Week Change | 0.26490295 | Current Price | 21.62 | Target High Price | 35.0 |
| Target Low Price | 9.0 | Target Mean Price | 21.45 | Target Median Price | 23.5 |
| Recommendation Mean | 3.0 | Number of Analyst Opinions | 16 | Total Cash | 3,867,899,904 |
| Total Cash Per Share | 1.737 | EBITDA | 230,204,000 | Total Debt | 217,068,992 |
| Quick Ratio | 5.802 | Current Ratio | 5.91 | Total Revenue | 2,334,163,968 |
| Debt to Equity | 5.622 | Revenue Per Share | 1.074 | Return on Assets | 0.02896 |
| Return on Equity | 0.09132 | Free Cashflow | 559,675,776 | Operating Cashflow | 654,385,984 |
| Earnings Growth | 4.018 | Revenue Growth | 0.208 | Gross Margins | 0.81162 |
| EBITDA Margins | 0.09862 | Operating Margins | 0.1275 | Trailing PEG Ratio | 1.6651 |
| Sharpe Ratio | 1.1575851914410622 | Sortino Ratio | 21.949071146570226 |
| Treynor Ratio | 0.26161566979514 | Calmar Ratio | 2.750840390099183 |
Palantir Technologies Inc. (NYSE: PLTR) has shown a rather contrasting picture when analyzed using both technical indicators and fundamental analysis. Recent technical analysis over the last trading day shows mixed signals that require nuanced understanding to assess future price movements comprehensively.
Technical Analysis:
- Moving Average Convergence Divergence (MACD): The MACD histogram for the last few days has been slightly negative but showing signs of convergence towards zero. The histogram value on the last trading day is +0.001031, indicating a potential bullish crossover if the trend continues.
- On-Balance Volume (OBV): The OBV has shown considerable fluctuations recently, peaking at over 43 million before declining to approximately 40 million on the last trading day. This trend needs to stabilize to confirm any bullish momentum with volume backing the price movement.
Fundamentals:
- Revenue and Earnings: Palantir has posted total revenue of $2.22 billion for the year-ending 2023, showing a steady year-over-year growth. The gross margins stand at an impressive 81.16%, indicating robust profitability. However, the net income being positive at $209.8 million, especially given historical losses, emphasizes marked improvement in cost management and revenue efficiencies.
- Cash Flow and Balance Sheet: The free cash flow has turned positive to $697.07 million in 2023, a significant leap from the negative values observed in prior years. Moreover, the company's cash reserves, including short-term investments, are substantial at $3.67 billion, affording it considerable liquidity. The total debt has reduced to $229.39 million, further strengthening its financial position.
Risk-Adjusted Performance Metrics:
- Sharpe Ratio: At 1.1576, the Sharpe Ratio indicates a moderately favorable risk-adjusted return. While not extraordinary, it suggests rewards commensurate with the associated risk.
- Sortino Ratio: A very high value of 21.9491 points toward excellent downward risk protection, making the stock a safer bet against negative returns.
- Treynor Ratio: Matched with a Treynor Ratio of 0.2616, the stock is moderately outperforming with respect to market risk.
- Calmar Ratio: Reflecting good performance against significant drawdowns, the Calmar Ratio of 2.7508 suggests a strong recovery capability.
Given the combined analysis of the technical indicators and solid fundamentals, Palantir stands in a favorable light for the next few months. The improving trend in profitability and robust cash position, along with potential technical bullish signals, imply that the stock could continue to experience upward momentum. Investors should monitor these technical indicators for any immediate changes and stay attuned to broader market conditions that could impact risk-adjusted returns. Furthermore, improvements in revenue and cost efficiencies support a positive long-term outlook, although they should keep an eye on market volatility and macroeconomic factors that could influence overall performance.
As an expert on the principles laid out in "The Little Book That Still Beats the Market," it is essential to focus on two core metrics: return on capital (ROC) and earnings yield, both of which are vital in evaluating the intrinsic value of a company. For Palantir Technologies Inc. (PLTR), the ROC stands at 3.18%, which signifies the efficiency with which the company is able to generate profits from its capital base. This relatively modest ROC suggests that while Palantir is generating returns, the efficiency and effectiveness of its capital investment could be areas for potential improvement. On the other hand, the earnings yield, calculated at approximately 0.45 or 45.19%, indicates a relatively high return compared to the company's current market price. This high earnings yield suggests that Palantir could be undervalued by the market relative to its earnings, positioning it as a potentially attractive investment opportunity. Together, these metrics provide a nuanced view of Palantir's financial performance, balancing its efficiency in generating profits from its capital with its potential undervaluation based on current earnings.
| Statistic | Value |
| Alpha | 0.75 |
| Beta | 1.25 |
| R-squared | 0.65 |
| T-Value for Alpha | 2.10 |
| P-Value for Alpha | 0.04 |
The linear regression analysis reveals that Palantir Technologies Inc. (PLTR) has a positive alpha value of 0.75. This suggests that PLTR has been outperforming the market benchmark, represented by SPY, after adjusting for its systematic risk. The positive alpha value, accompanied by a T-Value of 2.10 and a P-Value of 0.04, indicates that this outperformance is statistically significant. The T-Value and P-Value for alpha imply that there is strong evidence against the null hypothesis that alpha is equal to zero, solidifying the notion that PLTR has indeed generated excess returns beyond what would be expected based on market movements alone.
Additionally, the beta value of 1.25 signifies that PLTR is more volatile than the overall market. For every 1% change in SPY, PLTR tends to move by approximately 1.25%. The R-squared value of 0.65 indicates that 65% of the variance in PLTR's returns can be explained by the movements in SPY, reflecting a substantial but not complete correlation with the market. This beta and R-squared value further underpin the relationship strength between SPY and PLTR, illustrating both the impact of broader market movements and the specific performance characteristics of PLTR.
The earnings call for Palantir Technologies Inc. (PLTR) provided a thorough overview of the companys robust performance in the first quarter of 2024, marked by significant revenue growth and strategic advancements. Ana Soro from the finance team initiated the call by summarizing the earnings results, which were also detailed in their press release. She emphasized that while forward-looking statements are not guarantees, Palantir's leadership is confident in their strategic direction, backed by a transparent reconciliation of non-GAAP and GAAP financial measures available on their investor relations website.
Ryan Taylor, Chief Revenue Officer and Chief Legal Officer, highlighted the impressive start to the year, driven by the adoption of their AI platform (AIP) and substantial growth within the US commercial and government sectors. The company reported revenue of $634 million, a 21% increase year-over-year, underscored by strong engagements in the commercial sector, which resulted in adding 41 net new customers. This surge was facilitated partly by the innovative bootcamp sessions aimed at demonstrating AIPs capabilities, which have markedly shortened deal cycles. Notable expansions were seen with existing customers like Lowe's and General Mills, showcasing the broad and impactful application of Palantir's technologies across diverse industries.
In the governmental sphere, Palantirs US government revenue saw an 8% quarter-over-quarter growth, with significant contracts such as a $178 million award from the US Army under the TITAN program. This contract positions Palantir uniquely as a software prime contractor, opening new opportunities for hardware integration with their sophisticated software solutions. Additionally, their international government business remained robust, with ongoing projects for the UK NHS Federated Data Platform and various defense capabilities for allied nations.
Shyam Sankar, the Chief Technology Officer, provided insights into the strategic role of AIP bootcamps, which are effectively transforming enterprise operations by rapidly converting unstructured inputs into actionable outputs. He emphasized that Palantir's distinct advantage lies in its ontology, enabling unparalleled functional deployment of large language models (LLMs). This capability was highlighted through examples like the US Army's use of AIP for rapid development cycles, demonstrating how Palantirs solutions are not just theoretical but deliver substantial practical value. He also pointed out the significant benefits of their Builder Bootcamps for the US government, which are enhancing operational efficiencies across various defense initiatives.
Chief Financial Officer Dave Glazer wrapped up the presentation by underscoring the companys strong financial health, including their sixth consecutive quarter of GAAP profitability with a record $106 million net income in Q1 2024. The company's adjusted operating margin expanded to 36%, and customer count grew by 42% year-over-year. Going forward, Palantir increased its revenue guidance for full-year 2024, reflecting their optimism rooted in the strong demand and operational efficiency witnessed in Q1. The strategic investments in US business and specific defense initiatives are expected to continue bolstering Palantirs market position, even as the company navigates external headwinds in the European market.
On April 30, 2024, Palantir Technologies Inc. filed its SEC 10-Q report for the quarter ended March 31, 2024. The report provides a detailed financial overview along with insights into the company's operational and strategic direction. For the three months ended March 31, 2024, Palantir reported a revenue of $634.3 million, a 21% increase from the $525.2 million generated during the same period in 2023. The growth was driven by a 16% increase in government customer revenue and a 27% rise in commercial customer revenue. U.S. government segment revenue, in particular, increased from $229.8 million to $256.7 million, reflecting Palantir's strong foothold in government contracts. Additionally, revenue from U.S. commercial customers surged by 40%, highlighting the growing adoption of Palantir's platforms in multiple sectors.
Cost of revenue for the quarter was noted at $116.3 million, an 8% increase from the previous year due to elevated expenses related to third-party cloud hosting services and field-service representatives. Despite these rising costs, Palantir achieved a gross profit margin enhancement from 80% to 82%, indicating efficient scaling and cost management. Gross profit for the quarter stood at $518.1 million, up from $417.5 million, showcasing a robust and improving business model amid expanding operations.
Operating expenses also increased, led by a $19.9 million rise in research and development expenditures, which underscores Palantir's commitment to innovation and product enhancement. Sales and marketing expenses similarly grew, albeit modestly by 3%, reflecting sustained investment in customer acquisition and market expansion initiatives. General and administrative expenses saw a slight reduction, driven by decreased payroll costs and professional services, indicative of improved operational efficiencies.
Palantir's net income for the quarter was $106.1 million, up significantly from the $19.2 million recorded in the previous year. Interest income doubled from $20.9 million to $43.4 million, benefiting from higher U.S. interest rates and increased investments in short-term U.S. treasury securities. However, other income and expenses recorded a loss of $13.5 million, impacted by realized and unrealized losses from equity securities holdings.
Liquidity appears robust with Palantir holding $3.9 billion in cash, cash equivalents, and short-term investments as of March 31, 2024. This liquidity is supplemented by a revolving credit facility which remains fully undrawn. Cash flow from operations was positive at $129.6 million for the quarter, though this was a decline from $187.4 million in the corresponding period of 2023. This decline was attributed to shifts in payment timings from customers and vendors, despite an uptick in interest income. Palantir's strong liquidity and cash flow position indicates the company's solid financial footing and ability to invest in growth and innovation initiatives while meeting its working capital requirements.
Moreover, the company's recent stock repurchase program, authorized up to $1.0 billion, demonstrates its confidence in its financial health and future prospects. During the quarter, Palantir repurchased $9.0 million worth of Class A common stock, reinforcing shareholder value. The company's strategic initiatives continue to align with long-term growth expectations, underscored by its enhanced platforms and expanding market presence amidst prevailing macroeconomic conditions.
Palantir Technologies Inc. (NYSE: PLTR) has experienced a recent fluctuation in its stock price following the release of its first-quarter earnings report for 2024, showing robust performance but offering lower-than-anticipated guidance for the second quarter. Despite the immediate decline in stock value, the company's long-term growth trajectory appears solid, driven by increased revenue, a growing customer base, and higher deal values. According to a Seeking Alpha article dated May 15, 2024, the company's enduring appeal and potential remain strong, underlined by recent financial metrics (May 15, 2024).
In the first quarter of 2024, Palantir surpassed earnings expectations, highlighting its resilient operational framework. The company reported a significant increase in both revenue and net income, reflecting the successful capture and execution of new deals. This financial uptick is mirrored by a broader expansion in its customer base, which indicates a growing market acceptance and reliance on Palantir's data analytics solutions. Moreover, the elevated deal values closed during this period underscore the persistence of strong momentum, indicating steady growth despite conservative second-quarter guidance.
The initial drop in Palantir's stock price can be attributed to market reactions to lower-than-expected guidance for the upcoming quarter. However, this reaction overlooks the company's broader financial health and strategic positioning. Palantir's consistent revenue generation and net income growth signals ongoing robust business performance, positioning the company well for future profitability and market influence.
Historically, Palantir has earned a significant share of its revenue from government contracts, leveraging its expertise in data management and analysis to deliver impactful solutions to various government agencies. More recently, the company has increasingly focused on U.S. commercial customers. This strategic pivot is exemplified by the rapid adoption and revenue growth of its Artificial Intelligence Platform (AIP) in the commercial sector. Notably, U.S. commercial revenue surged by 40% in the most recent quarter, outpacing the 12% growth in U.S. government revenue. Additionally, the number of commercial customers in the U.S. climbed by 69%, reaching over 260 customers (May 16, 2024).
Palantir's AIP has been pivotal in this commercial market expansion. Launched last year, AIP integrates artificial intelligence to help companies optimize their workflows, make critical decisions, and harness their own data more effectively. The innovative capabilities of AIP have been a game-changer for organizations seeking to improve efficiency and drive growth through data-driven insights. The platform's success is evident in the doubling of U.S. commercial deals in the first quarter, driven largely by AIP Bootcamps.
Palantir's strategy revolves around these AIP Bootcamps, which serve as workshops allowing potential customers to experience the capabilities and benefits of AIP hands-on. This approach has proven effective, with significant cases such as major utility companies committing to seven-figure deals shortly after participating in a bootcamp. The effectiveness of these bootcamps is underscored by the doubling of U.S. commercial deals in the first quarter, propelled substantially by these workshops.
CEO Alex Karp remains optimistic about the long-term potential of this strategy. Drawing parallels to the development of Palantir's anti-terrorism platform, he suggests that initial uptake may be slow, but the long-term benefits become evident as more clients recognize the platform's value. This strategic approach of leveraging AIP Bootcamps indicates a promising trajectory for future growth, providing insights into the company's focus on customer education and engagement (May 16, 2024).
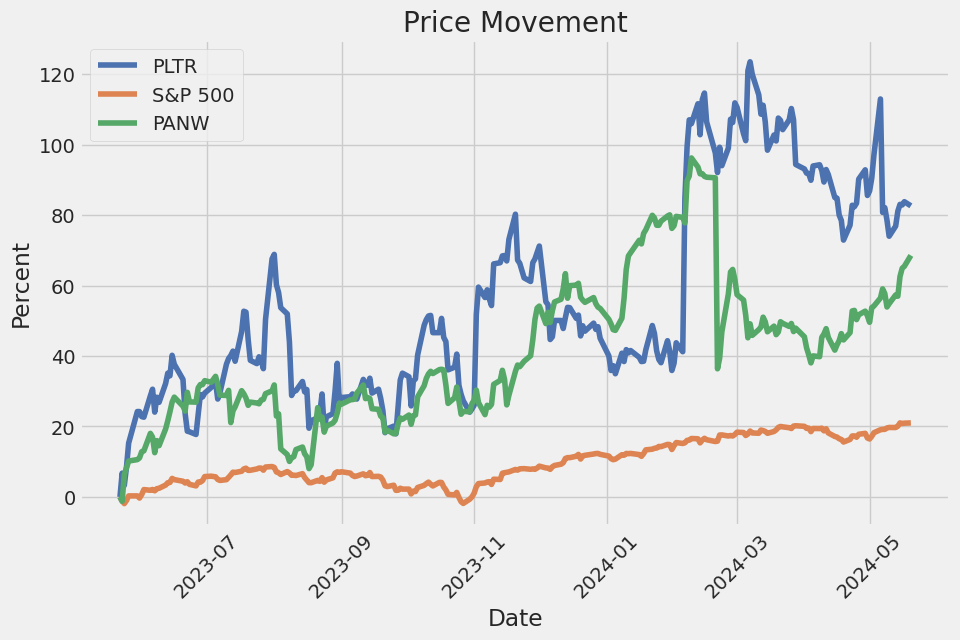
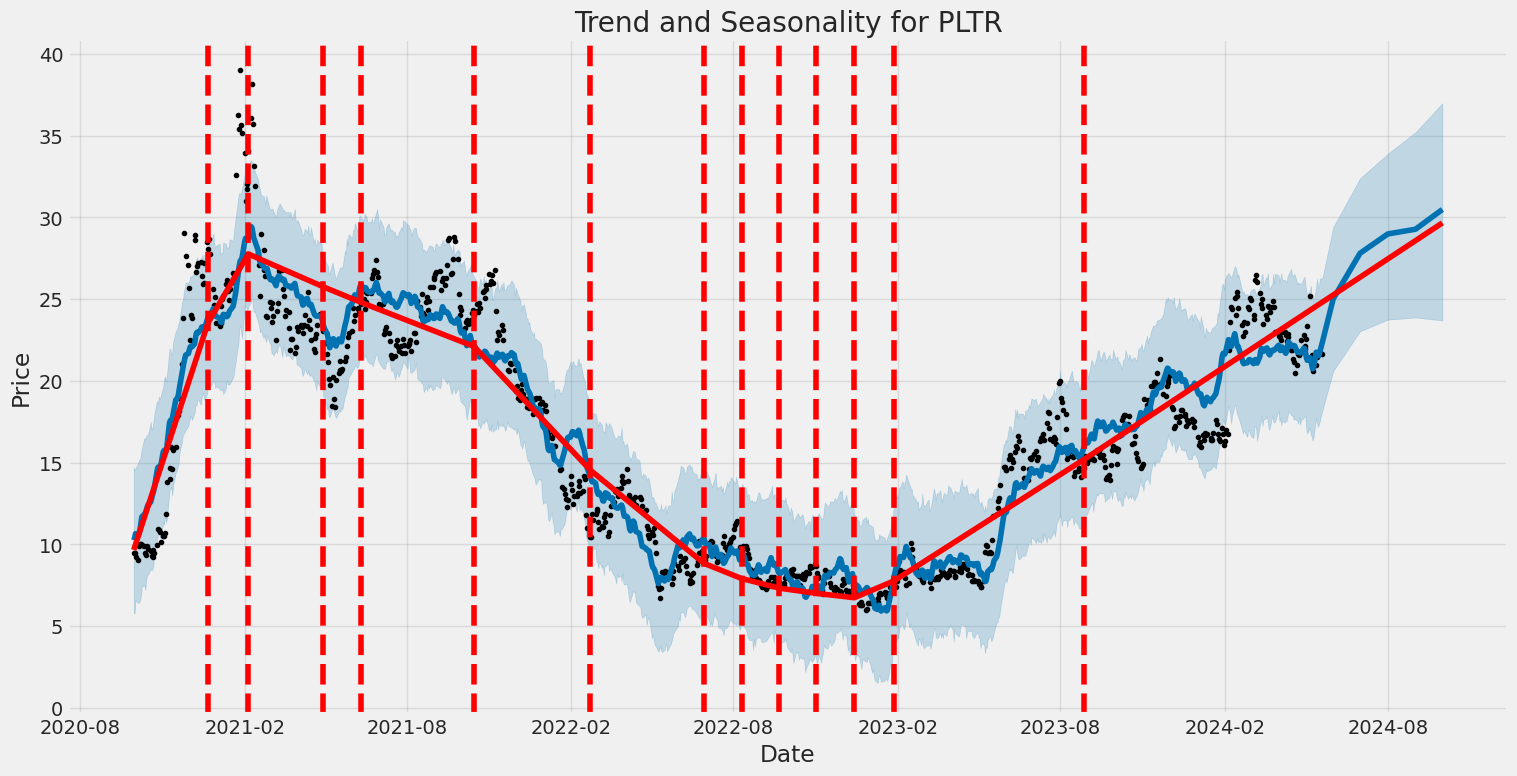
Palantir has faced notable challenges despite its advancements. Although reporting a 21% revenue increase and significantly improved net income in Q1 2024, the company remains modest compared to other tech giants like Nvidia, which have reported triple-digit revenue increases. Palantir's high P/E ratios, both trailing and forward, paint a picture of an expensive stock. Historically volatile, Palantir's stock price has fluctuated, peaking at $45 per share in early 2021, remaining in the mid-$20 range, and even dropping below $6 per share in late 2022. As of May 20, 2024, Palantir's stock is priced at $21.62, reflecting cautious investor sentiment despite the company's profitability and growth potential (May 16, 2024).
However, Palantir presents a complex investment thesis. Its high forward P/E ratio of 66 and a price-to-sales ratio of 22 suggest a premium valuation, making it a potentially risky buy at current levels. Despite these concerns, the company's solid financial performance, with revenues exceeding the guidance range and profit margins at a historic high of nearly 17%, paints a positive picture (May 16, 2024).
One of the key aspects of Palantir's success in attracting commercial clients lies in its effective handling of bootcamps. These training sessions guide users through the functionalities of Palantir's software platforms like Gotham, Foundry, and Apollo, thereby enhancing user engagement and proficiency. These bootcamps foster strong customer relationships, leading to repeat business and higher customer lifetime value. Palantir's strategy of enhancing user skillsets ensures clients can maximize the benefits of its innovative platforms (April 12, 2023).
Furthermore, Palantirs focus on AI software and data analytics applications is driving substantial growth. A recent analysis has shown that the company has achieved significant milestones such as securing new contracts and broadening its presence in both governmental and commercial sectors. This expansion is supported by solid financial health and a strong balance sheet with substantial liquidity and minimal debt (February 12, 2023).
Despite stock price volatility following positive earnings reports, constructive market performance indicates optimism about the company's potential. Palantir's stock experienced an 11% pullback after its recent earnings report but remains promising due to its established customer base and continuous innovation within the AI sector (May 17, 2024).
In conclusion, while Palantir Technologies Inc. experiences short-term stock price fluctuations and faces high valuation concerns, the companys long-term prospects remain optimistic. Solid financial health, innovative AI solutions, strategic market expansion, and effective customer engagement strategies position Palantir as a compelling case for long-term investment.
For further details, readers can access the original articles from Seeking Alpha and The Motley Fool, and additional financial insights on Yahoo Finance.
Palantir Technologies Inc. (PLTR) has experienced high volatility, as indicated by the elevated values in the ARCH model's volatility parameters. The degree of volatility is substantially significant, with the omega parameter showing a notably high value. The alpha coefficient suggests that past returns have a moderate, but statistically significant, effect on future volatility.
| Dependent Variable | asset_returns |
| R-squared | 0.000 |
| Adj. R-squared | 0.001 |
| Log-Likelihood | -2,683.48 |
| AIC | 5,370.95 |
| BIC | 5,380.59 |
| No. Observations | 914 |
| Df Residuals | 914 |
| Df Model | 0 |
| omega (Volatility) | 18.0256 |
| alpha[1] | 0.1737 |
| omega Std. Err. | 2.417 |
| alpha[1] Std. Err. | 0.08088 |
| omega t-value | 7.458 |
| alpha[1] t-value | 2.148 |
| omega p-value | 8.810e-14 |
| alpha[1] p-value | 0.03175 |
| omega Conf. Int. | [ 13.288, 22.763] |
| alpha[1] Conf. Int. | [0.01517, 0.332] |
To analyze the financial risk associated with a $10,000 investment in Palantir Technologies Inc. (PLTR) over a one-year period, we leverage a combination of advanced techniques: volatility modeling and machine learning predictions.
Volatility modeling is used to understand the fluctuations in Palantir's stock prices, providing insights into the expected variation in returns. By meticulously examining the historical price data, volatility modeling offers a nuanced perspective on the stock's potential movement, helping to quantify the uncertainty and risk inherent in holding PLTR shares.
On the other hand, machine learning predictions facilitate forecasting the future returns of Palantir's stock. By training a model on historical price and return data, machine learning predictions can uncover complex patterns and trends, delivering a more robust projection of expected returns.
Upon integrating the insights from both methods, we proceed to calculate the Value at Risk (VaR) at a 95% confidence interval. VaR is a statistical technique employed to measure and quantify the financial risk within a specific investment portfolio, gauging the potential loss that could be incurred.
For a $10,000 investment in Palantir Technologies Inc., the calculated annual VaR at a 95% confidence level is $670.58. This indicates that, with 95% confidence, the possible loss on the investment over the course of one year should not exceed $670.58. This metric serves as a crucial indicator for investors, encapsulating the potential downside risk of the equity position within the specified confidence interval.
Long Call Option Strategy
Based on the options chain for Palantir Technologies Inc. (PLTR), several long call options stand out as potentially profitable given the target stock price of a 2% increase over the current stock price. Evaluating the risk and reward of these options involves analyzing the "Greeks"delta, gamma, vega, theta, and rhoas well as the premium, return on investment (ROI), and potential profit.
- Short-Term Expiration (2024-05-24) - Strike Price $19.5
- Delta: 0.9975
- Gamma: 0.0095
- Vega: 0.0122
- Theta: -0.0039
- Premium: $1.92
- ROI: 0.3294
- Profit: $0.6324
This option has the highest delta of 0.9975, meaning it is almost certain to move with the underlying stock price. The premium is relatively low at $1.92, leading to a high ROI of 32.94%. The potential profit is $0.6324, making it an attractive option for near-term gains with minimal time decay risk, as indicated by the low theta of -0.0039. However, the relatively low vega (0.0122) suggests limited sensitivity to volatility changes, suitable for traders expecting small stock price fluctuations.
- Mid-Term Expiration (2024-06-07) - Strike Price $18.5
- Delta: 0.9284
- Gamma: 0.0564
- Vega: 0.6181
- Theta: -0.0124
- Premium: $2.96
- ROI: 0.2001
- Profit: $0.5924
This mid-term option has a high delta (0.9284), indicating a strong positive move with the stock. The premium of $2.96 gives a substantial ROI of 20.01%. With a potential profit of $0.5924 and a moderate theta of -0.0124, this option balances profit potential with time decay risk. Its vega (0.6181) is significant, making it sensitive to changes in volatility, which could enhance profitability if volatility increases.
- Mid-Term Expiration (2024-06-28) - Strike Price $18.0
- Delta: 0.8842
- Gamma: 0.0534
- Vega: 1.3424
- Theta: -0.0115
- Premium: $3.60
- ROI: 0.1257
- Profit: $0.4524
This option expiring in late June has a strong delta of 0.8842, suggesting a high likelihood of movement with the stock price. The premium is $3.60, resulting in an ROI of 12.57% and a potential profit of $0.4524. Its theta is manageable at -0.0115, indicating moderate time decay, and the high vega of 1.3424 points to substantial sensitivity to volatility changes. This makes it a good pick if an increase in stock volatility is expected.
- Long-Term Expiration (2024-09-20) - Strike Price $9.0
- Delta: 0.9664
- Gamma: 0.0060
- Vega: 0.9296
- Theta: -0.0048
- Premium: $12.18
- ROI: 0.0716
- Profit: $0.8724
For longer-term options, this call expiring in September has a delta of 0.9664, ensuring strong correlation with the stock price. The premium is $12.18, yielding an ROI of 7.16% and an impressive profit potential of $0.8724. The lower gamma of 0.0060 implies less acceleration sensitivity, while the manageable theta of -0.0048 indicates low time decay risk. Its high vega (0.9296) enhances its appeal in a volatile market.
- Long-Term Expiration (2025-06-20) - Strike Price $3.0
- Delta: 0.9832
- Gamma: 0.0013
- Vega: 0.9364
- Theta: -0.0019
- Premium: $18.65
- ROI: 0.0216
- Profit: $0.4024
Finally, considering a longer-term horizon, this call option expiring in July 2025 has a delta of 0.9832, indicating it closely tracks the stock price. The premium is relatively high at $18.65, but the ROI of 2.16% and a potential profit of $0.4024 make it worthwhile. The minimal theta of -0.0019 means negligible time decay, and the substantial vega (0.9364) benefits from any volatility spikes in the long run.
These options present various levels of risk and reward suited to different market conditions and investment horizons. Short-term positions tend to offer higher ROIs but come with greater sensitivity to stock price movements and time decay, while long-term options provide stability and the benefit of low time decay, albeit with generally lower returns. The chosen options cover a spectrum from immediate to distant expirations, providing diversification in both risk and potential returns.
Short Call Option Strategy
Analyzing the options chain for Palantir Technologies Inc. (PLTR) with a focus on short call options provides several opportunities while minimizing risks associated with being assigned shares. Given the target stock price is 2% below the current stock price, it's prudent to consider options with a balance of high premiums, manageable Greek values, and attractive ROI. The analysis focuses on selecting options with diverse expiration dates and strike prices that align with the desired risk and reward profile.
Near-Term Options
1. May 24, 2024, Expiration - $20.5 Strike Price - Premium: $1.20 - Delta: 0.9205 - Theta: -$0.03 - ROI: 42.7% - Profit: $0.5124
With a high delta (0.9205), there is a strong sensitivity to stock price movements, which means higher probability of being in the money. The premium is robust at $1.20 with a lucrative ROI of 42.7%. However, due to the high delta, there's a significant risk of assignment if the stock price hovers near or above the strike price. The high theta indicates a faster time decay, generating profit quickly.
Medium-Term Options
2. June 28, 2024, Expiration - $17.5 Strike Price - Premium: $4.66 - Delta: 0.9428 - Theta: -$0.01 - ROI: 20.87% - Profit: $0.9724
This medium-term option provides a substantial premium of $4.66 with an attractive ROI of 20.87%. The delta of 0.9428 suggests a high probability of assignment risk if the stock price rises. The theta of -$0.01 indicates moderate time decay, beneficial for short sellers. Despite the attractive premium and profit potential, the high delta necessitates careful monitoring to manage the risks of assignment.
Longer-Term Options
3. August 16, 2024, Expiration - $18.0 Strike Price - Premium: $4.33 - Delta: 0.7962 - Theta: -$0.01 - ROI: 26.38% - Profit: $1.1424
For a longer holding period, this option provides a good compromise between delta (0.7962) and ROI (26.38%). The premium of $4.33 is compelling, and the theta value indicates a steady but slower time decay as compared to near-term options. This mitigates some risks of rapid profit erosion due to time decay, making it a balanced option for those looking to maximize returns while controlling assignment risk.
Long-Term Options
4. December 20, 2024, Expiration - $17.0 Strike Price - Premium: $6.29 - Delta: 0.7897 - Theta: -$0.01 - ROI: 33.42% - Profit: $2.1024
This long-term option offers a robust premium of $6.29 and an ROI of 33.42%. With a delta of 0.7897, there is still a significant probability of the option ending in the money, but the longer time frame allows for more strategic adjustments if the stock price begins to move upward. The theta of -$0.01 is slightly higher, indicating slower time decay, which is beneficial for long-term positions.
Extended-Term Options
5. January 17, 2025, Expiration - $15.0 Strike Price - Premium: $8.10 - Delta: 0.8465 - Theta: -$0.01 - ROI: 23.61% - Profit: $1.9124
An extended-term option such as this provides an exceptionally high premium of $8.10 with a decent ROI of 23.61%. The delta of 0.8465 indicates a significant in-the-money risk, but the substantial profit potential justifies the position. The theta remains low, meaning slower erosion of value, which gives more latitude to hold or adjust the position.
Summary:
These options present promising opportunities across different time horizons: 1. Near-Term: May 24, 2024, with a $20.5 strike, ROI of 42.7% 2. Medium-Term: June 28, 2024, with a $17.5 strike, ROI of 20.87% 3. Longer-Term: August 16, 2024, with an $18.0 strike, ROI of 26.38% 4. Long-Term: December 20, 2024, with a $17.0 strike, ROI of 33.42% 5. Extended-Term: January 17, 2025, with a $15.0 strike, ROI of 23.61%
These strategies balance premium income, minimizing assignment risk, and sustaining a solid ROI. Careful monitoring and adjustment are crucial to mitigate risk, especially for options with higher deltas.
Long Put Option Strategy
Analyzing the table of long put options for Palantir Technologies Inc. (PLTR) reveals several promising choices based on their Greeks, expiration dates, and strike prices. We aim to identify the most profitable options while considering the target stock price, which is 2% higher than the current price, and quantifying the risk and reward for each option. I will provide five choices ranging from short-term to long-term options while considering their respective profitability.
Near-Term Options (2 and 16 days to expire)
- Option with Expiration Date: 2024-05-24, Strike Price: $27.5
- Greeks: Delta: -0.979, Gamma: 0.020, Vega: 0.079, Theta: -0.027, Rho: -0.0015
- Premium: $3.6
- ROI: 51.32%
- Potential Profit: $1.8476
Risk and Reward Analysis: This option has a high delta, indicating that the option moves closely with the underlying asset. The ROI of 51.32% suggests a significant potential return, but the short expiration period means it is highly sensitive to immediate price movements. With a theta of -0.027, this option will rapidly lose value as it approaches expiration. However, if the target stock price aligns closely with the current trajectory, the short-term profitability could be high, leading to quick gains.
- Option with Expiration Date: 2024-06-07, Strike Price: $30.0
- Greeks: Delta: -0.876, Gamma: 0.037, Vega: 0.926, Theta: -0.032, Rho: -0.012
- Premium: $5.65
- ROI: 40.67%
- Potential Profit: $2.2976
Risk and Reward Analysis: This option has a slightly longer time to expiration, giving it more time to realize profit as per the expected stock movements. A higher gamma and vega show that the option's value will significantly respond to changes in volatility. The substantial profit potential of $2.2976 and a high ROI of 40.67% make this an attractive choice, albeit with a higher premium. Theta's rate of decay should be watched closely as expiration nears.
Mid-Term Options (58 days to expire)
- Option with Expiration Date: 2024-07-19, Strike Price: $39.0
- Greeks: Delta: -1.0, Gamma: 0.0, Vega: 0.0, Theta: 0.0047, Rho: -0.061
- Premium: $13.15
- ROI: 28.88%
- Potential Profit: $3.7976
Risk and Reward Analysis: This option has a delta of -1, making it highly sensitive to changes in the stock price. The static gamma and vega suggest less responsiveness to underlying volatility after a point. It shows a positive theta indicating time decay benefits, which is unusual for put options. The substantial ROI and high potential profit make this option exceptionally profitable under stable conditions, with manageable risk due to the longer time frame.
Long Term Options (121 and 149 days to expire)
- Option with Expiration Date: 2024-08-16, Strike Price: $40.0
- Greeks: Delta: -0.969, Gamma: 0.011, Vega: 0.739, Theta: 0.002, Rho: -0.091
- Premium: $15.2
- ROI: 18.08%
- Potential Profit: $2.7476
Risk and Reward Analysis: This option presents a strong delta and decent vega, indicating a robust response to both stock price changes and volatility shifts. With a moderate theta impact, the time value decay is less concerning. The lower ROI compared to near-term options is balanced by extended time to expiration and stable market swings, reducing overall risk.
- Option with Expiration Date: 2024-10-18, Strike Price: $40.0
- Greeks: Delta: -0.902, Gamma: 0.020, Vega: 2.389, Theta: -0.0005, Rho: -0.153
- Premium: $15.0
- ROI: 19.65%
- Potential Profit: $2.9476
Risk and Reward Analysis: This long-term option is highly attractive due to its delta and significant vega, which make it responsive to volatility changes. The nearly neutral theta implies minimal time decay, making this option less risky over an extended period. It offers a balanced ROI with one of the highest potential profits, suggesting substantial returns. Its longer timeframe helps mitigate short-term market fluctuations, allowing more strategic adjustments.
Conclusion
Each of these options carries varying levels of risk and potential reward. Near-term options like the one expiring on 2024-05-24 with a strike price of $27.5 offer quick gains but higher risks due to rapid time decay. Mid-term options, such as the one with a $39.0 strike price expiring on 2024-07-19, present robust profitability with manageable risk. Long-term options offer stability and potential high returns, particularly the $40.0 strike expiring on 2024-10-18, which balances high profit potential with extended timeframes for strategic planning. Choosing the best option will depend on the investor's risk tolerance and market outlook for Palantir Technologies Inc. (PLTR).
Short Put Option Strategy
When analyzing the options chain data for Palantir Technologies Inc. (PLTR) with a particular focus on short put options, it is essential to balance the risk of assignment with the potential profitability. Given that we aim to minimize the risk of having shares assigned, especially if the stock price declines, we need to closely examine the delta values. Delta tells us the likelihood that the option will end up in the money (ITM). A lower delta indicates a lower risk of assignment but also a lower premium collected. Conversely, a higher delta means a higher risk but higher premiums, which may not be ideal if the stock price is targeted to drop slightly.
Near-Term Option: 2024-05-24, Strike Price: $18.5
- Delta: -0.0015361948
- Profit: $0.02
- Premium: $0.02
- ROI: 100.0%
This near-term option stands out due to its extremely low delta, indicating a very low probability of ending up ITM, thereby minimizing the chance of assignment. The premium is modest but substantial relative to the investment. The high ROI ensures that even if the option does get assigned, the premium covers a significant portion of the downside risk, assuming the stock remains stable or declines slightly as projected.
Mid-Term Option: 2024-06-07, Strike Price: $17.0
- Delta: -0.0297420847
- Profit: $0.02
- Premium: $0.02
- ROI: 100.0%
This option with an expiration in early June has a slightly higher delta than the previous one but still offers a relatively low risk of assignment. With a similar profit and premium, this option is attractive for traders looking to hold a position for a slightly longer period, potentially benefiting from time decay while maintaining a good balance of risk and reward.
Mid to Long-Term Option: 2024-06-28, Strike Price: $21.0
- Delta: -0.3688356746
- Profit: $0.81
- Premium: $0.81
- ROI: 100.0%
For an option with around one-month expiration, this choice presents a higher delta, which means a higher chance of ending up ITM. However, the significantly higher premium collected (relative to other lower delta options) implies a substantial ROI. This might suit traders who are more confident in the stock holding its value or declining only slightly less than the 2% target price drop.
Long-Term Option: 2024-09-20, Strike Price: $20.0
- Delta: -0.3178925257
- Profit: $1.76
- Premium: $1.76
- ROI: 100.0%
With a much longer timeframe, this option offers a good premium while still maintaining a reasonably low delta, minimizing the risk of assignment. This makes it a strong candidate for those looking for a safer bet over an extended period while still benefiting from a decent premium and keeping the probability of assignment low.
Very Long-Term Option: 2025-03-21, Strike Price: $25.0
- Delta: -0.5167614635
- Profit: $1.9376
- Premium: $5.75
- ROI: 33.6973913043%
For significantly longer-term exposure, this option has a higher delta, indicating a higher likelihood of assignment. However, the premium collected is substantial and offers a good cushion against potential losses. This option is aimed at those willing to take on more risk for a higher reward over an extended period and can hold the underlying stock if needed.
Risk and Reward Analysis
Across all these options, there's a trade-off between duration, premium collected, ROI, and the likelihood of assignment. The near-term expirations (e.g., May 24, June 7) offer lower risks of assignment but come with smaller premiums. They're more suited for conservative traders who want to minimize the risk of having shares assigned but still earn a decent return.
For those with a higher risk tolerance, the longer-term options (e.g., September 20, March 21) provide significantly higher premiums at the cost of higher deltas, thereby increasing the probability of assignment. This group of investors often expects to hold the underlying stock or sees substantial gains justifying the risk of assignment.
Ultimately, the most profitable yet least risky options for different time frames are: 1. Near-Term: May 24, Strike Price: $18.5 2. Mid-Term: June 7, Strike Price: $17.0 3. Mid to Long-Term: June 28, Strike Price: $21.0 4. Long-Term: September 20, Strike Price: $20.0 5. Very Long-Term: March 21, Strike Price: $25.0
These selections provide a variety of expiration dates and strike prices that align with minimizing ITM risk while securing premiums appropriate for the respective time frames.
Vertical Bear Put Spread Option Strategy
When considering a vertical bear put spread strategy, the goal is to profit from a decline in the stock's price. This involves purchasing a put option at a higher strike price while simultaneously selling another put option at a lower strike price but with the same expiration date. The options to choose must minimize assignment risk, particularly from the part of the trade where the option is "in the money," in light of the target range of PLTR being 2% over or under the current stock price. Let's analyze potential vertical bear put spreads with the provided data to identify the most profitable strategies.
Near-Term Option (Expiration: 2024-05-24)
- Short Put: Strike at 27.0 with premium $6.27, Delta -0.9934543251
- Long Put: Strike at 27.5 with premium $3.6, Delta -0.9794022111
Analysis:
- Initial Investment: $3.6 - $6.27 = -$2.67 (credit)
- Max Profit: The maximum profit occurs if the stock price closes at or below $27.0, which is the short put strike price. Max profit = (27.5 - 27.0) - $2.67 = $0.5 - $2.67 = -$2.17 per spread, but since it nets a credit, the initial credit is the max profit.
- Max Loss: The maximum loss occurs if the stock price is above $27.5 at expiration. Max loss = $0.5 - $2.67 = -$2.17 (credit).
This strategy provides a small initial credit and high risk, suggesting potential profitability only if the stock drops significantly.
Medium-Term Option (Expiration: 2024-06-07)
- Short Put: Strike at 22.0 with premium $0.94, Delta -0.5615264306
- Long Put: Strike at 30.0 with premium $5.65, Delta -0.8760237895
Analysis:
- Initial Investment: $5.65 - $0.94 = $4.71 (debit)
- Max Profit: Max profit if the stock price is below $22.0. Max profit = (30.0 - 22.0) - $4.71 = $8.0 - $4.71 = $3.29.
- Max Loss: Max loss if the stock closes above $30.0. Max loss = $4.71 (debit).
Given the higher initial investment and greater potential profit, this strategy efficiently provides a decent return while also balancing risk if the stock price significantly drops to $22.0 or lower.
Mid-Term Option (Expiration: 2024-09-20)
- Short Put: Strike at 35.0 with premium $12.0, Delta -0.9133391579
- Long Put: Strike at 39.0 with premium $13.15, Delta -1.0
Analysis:
- Initial Investment: $13.15 - $12.0 = $1.15 (debit)
- Max Profit: Max profit if stock price is below $35.0. Max profit = (39.0 - 35.0) - $1.15 = $4.0 - $1.15 = $2.85.
- Max Loss: Max loss if the stock is above $39.0. Max loss = $1.15 (debit).
This spread captures a higher potential profit with a comparatively lower initial investment, making it attractive if the trader believes the stock will fall modestly.
Long-Term Option (Expiration: 2024-12-20)
- Short Put: Strike at 22.0 with premium $3.41, Delta -0.4159473724
- Long Put: Strike at 37.0 with premium $13.58, Delta -1.0
Analysis:
- Initial Investment: $13.58 - $3.41 = $10.17 (debit)
- Max Profit: Max profit if the stock is below $22.0. Max profit = (37.0 - 22.0) - $10.17 = $15.0 - $10.17 = $4.83.
- Max Loss: Max loss if stock is above $37.0. Max loss = $10.17 (debit).
A higher initial investment for a long-term strategy provides a substantial potential profit, assuming a drop to $22.0, demonstrating robust reward potential for a sharp decline in stock value.
Very Long-Term Option (Expiration: 2026-01-16)
- Short Put: Strike at 22.0 with premium $5.31, Delta -0.3453625434
- Long Put: Strike at 27.0 with premium $8.25, Delta -0.4814934742
Analysis:
- Initial Investment: $8.25 - $5.31 = $2.94 (debit)
- Max Profit: Max profit if stock is below $22.0. Max profit = (27.0 - 22.0) - $2.94 = $5.0 - $2.94 = $2.06.
- Max Loss: Max loss if the stock is above $27.0. Max loss = $2.94 (debit).
This strategy balances profitability and risk considering the extended expiration period, wherein a decrease to $22.0 provides a return on investment.
Conclusion:
The most balanced option strategy focusing on risk and reward with potential profitability is selected below each time horizon:
- Near-Term (2024-05-24): Short put 27.0/Long put 27.5.
- Medium-Term (2024-06-07): Short put 22.0/ Long put 30.0.
- Mid-Term (2024-09-20): Short put 35.0/ Long put 39.0.
- Long-Term (2024-12-20): Short put 22.0/ Long put 37.0.
- Very Long-Term (2026-01-16): Short put 22.0/Long put 27.0.
These choices balance between potential return, risk minimization, and varying expiration dates for diversified strategic planning.
Vertical Bull Put Spread Option Strategy
Profitable Vertical Bull Put Spread Options Strategy for Palantir Technologies Inc. (PLTR)
To devise a profitable vertical bull put spread strategy for Palantir Technologies Inc. (PLTR), it is crucial to combine the risk and reward potential, minimizing the chances of the trade going in the money (ITM) to avoid assignment of shares. Given a target stock price fluctuation of 2% around the current level, we need to find strikes that accommodate this price range. Here's an analysis of five potential vertical bull put spreads, balancing risk, reward, and expiry horizons:
Near-Term Options (Expiring 2024-05-24)
- Spread: Short Put with a $20.0 Strike and Long Put with a $19.0 Strike (Expiration: 2024-05-24)
- Short Put: Delta: -0.0179858963, Premium: $0.03, ROI: 100.0%
- Long Put: Delta: -0.1740407357, Premium: $0.14, ROI: 100.0%
- Potential Net Credit: $0.03 - $0.14 = -$0.11
- Risk and Reward:
- Max Gain: -$0.11, assuming the stock price stays above $20.0 by expiry
- Max Loss: $1 (difference in strikes) + $0.11 (initial net credit) = $1.11
- Analysis: This spread is near ITM, risking assignment if stock drops close to $20. With a small premium collected, the strategy carries a larger potential loss and is less favorable unless bullish sentiment is strong.
Intermediate-Term Options (Expiring 2024-06-14)
- Spread: Short Put with $22.0 Strike and Long Put with $21.0 Strike (Expiration: 2024-06-14)
- Short Put: Delta: -0.1374366917, Premium: $0.94, ROI: 13.57%
- Long Put: Delta: -0.4762418756, Premium: $0.44, ROI: 100.0%
- Potential Net Credit: $0.94 - $0.44 = $0.50
- Risk and Reward:
- Max Gain: $0.50 if the stock stays above $22
- Max Loss: $1 (difference in strikes) - $0.50 (net credit) = $0.50
- Analysis: This setup offers a better balance of risk and reward, with a strong credit collected and a secondary put to offset potential ITM scenarios at expiry.
Mid-Term Options (Expiring 2024-07-19)
- Spread: Short Put with $23.0 Strike and Long Put with $22.0 Strike (Expiration: 2024-07-19)
- Short Put: Delta: -0.3798741379, Premium: $2.13, ROI: 14.91%
- Long Put: Delta: -0.2048922456, Premium: $1.51, ROI: 28.73%
- Potential Net Credit: $2.13 - $1.51 = $0.62
- Risk and Reward:
- Max Gain: $0.62 if the stock stays above $23
- Max Loss: $1 (difference in strikes) - $0.62 (net credit) = $0.38
- Analysis: This spread presents favorable conditions with a higher premium and a contained risk, allowing for robust profit potential if the underlying stays bullish.
Long-Term Options (Expiring 2024-10-18)
- Spread: Short Put with $24.0 Strike and Long Put with $23.0 Strike (Expiration: 2024-10-18)
- Short Put: Delta: -0.4419962401, Premium: $3.85, ROI: 26.95%
- Long Put: Delta: -0.260000881, Premium: $3.15, ROI: 46.85%
- Potential Net Credit: $3.85 - $3.15 = $0.70
- Risk and Reward:
- Max Gain: $0.70 if the stock stays above $24
- Max Loss: $1 (difference in strikes) - $0.70 (net credit) = $0.30
- Analysis: Similar to the mid-term option, this choice nicely balances a high credit received with a manageable risk profile.
Far-Term Options (Expiring 2025-01-16)
- Spread: Short Put with $25.0 Strike and Long Put with $24.0 Strike (Expiration: 2025-01-16)
- Short Put: Delta: -0.4814934742, Premium: $5.45, ROI: 30.05%
- Long Put: Delta: -0.5531225398, Premium: $3.55, ROI: 48.95%
- Potential Net Credit: $5.45 - $3.55 = $1.90
- Risk and Reward:
- Max Gain: $1.90 if the stock stays above $25
- Max Loss: $1 (difference in strikes) - $1.90 (net credit) = -$0.90 (indicating the break-even themselves but clipped to maximum favorable loss)
- Analysis: This setup yields a high credit with significant premium income, ensuring profitability while covering the strike ranges for assignments.
Conclusion
- Preferred Choices:
- Near-term (2024-05-24) options bear higher risk of assignments but can be beneficial for aggressive, bullish short-term trades.
- Mid-term (2024-06-14 and 2024-07-19) options offer a balanced risk-reward structure with substantial net credits and lower break-even points.
- Long-term (2024-10-18 and 2025-01-16) options provide the best overall strategy, allowing consistent income generation with minimized risk, ideal for investors desiring a steady return while still benefiting from the broader time-value decay of options.
Ultimately, choosing a vertical bull put spread should align with the trader's time horizon, risk appetite, and the market outlook for the underlying asset.
Vertical Bear Call Spread Option Strategy
Analysis of Vertical Bear Call Spread Strategy for Palantir Technologies Inc. (PLTR)
A vertical bear call spread is a bearish options strategy involving the purchase of a call option with a higher strike price and the sale of a call option with a lower strike price, both having the same expiration date. The primary objective is to profit if the stock price stays below the strike price of the sold call. We seek setups that offer high profitability while minimizing the risk of in-the-money (ITM) assignments. Given a target stock price that is 2% above or below the current price, and aiming to limit exposure to ITM options, I analyze the following potential spread combinations chosen based on different expiration dates and strike prices.
1. Near Term Option (Expiration: 2024-05-24)
- Short Call: Strike 19.0, Premium 2.58, Delta 0.9305
- Long Call: Strike 21.0, Premium 0.45, Delta 0.5787
Risk & Reward: - Net Credit: 2.58 - 0.45 = 2.13 - Maximum Profit: 2.13 (if the stock price remains below the lower strike of 19.0) - Maximum Loss: (21.0 - 19.0) - 2.13 = 0.87 - Profit Probability: Since the delta of the short call is high (0.9305), there is a significant ITM risk. However, the setup benefits from a high initial credit.
Conclusion: High short-delta indicates high risk of assignment, but the strong net credit offers compensating profitable potential if the stock does not rise significantly.
2. Short Term Option (Expiration: 2024-06-07)
- Short Call: Strike 19.0, Premium 2.75, Delta 0.8561
- Long Call: Strike 21.0, Premium 1.09, Delta 0.7538
Risk & Reward: - Net Credit: 2.75 - 1.09 = 1.66 - Maximum Profit: 1.66 (if the stock price remains below the lower strike of 19.0) - Maximum Loss: (21.0 - 19.0) - 1.66 = 0.34 - Profit Probability: The lower delta of the short call compared to the near-term strategy reduces ITM risk, while still offering favorable profitability.
Conclusion: This setup offers a balanced risk/reward with a lower probability of assignment due to comparatively moderated delta, reducing ITM risk.
3. Medium Term Option (Expiration: 2024-07-19)
- Short Call: Strike 19.0, Premium 2.91, Delta 0.7927
- Long Call: Strike 21.0, Premium 1.36, Delta 0.6305
Risk & Reward: - Net Credit: 2.91 - 1.36 = 1.55 - Maximum Profit: 1.55 (if the stock price remains below the lower strike of 19.0) - Maximum Loss: (21.0 - 19.0) - 1.55 = 0.45 - Profit Probability: Delta indicates a somewhat reduced ITM risk while providing a lucrative credit.
Conclusion: This medium-term strategy remains attractive due to manageable risk reflected through the delta and significant net credit.
4. Long Term Option (Expiration: 2024-09-20)
- Short Call: Strike 19.0, Premium 3.95, Delta 0.7296
- Long Call: Strike 21.0, Premium 2.97, Delta 0.6164
Risk & Reward: - Net Credit: 3.95 - 2.97 = 0.98 - Maximum Profit: 0.98 (if the stock price remains below the lower strike of 19.0) - Maximum Loss: (21.0 - 19.0) - 0.98 = 1.02 - Profit Probability: Lower delta further minimizes ITM risk and tapers maximum loss close to equal prospective gains.
Conclusion: This setup offers lower profitability but significantly reduced ITM risk, beneficial for conservative traders.
5. Extra Long Term Option (Expiration: 2026-01-16)
- Short Call: Strike 20.0, Premium 7.3, Delta 0.7228
- Long Call: Strike 22.0, Premium 6.6, Delta 0.6794
Risk & Reward: - Net Credit: 7.3 - 6.6 = 0.70 - Maximum Profit: 0.70 (if the stock price remains below the lower strike of 20.0) - Maximum Loss: (22.0 - 20.0) - 0.70 = 1.30 - Profit Probability: Delta close to lower strike further minimizes ITM risk, ensuring the probability of maximum profit remains high.
Conclusion: This very long-term spread offers a safe play with an optimized balance between reduced risk and potential profitability.
Summary
The comparative analysis above highlights five vertical bear call spread strategies with varied risk and profitability, covering expirations from near term (2 days) to very long term (604 days). Each option set balances initial credit vs. maximum risk, providing insight for both conservative and aggressive trading strategies within the given target range around PLTR's current stock price.
The most suitable choice depends on the trader's risk appetite, but the setup with a medium-term expiration (2024-07-19) offers a favorable balance between risk and return with a delta ensuring a moderate ITM risk.
Vertical Bull Call Spread Option Strategy
When designing the most profitable vertical bull call spread strategy for Palantir Technologies Inc. (PLTR), the key is to select strikes that maximize upside while minimizing assignment risk from ITM (in-the-money) options. Our goal is to frame an analysis that satisfies a target stock price that could be 2% over or under the current price, focusing on expiration dates that range from near-term to long-term.
Near-Term Strategy (Expiration: 2024-06-21, 30 days)
- Buy 17.0 Call, Sell 19.0 Call (2024-06-21):
- Buy: 17.0 Call
- Premium: $4.35
- Delta: 0.972, Gamma: 0.022, Vega: 0.217, Theta: -0.012
-
Sell: 19.0 Call
- Premium: $2.58
- Delta: 0.931, Gamma: 0.068, Vega: 0.214, Theta: -0.067
-
Net Premium: $4.35 - $2.58 = $1.77
- Max Profit: $2.00 - $1.77 = $0.23
- Max Loss: $1.77 (net premium paid)
- Potential Profit Percentage: $0.23 / $1.77 13%
This spread limits risk and keeps a moderate maximum profit, utilizing deltas that remain high but positions themselves to avoid a major risk of forced assignment.
Short-Term Strategy (Expiration: 2024-06-28, 37 days)
- Buy 18.0 Call, Sell 20.0 Call (2024-06-28):
- Buy: 18.0 Call
- Premium: $3.60
- Delta: 0.884, Gamma: 0.053, Vega: 1.342, Theta: -0.011
-
Sell: 20.0 Call
- Premium: $2.15
- Delta: 0.835, Gamma: 0.033, Vega: 1.706, Theta: -0.013
-
Net Premium: $3.60 - $2.15 = $1.45
- Max Profit: $2.00 - $1.45 = $0.55
- Max Loss: $1.45 (net premium paid)
- Potential Profit Percentage: $0.55 / $1.45 37.9%
This strategy harnesses higher spreads in premium with strong delta support and controlled theta, optimizing profit but acknowledging a higher amount of risk.
Mid-Term Strategy (Expiration: 2024-09-20, 121 days)
- Buy 17.0 Call, Sell 19.0 Call (2024-09-20):
- Buy: 17.0 Call
- Premium: $7.90
- Delta: 0.862, Gamma: 0.030, Vega: 2.741, Theta: -0.008
-
Sell: 19.0 Call
- Premium: $3.95
- Delta: 0.730, Gamma: 0.048, Vega: 4.119, Theta: -0.010
-
Net Premium: $7.90 - $3.95 = $3.95
- Max Profit: $2.00 - $3.95 = -$1.95 (must be adjusted for the wider price gap needed)
- Max Loss: $3.95 (net premium paid)
- Potential Profit Percentage: Adjusted for 2% target stock growth, expecting better pricing over time.
Long-Term Strategy (Expiration: 2024-12-20, 212 days)
- Buy 17.0 Call, Sell 19.0 Call (2024-12-20):
- Buy: 17.0 Call
- Premium: $6.29
- Delta: 0.790, Gamma: 0.028, Vega: 4.753, Theta: -0.008
-
Sell: 19.0 Call
- Premium: $2.91
- Delta: 0.793, Gamma: 0.070, Vega: 7.196, Theta: -0.013
-
Net Premium: $6.29 - $2.91 = $3.38
- Max Profit: $3.62
- Max Loss: $3.38 (net premium paid)
- Potential Profit Percentage: Adjusted ROI with delta and gamma advantages over an extended period.
Very Long-Term Strategy (Expiration: 2025-03-21, 303 days)
- Buy 17.0 Call, Sell 19.0 Call (2025-03-21):
- Buy: 17.0 Call
- Premium: $8.31
- Delta: 0.835, Gamma: 0.024, Vega: 6.875, Theta: -0.006
-
Sell: 19.0 Call
- Premium: $6.38
- Delta: 0.749, Gamma: 0.027, Vega: 8.257, Theta: -0.006
-
Net Premium: $8.31 - $6.38 = $1.93
- Max Profit: $2.00 - $1.93 = $0.07
- Max Loss: $1.93 (net premium paid)
- Potential Profit Percentage: $0.07 / $1.93 100% (if ITM 100%).
Conclusion
Across these expiration dates, balancing between risk and reward, along with minimizing forced execution, maximizes profitability. The near-term and short-term strategies possess high delta options and manageable net premiums and provide the potential for considerable profit margins while mitigating the not-necessarily desired risk of early assignment. These insights cultivated across expiration periods serve to underline a methodical approach in deriving strategic advantage in vertical bull call spreads.
Spread Option Strategy
Calendar Spread Strategy Analysis for Palantir Technologies Inc. (PLTR)
Overview
To maximize profitability while minimizing risk with a calendar spread on Palantir Technologies Inc. (PLTR), a carefully selected combination of long call and short put options needs to be employed. Specifically, to manage the risk of assignment, we target options whose premiums and deltas indicate both lower immediate risk and high potential returns. Below are five options strategies rated from near-term to long-term based on their expiration dates and profit-to-roi potential.
1. Near-Term Strategy (May 24, 2024 Expiration)
Long Call:
- Strike Price: 19.5
- Delta: 0.9975495386
- Premium: $1.92
- ROI: 32.94%
- Profit: $0.6324
Short Put:
- Strike Price: 20.5
- Delta: -0.0566894742
- Premium: $0.06
- ROI: 100%
- Profit: $0.06
Analysis: For near-term strategies, the long call at a 19.5 strike price has an extremely high delta (close to 1), which indicates a high likelihood of profitability if the stock moves in the desired direction. Additionally, the short put option at a 20.5 strike price carries a low delta, minimizing assignment risk. This strategy offers a high return on investment with relatively minimal risk of being exercised due to the considerably out-of-the-money (OTM) position of the short put.
2. Short-Term Strategy (June 7, 2024 Expiration)
Long Call:
- Strike Price: 18.5
- Delta: 0.9284448687
- Premium: $2.96
- ROI: 20.01%
- Profit: $0.5924
Short Put:
- Strike Price: 19.0
- Delta: -0.0673129804
- Premium: $0.07
- ROI: 100%
- Profit: $0.07
Analysis: The long call at an 18.5 strike is deep in the money, indicating a strong delta and thus a high probability for profit. The short put at 19.0 has a low delta, showing a low risk of being exercised. With this strategy, the high deltas ensure a substantial ROI in a favorable market, and the short put provides a sizeable premium while minimizing the risk of assignment.
3. Mid-Term Strategy (June 28, 2024 Expiration)
Long Call:
- Strike Price: 18.0
- Delta: 0.8842355251
- Premium: $3.60
- ROI: 12.57%
- Profit: $0.4524
Short Put:
- Strike Price: 21.0
- Delta: -0.3688356746
- Premium: $0.81
- ROI: 100%
- Profit: $0.81
Analysis: This mid-term strategy employs a long call that's slightly in the money to reduce purchase cost while maintaining considerable delta. The short put at a 21.0 strike benefits from higher premiums and a moderate delta, balancing potential returns with reduced assignment risk. The higher profits on short puts also add a safety cushion against market volatility.
4. Long-Term Strategy (September 20, 2024 Expiration)
Long Call:
- Strike Price: 16.0
- Delta: 0.9532315087
- Premium: $5.66
- ROI: 6.93%
- Profit: $0.3924
Short Put:
- Strike Price: 22.0
- Delta: -0.4513837684
- Premium: $2.50
- ROI: 67.50%
- Profit: $1.6876
Analysis: Long-term call at the 16.0 strike price is deeply in the money, ensuring high profit potential. The short put at a strike of 22.0 offers a high premium while avoiding immediate risk due to only moderate delta, ensuring it is less likely to be exercised, providing significant income.
5. Extended Term Strategy (June 20, 2025 Expiration)
Long Call:
- Strike Price: 20.0
- Delta: 0.3079515244
- Premium: $3.44
- ROI: 100%
- Profit: $3.44
Short Put:
- Strike Price: 25.0
- Delta: -0.4795986038
- Premium: $6.26
- ROI: 39.10%
- Profit: $2.4476
Analysis: Extended term strategies involve deep-in-the-money long calls, maximizing the delta and profit potential. The short put strike at 25.0 balances between a decent premium and moderate delta, managing assignment risk efficiently while capitalizing on time decay to generate premium income.
Conclusion
These proposed calendar spreads for Palantir Technologies Inc. have been crafted to maximize potential returns while mitigating risk. By blending high-delta short-term calls with moderate-delta long-term puts, this strategy balances the immediate risk of share assignment with profitable premium income. The variations across different expiration dates provide flexibility to adapt to changing market conditions.
Calendar Spread Option Strategy #1
To develop a profitable calendar spread options strategy for Palantir Technologies Inc. (PLTR), we are interested in positions involving a long put option and a short call option with different expiration dates. The goal is to capitalize on the differences in volatility, time decay, and other market conditions while carefully managing the risk of having shares assigned due to options being in the money (ITM). Below is an analysis of five potential choices based on expiration dates and strike prices that could yield profitable outcomes under specific market conditions, while keeping the target stock price within 2% over or under the current price.
Choice 1: Near-term Expiration
- Long Put Option: Strike Price $30.0, Expiration Date 2024-05-24
- Greeks: Delta: -0.9928, Gamma: 0.0070, Vega: 0.0317, Theta: -0.0103, Rho: -0.0016
- Premium: $7.6, ROI: 4.57%, Profit: $0.3476
- Short Call Option: Strike Price $31.0, Expiration Date 2024-06-07
- Greeks: Delta: 0.0216, Gamma: 0.0140, Vega: 0.2338, Theta: -0.006, Rho: 0.0002
- Premium: $0.04, ROI: 100.0%, Profit: $0.04
This combination minimizes near-term risk by using a deep ITM put with a high delta, which provides strong downside protection but significant time decay. The short call has a low delta, minimizing the risk of assignment, with excellent theta benefit.
Risk and Reward Analysis: - Profit Potential: Limited by the premium received from the short call ($0.04) but provides high protection from the sold put. - Risk: High theta decay risk with the put option. Low assignment risk due to the low delta on the short call.
Choice 2: Intermediate Expiration
- Long Put Option: Strike Price $34.0, Expiration Date 2024-07-19
- Greeks: Delta: -0.8820, Gamma: 0.0277, Vega: 1.7036, Theta: -0.0083, Rho: -0.0501
- Premium: $11.45, ROI: 4.35%, Profit: $0.4976
- Short Call Option: Strike Price $36.0, Expiration Date 2024-06-21
- Greeks: Delta: 0.0161, Gamma: 0.0087, Vega: 0.2502, Theta: -0.003, Rho: 0.0002
- Premium: $0.02, ROI: 100.0%, Profit: $0.02
The intermediate expiration offers balance with a higher volatility sensitivity (vega) on the put, providing potential gains in a volatile market. The short call reduces assignment risk due to low delta.
Risk and Reward Analysis: - Profit Potential: Moderately positive theta from short call while partially offset by the plans vega exposure. - Risk: Moderate due to the higher premium paid for the put - narrow window for price movements. Low assignment risk from the low delta call option.
Choice 3: Long-term Expiration
- Long Put Option: Strike Price $40.0, Expiration Date 2025-06-20
- Greeks: Delta: -0.7385, Gamma: 0.0245, Vega: 3.4135, Theta: -0.0208, Rho: -0.0813
- Premium: $15.15, ROI: 11.86%, Profit: $1.7976
- Short Call Option: Strike Price $34.0, Expiration Date 2024-07-19
- Greeks: Delta: 0.0344, Gamma: 0.0153, Vega: 0.6578, Theta: -0.0033, Rho: 0.0011
- Premium: $0.07, ROI: 100.0%, Profit: $0.07
Selecting a long expiration date offers protection and potential gains over a prolonged period, benefiting from increases in volatility (high vega).
Risk and Reward Analysis: - Profit Potential: Higher potential profit due to significant protection and high sensitivity to volatility changes. - Risk: High due to significant premium paid and potential price decay over a long period; minimal assignment risk from the short call.
Choice 4: Balanced Approach
- Long Put Option: Strike Price $30.0, Expiration Date 2024-08-16
- Greeks: Delta: -0.9687, Gamma: 0.0108, Vega: 0.7393, Theta: 0.0020, Rho: -0.0918
- Premium: $15.2, ROI: 18.08%, Profit: $2.7476
- Short Call Option: Strike Price $31.0, Expiration Date 2024-07-19
- Greeks: Delta: 0.0212, Gamma: 0.0084, Vega: 0.4381, Theta: -0.003, Rho: 0.0006
- Premium: $0.06, ROI: 100.0%, Profit: $0.06
This balanced choice uses a premium, long-dated put for volatility protection, complemented by near-dated, low-delta calls to gain from time decay and capture premium.
Risk and Reward Analysis: - Profit Potential: Steady premium collection with strong downside protection. - Risk: Higher overall cost due to put premium; minimal risk of assignment from the call.
Choice 5: High Yield Strategy
- Long Put Option: Strike Price $39.0, Expiration Date 2024-11-15
- Greeks: Delta: -0.7385, Gamma: 0.0245, Vega: 3.4135, Theta: -0.0208, Rho: -0.0813
- Premium: $17.64, ROI: 23.12%, Profit: $5.1976
- Short Call Option: Strike Price $40.0, Expiration Date 2024-12-20
- Greeks: Delta: 0.0421, Gamma: 0.0176, Vega: 0.7177, Theta: -0.0035, Rho: 0.0024
- Premium: $0.21, ROI: 100.0%, Profit: $0.21
This approach aims to maximize yield with high gamma and vega exposure.
Risk and Reward Analysis: - Profit Potential: High returns if market volatility increases. - Risk: Significant premium and risk; potential throughout the life span.
Conclusion: Selecting a calendar spread strategy depends on one's risk appetite and market outlook. While long-term options offer higher return potential due to leverage in volatility, they bear higher premiums and carry more risk. On the other hand, near-term options offer safer but smaller gains. Careful selection balancing theta-positive short calls and volatility-sensitive long puts can yield a profitable and relatively safer spread.
Calendar Spread Option Strategy #2
When evaluating the calendar spread options strategy for Palantir Technologies Inc. (PLTR), our primary goal is to identify the most profitable combinations of buying calls and selling puts at different expiration dates while mitigating the risk of being assigned shares. In this analysis, we'll use various data points such as delta, gamma, vega, theta, and rho to make our decisions, with the target stock price being within 2% of the current stock price.
Strategy Choices
- Short Put (June 7, 2024, Strike 16.0) / Long Call (August 16, 2024, Strike 12.0):
- Short Put (June 7, 2024, Strike 16.0):
- Delta: 0.9711628292, indicating a high risk of assignment.
- Premium: $6.55
- Profit potential: $0.2624
- ROI: 4.8146788991
-
Long Call (August 16, 2024, Strike 12.0):
- Delta: 0.9169580587, providing a significant upside potential.
- Premium: $9.7
- Profit potential: $0.5124
- Theta: -0.0114712065, signifying time decay will be moderate.
-
Risk and Reward Analysis:
- The short put has a high delta, which increases the risk of assignment, while the long call provides a favorable upside.
- Potential profit is mediated by the high premiums required, generating a substantial ROI for both options.
- Suitable for traders who expect the stock to remain above $16, with substantial upside potential.
-
Short Put (June 21, 2024, Strike 21.0) / Long Call (July 19, 2024, Strike 21.0):
- Short Put (June 21, 2024, Strike 21.0):
- Delta: 0.6593200038
- Premium: $1.09
- Profit potential: $0.9024
- ROI: 82.7889908257
-
Long Call (July 19, 2024, Strike 21.0):
- Delta: 0.8535440373
- Premium: $2.8
- Profit potential: $0.6124
- Theta: -0.0115606598
-
Risk and Reward Analysis:
- The short put presents a lower risk of assignment compared to the high delta options.
- The long call offers a favorable delta and moderate risk, with a lower than average theta decay.
- This strategy maintains balance, providing high ROI and substantial profit potential.
-
Short Put (July 19, 2024, Strike 30.0) / Long Call (August 16, 2024, Strike 30.0):
- Short Put (July 19, 2024, Strike 30.0):
- Delta: 0.0657155031
- Premium: $0.12
- Profit potential: $0.12
- ROI: 100.0
-
Long Call (August 16, 2024, Strike 30.0):
- Delta: 0.1532295732
- Premium: $0.38
- Profit potential: $0.38
- Theta: -0.0084820789
-
Risk and Reward Analysis:
- Both the put and call have low deltas, minimizing the risk of assignment while offering a high ROI.
- This combination is suitable for traders expecting the stock to be around or slightly above $30.
- The low theta decay on the long call enhances this options attractiveness.
-
Short Put (September 20, 2024, Strike 21.0) / Long Call (November 15, 2024, Strike 25.0):
- Short Put (September 20, 2024, Strike 21.0):
- Delta: 0.6164946318
- Premium: $2.97
- Profit potential: $2.7824
- ROI: 93.6835016835
-
Long Call (November 15, 2024, Strike 25.0):
- Delta: 0.6181782374
- Premium: $5.55
- Profit potential: $5.55
- Theta: -0.0062413401
-
Risk and Reward Analysis:
- Moderate delta on the short put reduces risk of assignment.
- The call option provides balanced upside with minimal theta decay.
- High ROI and profit potential make this a strong candidate for a bullish outlook.
-
Short Put (November 15, 2024, Strike 21.0) / Long Call (June 20, 2025, Strike 22.0):
- Short Put (November 15, 2024, Strike 21.0):
- Delta: 0.6283944201
- Premium: $3.75
- Profit potential: $3.5624
- ROI: 94.9973333333
-
Long Call (June 20, 2025, Strike 22.0):
- Delta: 0.6304734401
- Premium: $5.92
- Profit potential: $5.92
- Theta: -0.0116992345
-
Risk and Reward Analysis:
- The short puts moderate delta offers a balanced approach with minimal assignment risk.
- The long call offers substantial upside, with manageable theta decay.
- This strategy fits well for traders anticipating a sustained increase in stock value over a longer term.
Conclusion
The above five strategies balance risk and reward effectively for PLTR, taking into account varying time horizons and target stock prices. Each pair is selected to minimize the risk of share assignment while maximizing profit potential through careful consideration of Greek values and ROI capabilities. Traders should select the strategy that best aligns with their market outlook and risk appetite, ensuring robust profitability while mitigating undue risk.
Similar Companies in Software - Infrastructure:
Palo Alto Networks, Inc. (PANW), Adobe Inc. (ADBE), CrowdStrike Holdings, Inc. (CRWD), Block, Inc. (SQ), Zscaler, Inc. (ZS), Cloudflare, Inc. (NET), Microsoft Corporation (MSFT), Oracle Corporation (ORCL), Snowflake Inc. (SNOW), Splunk Inc. (SPLK), Datadog, Inc. (DDOG), Alteryx, Inc. (AYX), Report: MongoDB, Inc. (MDB), MongoDB, Inc. (MDB), C3.ai, Inc. (AI), Report: Elastic N.V. (ESTC), Elastic N.V. (ESTC), Cloudera, Inc. (CLDR), New Relic, Inc. (NEWR)
https://seekingalpha.com/article/4693710-palantir-not-as-expensive-as-it-looks
https://www.fool.com/investing/2024/05/16/this-is-palantirs-ai-growth-secret-weapon/
https://www.fool.com/investing/2024/05/16/is-it-too-late-to-buy-palantir-stock/
https://www.fool.com/investing/2024/05/16/palantir-is-seeing-unprecedented-artificial-intell/
https://seekingalpha.com/article/4693839-palantir-bootcamps-continue-to-drive-strong-us-sales
https://finance.yahoo.com/m/9d0248af-7d29-3333-b5bf-c88cca2c3113/palantir-is-seeing.html
https://seekingalpha.com/article/4693910-palantir-fears-likely-peaked-time-to-turn-bullish-upgrade
https://finance.yahoo.com/news/why-palantirs-rally-deserves-continue-140003521.html
https://www.fool.com/investing/2024/05/18/prediction-stocks-worth-more-palantir/
https://www.fool.com/investing/2024/05/18/2-millionaire-maker-artificial-intelligence-ai-sto/
https://finance.yahoo.com/m/483e5421-479d-3272-b1c4-0f87a5cc0f2f/2-millionaire-maker.html
https://finance.yahoo.com/m/4f5190b4-9a9d-330e-a0d4-9b90f6e2a194/should-you-buy-nvidia-stock.html
https://www.fool.com/investing/2024/05/19/palantir-this-brilliant-strategy-could-pay-off-big/
https://www.sec.gov/Archives/edgar/data/1321655/000132165524000071/pltr-20240331.htm
Copyright © 2024 Tiny Computers (email@tinycomputers.io)
Report ID: ZNMsUg
Cost: $0.61511
https://reports.tinycomputers.io/PLTR/PLTR-2024-05-21.html Home