The PNC Financial Services Group, Inc. (ticker: PNC)
2024-02-10
 The PNC Financial Services Group, Inc., trading under the ticker PNC, stands as a prominent banking and financial services corporation in the United States. With its headquarters located in Pittsburgh, Pennsylvania, PNC offers a wide range of services including retail banking, asset management, and corporate and institutional banking. Over the years, the company has grown significantly through strategic acquisitions and expansions, thereby enhancing its market presence and service portfolio. Notable among its acquisitions was the purchase of the U.S. operations of the Royal Bank of Canada in 2012 and the acquisition of BBVA USA in 2021. This expansion strategy has allowed PNC to become one of the largest banks in the U.S., both in terms of assets and in geographical coverage. It operates in numerous states across the country and is renowned for its strong capital and liquidity positions, accredited by its robust balance sheet and consistent performance. The group's focus on innovation and customer service has also contributed to its reputation as a leading institution in the financial services industry.
| Address | The Tower at PNC Plaza, 300 Fifth Avenue, Pittsburgh, PA, 15222-2401, United States | Phone | 888 762 2265 | Website | https://www.pnc.com |
| Industry | Banks - Regional | Sector | Financial Services | Full-Time Employees | 54,813 |
| CEO Name | Mr. William S. Demchak | CEO Pay | $4,473,475 | Previous Close | 147.93 |
| Day Low | 146.68 | Day High | 148.38 | Dividend Rate | 6.15 |
| Dividend Yield | 4.16% | Payout Ratio | 47.69% | Five-Year Avg Dividend Yield | 3.43 |
| Beta | 1.176 | Trailing PE | 11.544532 | Forward PE | 10.4950285 |
| Volume | 938,337 | Market Cap | $58,880,434,176 | Fifty-Two Week Low | 109.4 |
| Fifty-Two Week High | 161.78 | Price to Sales Trailing 12 Months | 2.837885 | Profit Margins | 26.885% |
| Shares Outstanding | 398,028,992 | Book Value | 128.395 | Price to Book | 1.1509016 |
| Last Fiscal Year End | 1703980800 (Epoch Time) | Net Income To Common | $5,152,999,936 | Trailing EPS | 12.8 |
| Forward EPS | 14.08 | Total Cash | $7,424,999,936 | Total Debt | $72,736,997,376 |
| Total Revenue | $20,747,999,232 | Operating Margins | 20.569% | Return On Assets | 1.0089% |
| Return On Equity | 11.649% | Earnings Growth | -46.4% | Revenue Growth | -4.2% |
| Sharpe Ratio | -0.10972541968220799 | Sortino Ratio | -1.6883297407337012 |
| Treynor Ratio | -0.02588839836056657 | Calmar Ratio | -0.1255500125557064 |
An in-depth analysis of PNC Financial Services Group, Inc. (PNC) incorporating the most recent technical indicators, fundamental and financial data, as well as key risk-adjusted performance ratios, indicates a nuanced outlook for the stock's movement in the upcoming months. The analysis navigates through a confluence of factors including earnings growth, revenue trends, operational margins, as well as recent price trends and volume movements.
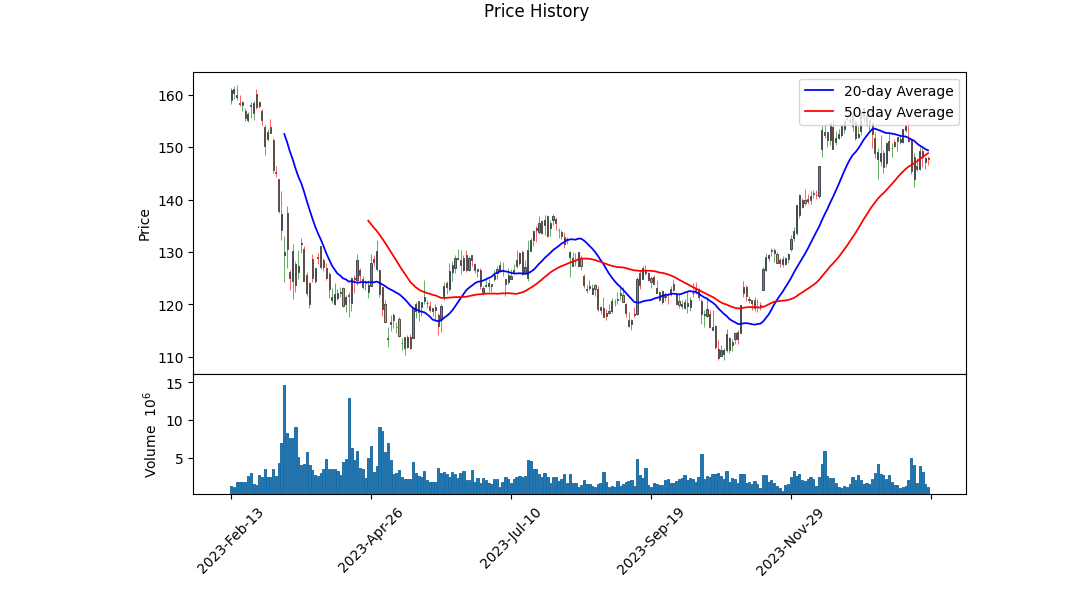
The technical setup, as observed from the summary of technical indicators, reveals a progression in stock price over the last few months leading to a substantial increase. Notably, the On-Balance Volume (OBV) demonstrates a positive trajectory suggesting accumulation, a bullish signal pointing towards increased investor interest and potentially higher future prices. However, the absence of MACD histogram values until the latter part of the observed period cautions us about the reliability of short-term momentum predictions. When the MACD histogram data becomes available, we notice a negative trend indicating a potential slowdown in momentum as the histogram values become less negative. This discrepancy between OBV and MACD could imply a consolidation phase or a preparatory stage for the next price movement direction.
From a fundamental perspective, PNC's financials reveal significant insights. The decline in earnings growth by 46.4% could initially be alarming. However, when considering the operating margins of approximately 20.57%, it suggests that the company is still retaining a high degree of profitability from its operations, which is a strong fundamental indicator. The reduction in revenue growth and the trailing Peg Ratio at 3.7757 merit careful consideration, as they may hint at valuation concerns or future growth prospects being already priced in.
The observance of risk-adjusted performance ratios such as the Sharpe, Sortino, Treynor, and Calmar ratios demonstrates a somewhat negative risk-adjusted return over the past year. The negative values in all these ratios suggest that the investment might not have compensated the investors adequately for its risk during the period considered. This factor might cause cautious sentiment among risk-averse investors.
The Balance Sheet and Cash Flow statements provide a robust view of the firms financial health. An increasing net debt position may raise flags regarding leverage; however, substantial free cash flow generation and a comprehensive capital structure signify operational strength and flexibility in financing activities.
Considering the analyst expectations, there's an anticipated recovery in earnings and revenue growth for the next year, with a positive sentiment towards growth estimates for the coming quarters. This optimism is partly reflected in the predictions of improved performance in the next fiscal year.
In conclusion, while the immediate outlook based on the technical indicators suggests a potential consolidation or slight pullback in stock price, the fundamentals of the company, especially when considering the robust operating margins and positive analyst growth outlook for the future, suggest that any downturn might be temporary. Therefore, investors could expect to see price stabilization followed by an upward trajectory in the next few months, assuming continued positive earnings revisions and stable economic conditions. Investors and stakeholders are advised to weigh the prevailing market conditions, institutional investor activity, and forthcoming quarterly earnings announcements, which could significantly influence the stock's direction.
In our analysis of The PNC Financial Services Group, Inc. (PNC) using methodologies outlined in "The Little Book That Still Beats the Market," we delved into key financial metrics such as return on capital (ROC) and earnings yield. Our calculation revealed an ROC of 1.71%, which signifies PNC's efficiency in allocating its financial resources to profitable investments in comparison to its total capital. Although ROC might appear modest, it's crucial to understand the context within the banking industry, where capital allocation plays a pivotal role in generating stable returns. Additionally, the earnings yield for PNC was calculated to be 9.09%. This figure is especially noteworthy as it indicates the rate of return on investment for shareholders, with a higher yield suggesting a more attractive investment relative to its market price. This relatively high earnings yield underscores PNC's capability to generate earnings compared to its stock price, making it a potentially appealing option for investors seeking value in the financial services sector.
| Statistic Name | Statistic Value |
| R-squared | 0.511 |
| Adj. R-squared | 0.510 |
| F-statistic | 1310 |
| Prob (F-statistic) | 5.06e-197 |
| Log-Likelihood | -2348.5 |
| No. Observations | 1257 |
| AIC | 4701 |
| BIC | 4711 |
| const | -0.0222 |
| beta | 1.2162 |
| Std Err | 0.034 |
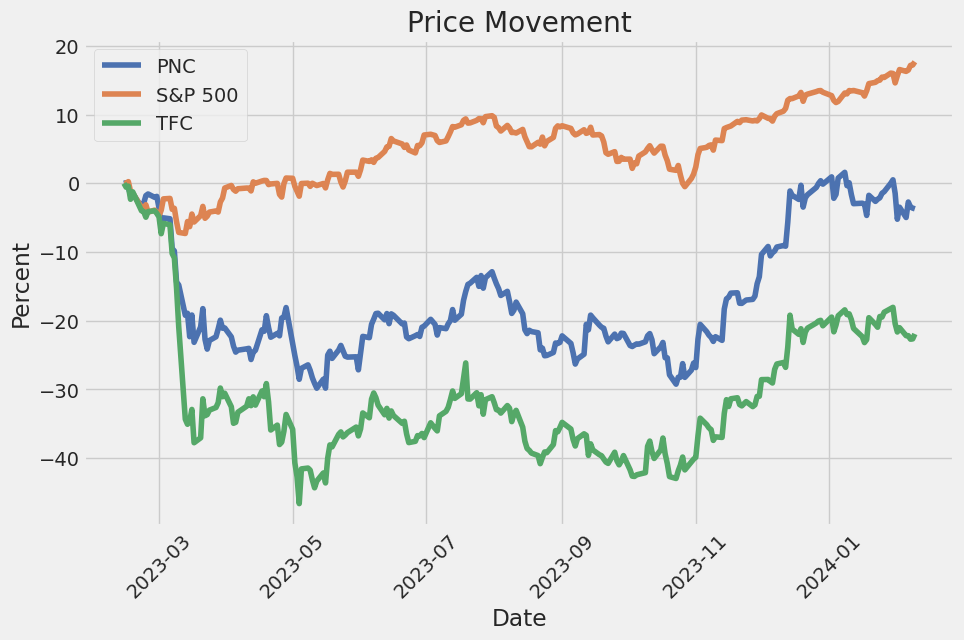
In examining the linear regression model between PNC Financial Services Group and S&P 500 (represented by the SPY ETF), we observe that the beta value of 1.2162 indicates a relatively strong positive relationship between PNC's performance and the overall market performance as depicted by SPY. This beta suggests that PNC's returns are expected to move 1.2162 times the market's returns, implying a higher sensitivity to the market's movements. On the other hand, the alpha value of -0.0222, although statistically not significant (with a p-value of 0.616), suggests that PNC has underperformed the market by an annual rate of about -2.22%, when the market's return is zero, after adjusting for the market's risk.
This relationship's validity is further supported by an R-squared value of 0.511, indicating that approximately 51.1% of the variation in PNC's returns can be explained by the market's returns (SPY). The adjusted R-squared of 0.510 is very close to the R-squared value, suggesting a good fit for the model and minimal penalty for the inclusion of the additional variable (the market). Despite the statistically insignificant alpha, the model's F-statistic and its corresponding probability suggest a very strong model fit, with a near-zero probability that the model's explanatory power is due to chance. This overall analysis depicts a strong and significant relationship between PNC and the overall market, although it suggests that PNC's returns may not significantly outperform the market after adjusting for its market exposure.
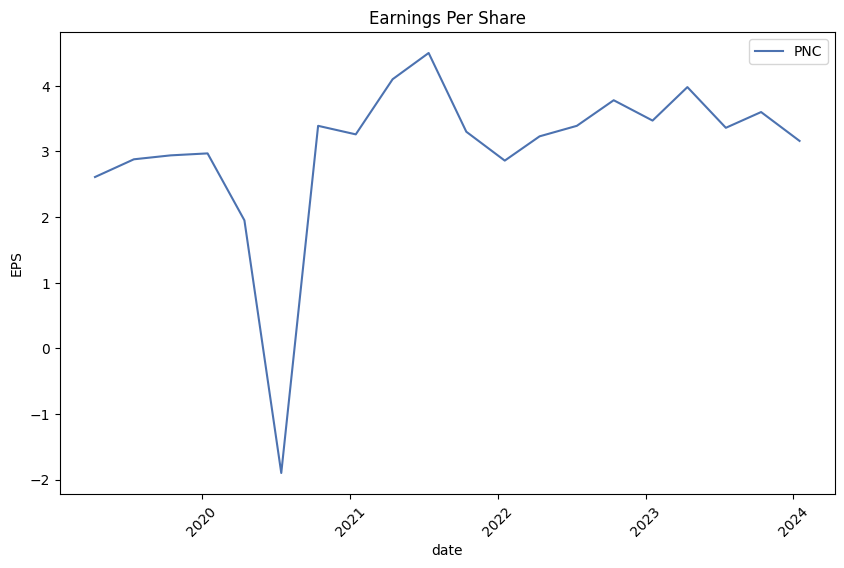
The PNC Financial Services Group, Inc., held an earnings call to discuss its quarterly and full-year performance, against the backdrop of a volatile banking environment. Chairman, President, and CEO, Bill Demchak, along with CFO Rob Reilly, highlighted several key achievements and strategic financial decisions made throughout the year. Adjusting for certain expenses, the company reported a per-share earnings increase from $13.85 in 2022 to $14.10 in 2023. These adjustments included costs related to the FDIC special assessment and a workforce reduction initiative aimed at streamlining operations. Despite the industry's broader challenges, PNC managed to expand its customer base and deepen existing relationships, thereby generating record revenue and maintaining control over core expenses.
Demchak underscored significant strides made in the fourth quarter, including the accretive acquisition of capital commitment loans from Signature, a rebound in capital markets and advisory fees, workforce optimization for expense savings in 2024, and a solid capital position bolstered by share repurchases. He emphasized the company's commitment to expense discipline while continuing to invest in growth initiatives. A strong credit quality was maintained throughout the period, with a preparedness for potential increases in credit charge-offs, especially in the Commercial Real Estate (CRE) office segment.
CFO Rob Reilly provided a detailed financial overview, touching on the balance sheet, loan performance, deposit growth, and investment securities. Average loans saw a modest increase, primarily due to acquisition activities, while investments in securities slightly declined. The improvement in Average Outstanding Common Equity Tier 1 (CET1) ratio and tangible book value underlined a robust capital structure. Despite a slight decrease in net interest income, the company experienced a considerable rise in non-interest income, driven by capital markets activities. Expense management remained a focal point, with significant cost-saving measures outlined for the forthcoming fiscal period.
Looking ahead, PNC remains cautiously optimistic, forecasting a mild recession and anticipating the Federal Reserve to begin rate cuts mid-2024. The company expects stable to slightly declining total revenue for 2024, with specific growth targets in loan activities, and adjustments in net interest income and non-interest income reflections of the strategic focus on revenue diversification. Expense stability is projected, factoring in the realized savings from workforce optimization and ongoing efficiency improvements. The discussion concluded with an interactive Q&A, where management addressed inquiries ranging from loan growth outlook and capital return strategies to competitive dynamics and future rate expectations, reinforcing confidence in PNCs strategic direction amidst an uncertain economic backdrop.
The detailed analysis of The PNC Financial Services Group, Inc. (PNC)'s recent SEC 10-Q filing reveals significant financial and operational updates for the quarter ending September 30, 2023. This examination draws upon essential financial metrics, investment portfolio adjustments, and significant movements within the loan segments, providing a comprehensive overview of PNC's current financial health and strategic maneuvers in response to the prevailing market conditions.
As of the reporting period ending September 30, 2023, a critical focus has been on PNC's investment portfolio, observing adjustments and reallocations across various asset classes. Notably, there has been a discernible emphasis on residential and commercial mortgage-backed securities, coupled with a strategic positioning within asset-backed securities and other debt instruments. These maneuvers mirror broader market trends and PNC's efforts to optimize returns while managing risk profiles amid shifting economic forecasts.
An examination of PNC's loan portfolio reveals insightful dynamics, particularly within commercial, residential, and consumer loan segments. The report details loan performance metrics, including past-due statuses, non-performing loans, and varying degrees of modifications intended to mitigate potential credit losses. These figures are crucial for understanding PNC's asset quality and the effectiveness of its credit risk management strategies amid evolving macroeconomic challenges.
Moreover, PNC's utilization of fair value measurements, especially within Level 3 assets and liabilities, offers a nuanced view of valuation techniques and inputs underpinning the carrying values of certain complex financial instruments. These include residential and commercial mortgage servicing rights, derivative contracts, and equity method investments. The complexity and judgment involved in these valuations reflect the broader uncertainties in the financial markets, making this an area of keen interest for stakeholders monitoring risk exposures and valuation sensitivities.
On the capitalization front, PNC's equity structure, including preferred stock series adjustments and comprehensive income fluctuations, underscores the bank's capital management strategies. Considering the regulatory and competitive landscapes, these capital movements reflect broader efforts to bolster financial resilience, maintain robust buffer margins, and navigate the intricacies of stakeholder expectations regarding dividends, share repurchases, and overall returns.
In conclusion, PNC's recent 10-Q filing encapsulates the various financial and strategic levers being utilized to steer the organization through a period marked by considerable economic and market volatility. The detailed financial metrics, alongside qualitative disclosures, furnish stakeholders with a clearer understanding of PNC's risk posture, performance trajectories, and strategic priorities moving forward.
The PNC Financial Services Group, Inc. has demonstrated a resilient and strategic approach to navigating the complexities of the financial landscape throughout recent times. Amidst a broader environment of economic uncertainties and the fluctuating dynamics of bank stocks, particularly noted in the surge experienced in December, PNC stood out as a formidable entity prepared to adapt to the changing tides of monetary policies and market expectations.
The Federal Reserve's hint at potential easing of interest rates in the coming year, as reported in December, has been seen as a double-edged sword for the banking sector. While it promises to stimulate loan demand and investment banking activities, it also brings to the forefront the challenges of operating in a low-interest environment, potentially squeezing banks' profit margins. Despite these looming challenges, PNC's strategic maneuvershighlighted in its Q4 2023 earnings reportsuch as expanding its digital offerings and enhancing customer experiences, suggest a proactive stance towards securing its market position and driving growth.
Notably, the banking sector's resilience, as evidenced by the performance surge from mid-October through December, demonstrates the adaptability and potential for recovery despite the specter of bank failures earlier in the spring. PNC, within this context, showcases a cautious yet optimistic outlook, balancing the emergent opportunities with strategic vigilance.
The imposition of a $16.3 billion special assessment by the FDIC, aiming to replenish the Deposit Insurance Fund (DIF) following significant banking failures, introduces an additional layer of complexity for major financial institutions, including PNC. This levy underscores the vulnerability and the inherent risks within the sector, emphasizing the importance of robust financial health and strategic foresight in weathering such systemic shocks.
Moreover, the regional banking landscape's tribulations, particularly underscored by the challenges facing regional and community banks as of Q4 2023, further delineate the sector's precarious balance between growth and sustainability. PNC's strategic pivot, as articulated by CEO Bill Demchak, signifies a notable shift in the bank's trajectoryfrom a super regional bank towards a broader, nationally recognized entity. This move, catalyzed by the 2023 banking crisis and tempered by the lessons drawn from past experiences, particularly those involving significant acquisitions, reflects an ambitious yet calculated approach to scale and competitive differentiation.
Critically, PNC's involvement in community and social initiatives, such as supporting Guardian Angels Medical Service Dogs for veterans, illustrates a multidimensional corporate philosophy that extends beyond financial metrics to societal impact. Such endeavors not only enhance corporate brand values but also embed the institution deeper within the fabric of the communities it serves.
As PNC sets its sights on the Bank of America Financial Services Conference, the stage is set for a comprehensive disclosure of its strategic intentions, financial health, and future outlook. This engagement marks an essential moment for PNC to articulate its vision, address stakeholder concerns, and position itself within the competitive hierarchy of the financial services sector.
In analyzing these componentsthe strategic responses to economic and sectoral challenges, the emphasis on digital transformation, the proactive management of regulatory implications, and the dedication to community engagementit becomes evident that PNC embodies a holistic approach to navigating the complexities of the modern financial landscape. As global economic indicators, regulatory frameworks, and competitive dynamics evolve, PNC's adaptive strategies, operational resilience, and commitment to stakeholder engagement underscore its potential to thrive amidst uncertainties, leveraging both challenges and opportunities to forge a path of sustained growth and societal contribution.
The volatility of The PNC Financial Services Group, Inc. (PNC) showcases significant fluctuations, as indicated by its analysis between February 12, 2019, and February 9, 2024. The ARCH model, a statistical method for modeling the volatility, demonstrates that changes in the company's stock returns are notably variable and can be somewhat unpredictable. Key indicators such as a high coefficient value for omega (2.7284) and substantial alpha (0.4753) highlight the stock's susceptibility to rapid changes in volatility, suggesting investors should be prepared for potential swings in value.
| Statistic Name | Statistic Value |
|---|---|
| R-squared | 0.000 |
| Adj. R-squared | 0.001 |
| Log-Likelihood | -2662.06 |
| AIC | 5328.13 |
| BIC | 5338.40 |
| No. Observations | 1257 |
| Df Residuals | 1257 |
| omega | 2.7284 |
| alpha[1] | 0.4753 |
To assess the financial risk associated with a $10,000 investment in The PNC Financial Services Group, Inc. (PNC) over a one-year period, an advanced analysis employing a combination of volatility modeling and machine learning predictions is conducted. The volatility of PNC's stock is explored through a volatility modeling technique, which is paramount for understanding the potential fluctuations in the stock's price. Meanwhile, machine learning predictions, specifically those derived from a decision-tree-based algorithm, are used to forecast future returns of the stock. The integration of these two methodologies aims to provide a detailed view of the investment's potential risk and return profile.
Volatility modeling is crucial as it aids in capturing the time-varying nature of stock price fluctuations, which is inherent in financial markets. By analyzing historical price data of PNC's stock, volatility modeling allows for the estimation of future volatility based on past trends and patterns. This is essential for risk assessment as it helps investors understand the extent of price swings they might expect in the future. Understanding volatility is a fundamental step in calculating the Value at Risk (VaR), which represents the potential loss in value of a risky asset, such as a stock, over a defined period for a given confidence interval.
The machine learning predictions, on the other hand, leverage historical data to anticipate future stock returns. By training on historical features that include past prices, volumes, and possibly other relevant financial indicators, the machine learning algorithm can predict future stock performance. The incorporation of machine learning provides a forward-looking perspective, complementing the backward-looking nature of volatility modeling. This predictive power, when combined with the volatility estimates, is instrumental in refining the risk assessment, particularly the VaR calculation.
For The PNC Financial Services Group, Inc., the analysis yields an Annual Value at Risk (VaR) at a 95% confidence level of $319.94 for a $10,000 investment. This indicates that there is a 95% chance that the investor will not lose more than $319.94 over the next year due to market fluctuations, under normal market conditions. This VaR calculation is significant as it quantifies the maximum expected loss, which is a critical factor in investment decision-making, especially for risk-averse individuals.
This sophisticated approach of marrying volatility modeling with machine learning predictions for calculating VaR showcases the dynamic nature of financial risk assessment. By understanding the projected volatility and employing predictive analytics to forecast returns, investors are better equipped to gauge the risk associated with investing in PNC. The calculated VaR provides a numeric depiction of potential investment risk, encapsulating both the estimated volatility of PNC's stock and the expected future returns as inferred by machine learning. Through this integration, the analysis offers a comprehensive view of the potential financial risks involved in equity investments, underscoring the value of combining different analytical methodologies to enhance investment risk assessment.
Analyzing the options chain for The PNC Financial Services Group, Inc. (PNC) with a focus on the most profitable call options, we need to consider a variety of factors. Specifically, we're looking at the Greeks: delta, gamma, vega, theta, and rho, alongside the expiry date, strike price, return on investment (ROI), and potential profit. Our aim is to find options that maximize profits with a target stock price set at a 5% increase over the current price.
Firstly, options with a delta close to 1 (for instance, those with a delta around 0.985) are typically in-the-money (ITM) options, indicating a high likelihood of ending profitably if the stock price moves as anticipated. These options, especially those with expiration dates furthest out (for example, those expiring on 2024-06-21 or even as far out as 2026-01-16), offer a good balance between price movement responsiveness and time for such movements to occur. However, it's worth noting that longer-term options might have higher premiums due to their higher intrinsic value and time value.
High gamma values indicate an option's delta sensitivity to the underlying stock price changes. Options with significantly high gamma (e.g., gamma values above 0.02) that are expiring soon (e.g., within 5 days) could present profitable opportunities if the stock is expected to move substantially in the near term. Yet, this comes with higher risk, as the price must move favorably before expiration.
The theta value represents the time decay of an option. In our search for profitable options, those with lower absolute theta values are preferable as they lose less value as time progresses, all else being equal. This is especially relevant for options with closer expiration dates, where time decay accelerates.
Vega measures sensitivity to volatility. Given our target for a modest 5% increase in the stock price, we might not be heavily reliant on volatility for profit. Nonetheless, options with a higher vega (e.g., vega above 10) in the short to medium term can be advantageous if an unexpected increase in volatility occurs, boosting the option premium even if the stock price doesn't change much.
Rho, while often less of a consideration in shorter-term trading, becomes more relevant in longer-dated options (e.g., options expiring in more than a year). Options with higher rho values might benefit from rising interest rates, assuming other factors remain constant.
Given these considerations, the most profitable call options seem to lie among those with strike prices just above or at our 5% target increase margin, expiring in the medium to long term (ranging from a few months to over a year). For example, options expiring on 2025-01-17 and 2026-01-16 with strike prices significantly lower than the current price are particularly attractive for their high delta values, reasonable theta, and notable vega, allowing for significant profits if the stock appreciates as anticipated.
To sum up, while selections across various expiries show promise, those looking for the most profitable call options on PNC should pay attention to longer-dated options with strike prices near or above the anticipated target stock price increase. These options balance responsiveness to stock price movements (delta and gamma), time decay resistance (theta), and sensitivity to volatility (vega), positioning traders to capitalize on anticipated upward trends in PNC's stock price.
Similar Companies in BanksRegional:
Truist Financial Corporation (TFC), KeyCorp (KEY), Western Alliance Bancorporation (WAL), Zions Bancorporation, National Association (ZION), U.S. Bancorp (USB), Fifth Third Bancorp (FITB), Citizens Financial Group, Inc. (CFG), Regions Financial Corporation (RF), Comerica Incorporated (CMA), Huntington Bancshares Incorporated (HBAN), JPMorgan Chase & Co. (JPM), Report: Bank of America Corporation (BAC), Bank of America Corporation (BAC), Wells Fargo & Company (WFC), Citigroup Inc. (C), The Goldman Sachs Group, Inc. (GS), Report: Morgan Stanley (MS), Morgan Stanley (MS), Charles Schwab Corporation (SCHW)
https://www.fool.com/investing/2024/01/10/heres-why-bank-of-america-pnc-and-wells-fargo-stoc/
https://www.youtube.com/watch?v=FH-kQ0swxHY
https://www.fool.com/investing/2024/01/22/the-fdic-assessed-16-billion-to-banks-for-last-yea/
https://finance.yahoo.com/m/9f3dee87-f96b-37fd-8a14-51d7d94c549c/regional-banks-had-another.html
https://finance.yahoo.com/video/pnc-ceo-looks-grow-bank-224326272.html
https://finance.yahoo.com/news/3-financial-stocks-sell-sector-025028471.html
https://finance.yahoo.com/news/dog-prepares-retire-144500625.html
https://finance.yahoo.com/news/lead-where-craft-story-design-150000515.html
https://finance.yahoo.com/news/pnc-executive-speak-bank-america-134500122.html
https://www.sec.gov/Archives/edgar/data/713676/000071367623000079/pnc-20230930.htm
Copyright © 2024 Tiny Computers (email@tinycomputers.io)
Report ID: G4UYcz
Cost: $0.71905
https://reports.tinycomputers.io/PNC/PNC-2024-02-10.html Home